

For the 2024/2025 academic year, there were just over 49,000 full-time teaching staff at Canadian universities, a stable number compared with 2023/2024, representing the smallest annual increase since 2016/2017. In 2024/2025, more than one-third (37.0%) of teaching staff were full professors, the highest academic rank, and two in five teachers (43.7%) were women.
Parity is not reached at all academic ranks
Over the years, women have represented a growing share of the full-time teaching staff in Canadian universities. In 2024/2025, 43.7% of teaching staff were women (more than 21,000 women), compared with 15.9% in 1984/1985, when the number of women was more than 5,000.
At universities, the career path generally begins at the assistant professor rank and moves through the associate professor level before reaching full professor. The proportion of women professors has increased from 1984/1985 to 2024/2025, exceeding that of men at the rank of assistant professor to reach 52.9% and approaching parity at the associate professor rank, reaching 45.1%. Achieving parity at the full professor rank is slower; the proportion of women at this rank increased almost sixfold in 40 years, rising from 5.7% to 33.6% (over 6,000 women) in 2024/2025.
University professors are aging
Since the mid-2000s, the end of mandatory retirement legislation in most provinces has contributed to a rapid increase in the proportion of professors aged 65 years and older. As a result, this proportion rose from 2.7% in 2005/2006 to 12.1% in 2024/2025. Among full professors, 22.6% (4,100 professors) were aged 65 years and older, up from 5.6% in 2005/2006.
From 2005/2006 to 2024/2025, the proportion of full professors increased slightly from 35.4% to 37.0%. Conversely, the proportion of assistant professors decreased from 26.9% in 2005/2006 to 19.7% in 2024/2025.
The gender wage gap persists in Canadian universities
According to recent data, in 2023/2024, salaries and benefits represented the main expenditure for Canadian universities, with salaries for full-time and part-time teachers reaching close to $13 billion.
In 2024/2025, salaries for full-time teaching staff in Canadian universities were just over $8 billion. That same year, men teaching full-time in Canadian universities earned on average $170,550 per year, while women earned on average $153,425.
A few factors can contribute to the persistence of the gender wage gap (10.0%), such as academic rank, number of years at rank, the subject taught, age group, administrative responsibilities, and the region and size of the institution. Overall, these factors account for 94.1% of the gender wage gap (see the Note to readers for more information). The rest of the gap can be explained by differences between the genders related to factors not measured through the Full-time University and College Academic Staff System survey, such as the negotiation of supplements related to market adjustments. It could also include gender bias or other behavioural differences between genders (see the Note to readers).
Chart 1: Decomposition of the gender wage gap based on average annual salaries of full-time teaching staff at Canadian universities, 2024/2025
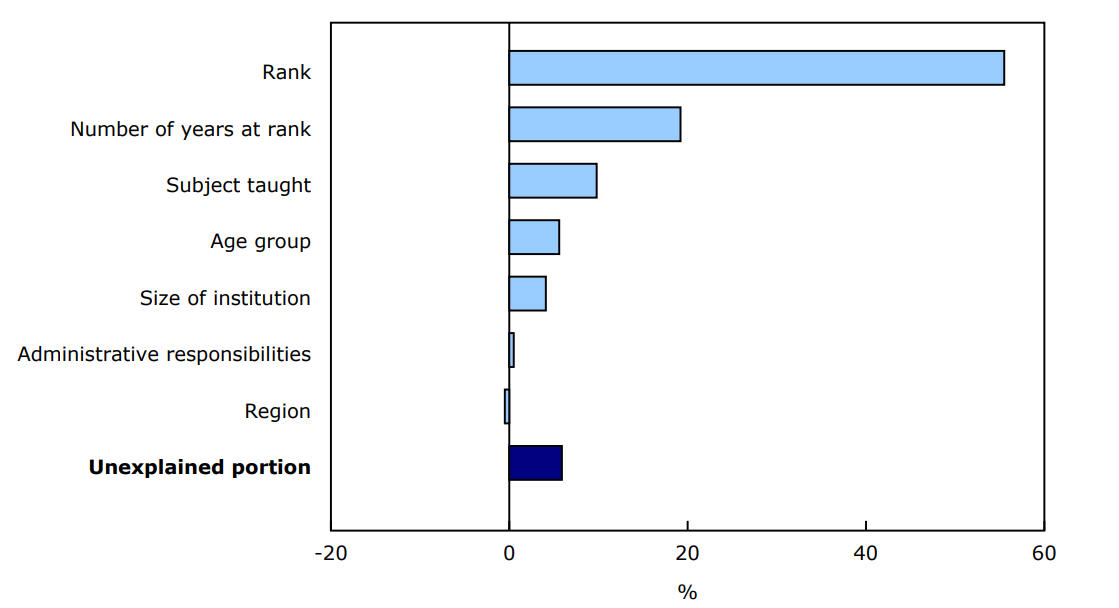
Description - Chart 1
Source: University and College Academic Staff System - Full-time Staff (3101).
Academic rank and number of years at rank are the main factors that explain the wage gap
In 2024/2025, the most important factors explaining the gender wage gap of teaching staff at Canadian universities were academic rank (55.5%) and the number of years at rank (19.2%). These factors alone accounted for almost three-quarters (74.7%) of the gender gap.
Underrepresentation of women among full professors accounts for an important portion of the wage gap
Around two-thirds of the gender wage gap attributable to rank was at the full professor rank. In 2024/2025, women were underrepresented at this highest academic rank, representing 33.6% of full professors. Consequently, achieving parity among full professors could contribute to reducing the gender wage gap.
Note to readers
The University and College Academic Staff System (UCASS) provides a detailed portrait of full-time academic staff at public universities in Canada. This includes information on gender, year of birth, year at rank, main subject taught, academic rank, salary and administrative stipends, administrative responsibilities, previous employment, and province or country of highest degree earned.
Blinder-Oaxaca decomposition is a statistical method that can be used to quantify how much of the wage differential between two groups can be explained by various control factors. This method separates the gap into an explained portion (the result of differences in characteristics between men and women) and an unexplained portion (due to any characteristics that were not included in the model, as well as all unobservable factors). The unexplained portion could include gender differences in behaviours, such as motivation or wage negotiation, as well as the impact of explicit or implicit gender-based wage discrimination, societal expectations or restricted choices in terms of gender roles in paid work, and other related issues. These kinds of factors are very difficult to measure in traditional surveys. All characteristics available in UCASS were assessed and considered when integrating the factors that could contribute to the decomposition model.
The percentages associated with each characteristic considered in the analysis show the extent to which each one contributed to the gender wage gap. The higher the percentage, the bigger the effect. A negative percentage indicates that, if all else were held constant, this factor would lead to women having a higher average salary than men.
The annual salary is the sum of the annual salary rate and administrative stipends. The gender wage gap refers to the difference between the average annual salaries of men and women, expressed as a percentage of the average annual salary for men. Rounding of numbers can result in minor discrepancies between the totals presented. Deans and directors equivalent to deans, staff with no salary and staff with a lower salary scale than regular scales are excluded from the salary analysis.
For 2024/2025, data for some institutions were estimated based on the previous year's data as a placeholder, as for various administrative reasons, these institutions were unable to submit their data to Statistics Canada prior to the deadline. For this analysis, 2023/2024 data were used for the University of Prince Edward Island and Carleton University, and 2022/2023 data were used for the University of Toronto.
Contact information
For more information, or to enquire about the concepts, methods or data quality of this release, contact us (toll-free 1-800-263-1136; 514-283-8300; infostats@statcan.gc.ca) or Media Relations (statcan.mediahotline-ligneinfomedias.statcan@statcan.gc.ca).