

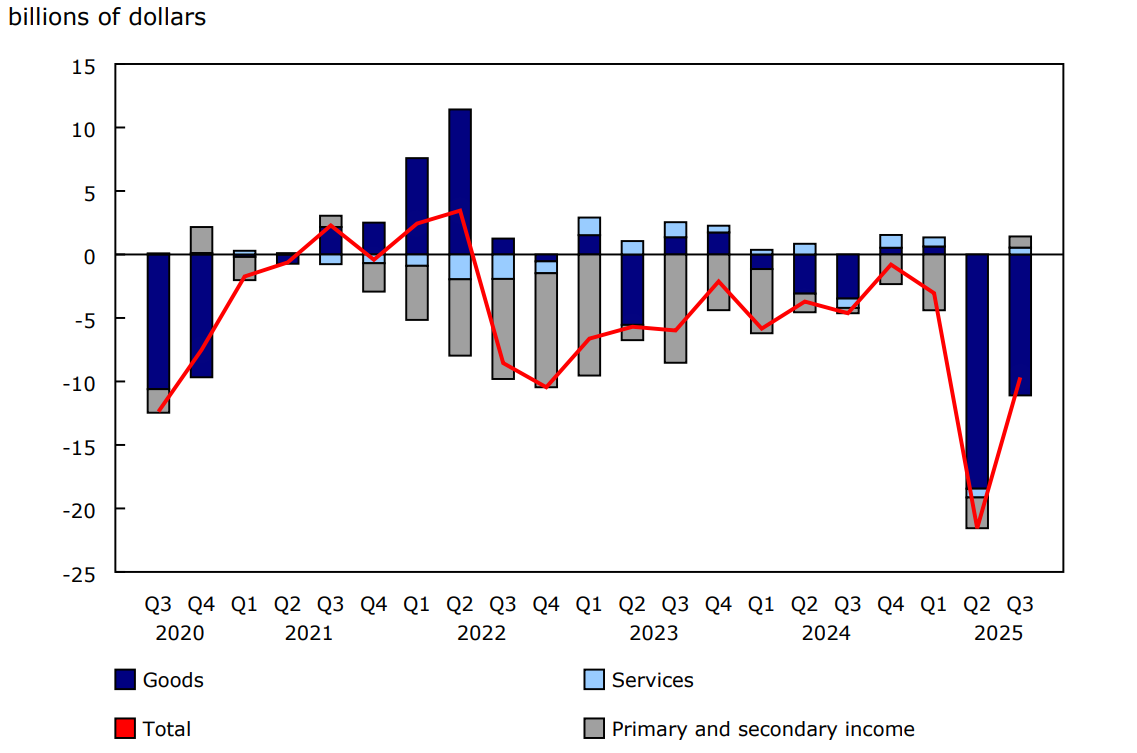
Canada's current account deficit (on a seasonally adjusted basis) narrowed by $11.9 billion to $9.7 billion in the third quarter of 2025.
The decrease in the current account deficit in the third quarter was largely due to a narrowing of the trade in goods deficit, as exports increased in the quarter while imports decreased. The investment income and trade in services components also contributed to the overall narrowing of the current account deficit.
In the financial account (unadjusted for seasonal variation), inflows of funds from abroad to finance the current account deficit came primarily from foreign investment in Canadian debt securities. While Canadian investors continued to increase their exposure to US securities, foreign investors rekindled their demand for Canadian securities in the third quarter.
Current account
Trade in goods and services deficit narrows
The trade in goods and services deficit narrowed from $19.1 billion in the second quarter to reach $10.6 billion in the third quarter. The trade in services balance moved from a deficit of $0.7 billion in the second quarter to a surplus of $0.5 billion in the third quarter, led by an increase in the commercial services surplus and a narrowing of the transportation services deficit.
Exports of goods increase, while imports decrease
The trade in goods deficit narrowed by $7.3 billion to $11.1 billion in the third quarter, following a record high of $18.4 billion in the second quarter. On a geographical basis, the goods trade surplus with the United States widened from $10.9 billion in the second quarter to $20.7 billion in the third quarter. Meanwhile, the goods trade deficit with countries other than the United States widened from $29.4 billion in the second quarter to $31.8 billion in the third quarter.
Exports of goods increased 1.8% in the third quarter to $186.0 billion, following a large decline in the second quarter (-12.6%). Higher exports in the third quarter of energy products (+8.2%), largely crude oil, and consumer goods (+4.9%) were partially offset by lower exports of metal and non-metallic mineral products (-4.8%), largely gold.
Imports of goods fell 2.0% to $197.1 billion in the third quarter, a second consecutive quarterly decline. Imports of industrial machinery (-10.1%) was the main contributor to the overall decline as a one-time high-value import recorded in the second quarter did not recur in the third quarter.
Commercial services exports increase more than imports
Exports of services rose 1.8% to $59.8 billion in the third quarter, while imports of services were down 0.3% to $59.2 billion. On a geographical basis, the services trade deficit with the United States narrowed from $0.7 billion in the second quarter to $0.5 billion in the third quarter. Meanwhile, the services trade balance with countries other than the United States went from a balanced position in the second quarter to a $1.1 billion surplus in the third quarter.
The commercial services surplus widened as exports increased by more than imports in the third quarter. Exports of commercial services rose 3.8% to $36.4 billion in the third quarter, largely due to higher receipts of computer services, as well as maintenance and repair services. Computer services were robust in the first three quarters of 2025, reaching a quarterly record high of $8.5 billion in the third quarter.
Imports of commercial services increased 2.2% to $33.9 billion in the third quarter, led by charges for use of intellectual property (+3.0% to $7.3 billion), and scientific and technical services (+7.3% to $3.0 billion).
The transportation services deficit narrowed from $4.8 billion in the second quarter to $4.2 billion in the third quarter. Imports decreased 4.6%, led by marine transport payments, while exports were up 0.9% to $5.7 billion.
Canadian imports of travel services outside the US drop slightly from record-high level of second quarter
The travel services surplus widened from $2.2 billion in the second quarter to $2.3 billion in the third quarter, as imports (-2.7%) declined more than exports (-1.7%). The decrease in imports was due to lower spending by Canadian travellers in both the United States and non-US countries. The decline in spending in the United States was the third consecutive quarterly decline, while the decrease in spending in non-US countries followed a record high level in the second quarter. Travel exports fell largely as a result of lower spending by international students while studying in Canada.
Chart 1: Current account balances
Description - Chart 1
Data table: Current account balances
Note: Data are seasonally adjusted.
Source: Table 36-10-0018-01.
Investment income surplus rises
The investment income surplus, the difference between income earned on international financial assets and paid on international liabilities, widened by $2.9 billion and totalled $7.0 billion in the third quarter. This was largely due to an increase in the direct investment income surplus. Profits earned by Canadian direct investors on their assets abroad increased more in the third quarter than those earned by foreign direct investors on their assets in Canada.
Financial account
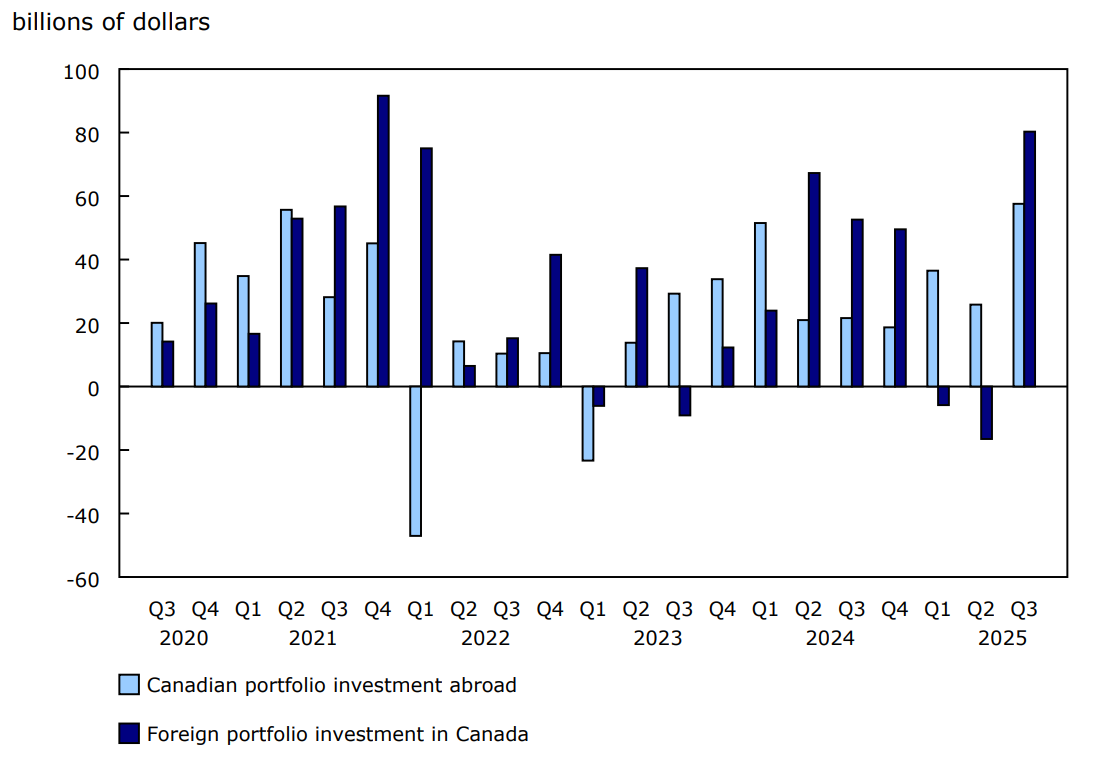
Foreign purchases of Canadian securities rebound
Foreign investors increased their holdings of Canadian securities by $80.3 billion in the third quarter, a significant increase following a total divestment of $22.4 billion in the first half of the year. In the third quarter, foreign investors increased their exposure to government debt securities by $42.9 billion, with sizable investments in both short- and long-term instruments. Foreign investment in Canadian equities rebounded in the third quarter, reaching $7.8 billion, following a divestment of $43.6 billion in the first half of the year. This was the highest investment since the first quarter of 2022.
Meanwhile, Canadian investment in foreign securities reached an unprecedented $57.6 billion in the third quarter of 2025, up from $25.8 billion in the second quarter. Canadian investors purchased $31.3 billion of foreign stocks, led by acquisitions of US equity securities (+$29.0 billion), most of which were large capitalization technology shares. Investors also added foreign debt securities (+$26.3 billion) to their portfolios in the third quarter, largely in the form of US instruments.
As a result, portfolio investment generated a net inflow of funds in the economy of $22.7 billion in the third quarter, following two consecutive quarters of net outflows of funds.
Chart 2: Foreign portfolio investment
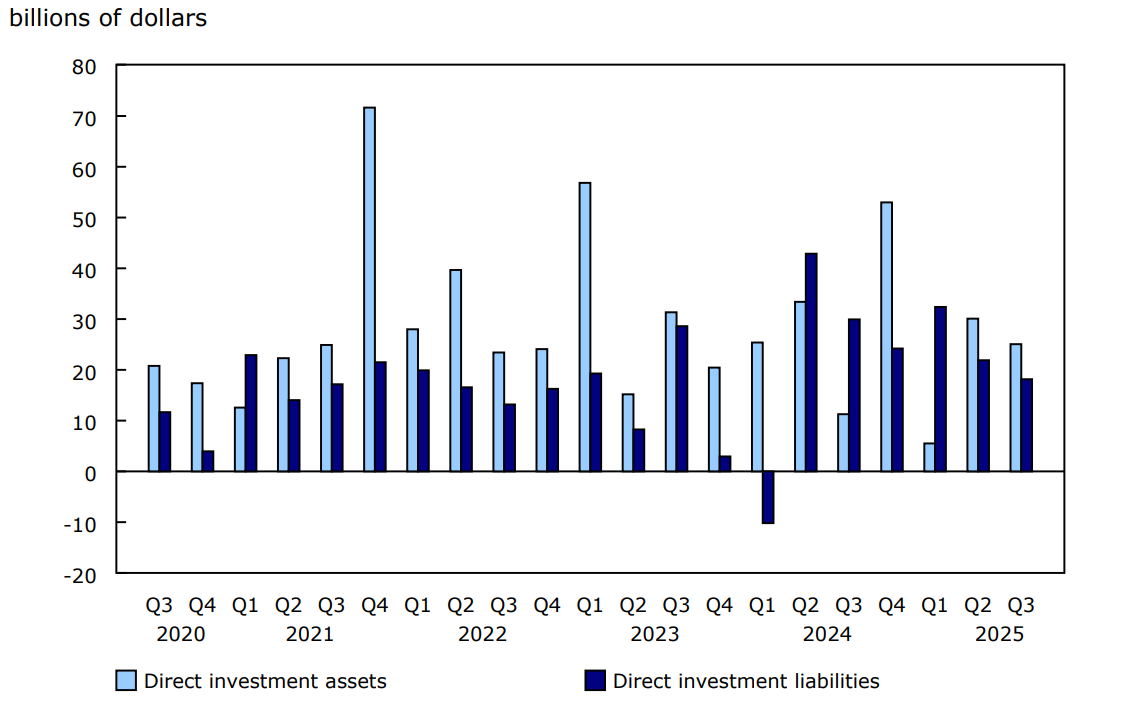
Direct investment activity slows
Canadian direct investment abroad reached $25.1 billion in the third quarter of 2025, for a total of $60.7 billion since the beginning of the year. Earnings reinvested by Canadian parent companies in their foreign affiliates accounted for most of the activity in the third quarter (+$20.3 billion). Meanwhile, merger and acquisition activities amounted to $3.0 billion, down from $8.5 billion in the second quarter. On a sector basis, the largest investments were in the management of companies and enterprises and the trade and transportation sectors. On a geographical basis, the majority of the investment was in countries other than the United States.
Foreign direct investment in Canada amounted to $18.2 billion in the third quarter of 2025, with the year-to-date value of foreign direct investment now reaching $72.4 billion. Earnings reinvested in Canadian affiliates by their foreign parents (+$9.6 billion) and merger and acquisition transactions (+$5.4 billion) were the largest contributors to the activity in the third quarter. On a sector basis, the largest investments were in the trade and transportation, finance and insurance, and manufacturing sectors. On a geographical basis, two-thirds of the foreign direct investment in Canada in the third quarter originated from both the United States and the United Kingdom.
Chart 3: Foreign direct investment
Note to readers
Impact of US government shutdown
Quarterly balance of international payments statistics rely on international merchandise trade data as an input. In the context of the partial shutdown of the US federal government, Statistics Canada did not receive data on Canadian exports to the United States for the reference month of September. Therefore, exceptionally this quarter, special estimates on Canadian international merchandise exports to the United States for the reference month of September were produced to compile third quarter statistics. Further discussion on the compilation of these special estimates is included in the ''Monthly international merchandise trade data incorporated in the Canadian macroeconomic accounts for the third quarter of 2025'' release in today's Daily.
The impact of the US government shutdown was mostly on the measurement of trade in goods. However, the measurement of trade in services with the United States was also impacted, albeit to a lesser extent. Trade relating to exports and imports of certain transport services, as well as maintenance and repair services are reported through customs documents received from the US government. As a result, these categories of services are more likely to undergo revision in the next quarterly production.
Revisions
This release incorporates statistical revisions back to 2022 as part of the annual revision exercise of the Canadian System of Macroeconomic Accounts. Revisions reflect, in large part, the integration of benchmark survey data and updates resulting from the integration of trade data in the broader analytical context of the supply and use tables.
Revisions also reflect the integration of new data sources as well as updates to coverage and statistical methods, including the introduction of updated seasonal factors contributing to revisions to quarterly figures and patterns.
Results from the Annual International Transactions in Commercial Services survey, Postsecondary Student Information System national survey, and student and work permit data from Immigration, Refugees and Citizenship Canada were incorporated to create updated values of Canada's exports and imports of services. Notable revisions included those to Canada's computer services exports as well as imports of royalties and management services.
Definitions
The balance of international payments covers all economic transactions between Canadian residents and non-residents in three accounts: the current account, the capital account and the financial account.
The current account covers transactions in goods, services, compensation of employees, investment income and secondary income (current transfers).
The current account data in this release are seasonally adjusted. For information on seasonal adjustment, see Seasonally adjusted data - Frequently asked questions.
The capital account covers capital transfers and transactions in non-produced, non-financial assets.
The financial account covers transactions in financial assets and liabilities.
In principle, a net lending (+) or net borrowing (-) derived from the sum of the current and capital accounts corresponds to a net lending (+) or net borrowing (-) derived from the financial account. In practice, as data are compiled from multiple sources, this is rarely the case and gives rise to measurement error. The discrepancy (net errors and omissions) is the unobserved net inflow or outflow.
Foreign direct investment is presented on an asset-liability principle basis (that is, gross basis) in the financial account. Foreign direct investment can also be presented on a directional principle basis (that is, net basis), as shown in supplementary foreign direct investment tables 36-10-0025-01, 36-10-0026-01, 36-10-0473-01 and 36-10-0656-01. The difference between the two foreign direct investment conceptual presentations resides in the classification of reverse investment, such as (1) Canadian affiliates' claims on foreign parents and (2) Canadian parents' liabilities to foreign affiliates. Under the asset-liability presentation, (1) is classified as an asset and included in direct investment assets, also referred to as "direct investment abroad" in this text, and (2) is classified as a liability and included in direct investment liability, also referred to as "direct investment in Canada" in this text.
For more information on the balance of payments, consult, "Chapter 8. International Accounts," in the User Guide: Canadian System of Macroeconomic Accounts, available on Statistics Canada's website. The chapter also presents the most recent balance of payments statistics.
Real-time table
Real-time table 36-10-0042-01 will be updated on December 8. For more information, see Real-time data tables.
Next release
Balance of international payments data for the fourth quarter of 2025 will be released on February 26, 2026.
Contact information
For more information, or to enquire about the concepts, methods or data quality of this release, contact us (toll-free 1-800-263-1136; 514-283-8300; infostats@statcan.gc.ca) or Media Relations (statcan.mediahotline-ligneinfomedias.statcan@statcan.gc.ca).