

Based on 2021 Census data, the following infographic is about the languages spoken at home in Canada.
Description - Increasing diversity of languages, other than English or French, spoken at home
Language spoken predominantly at home.Note1
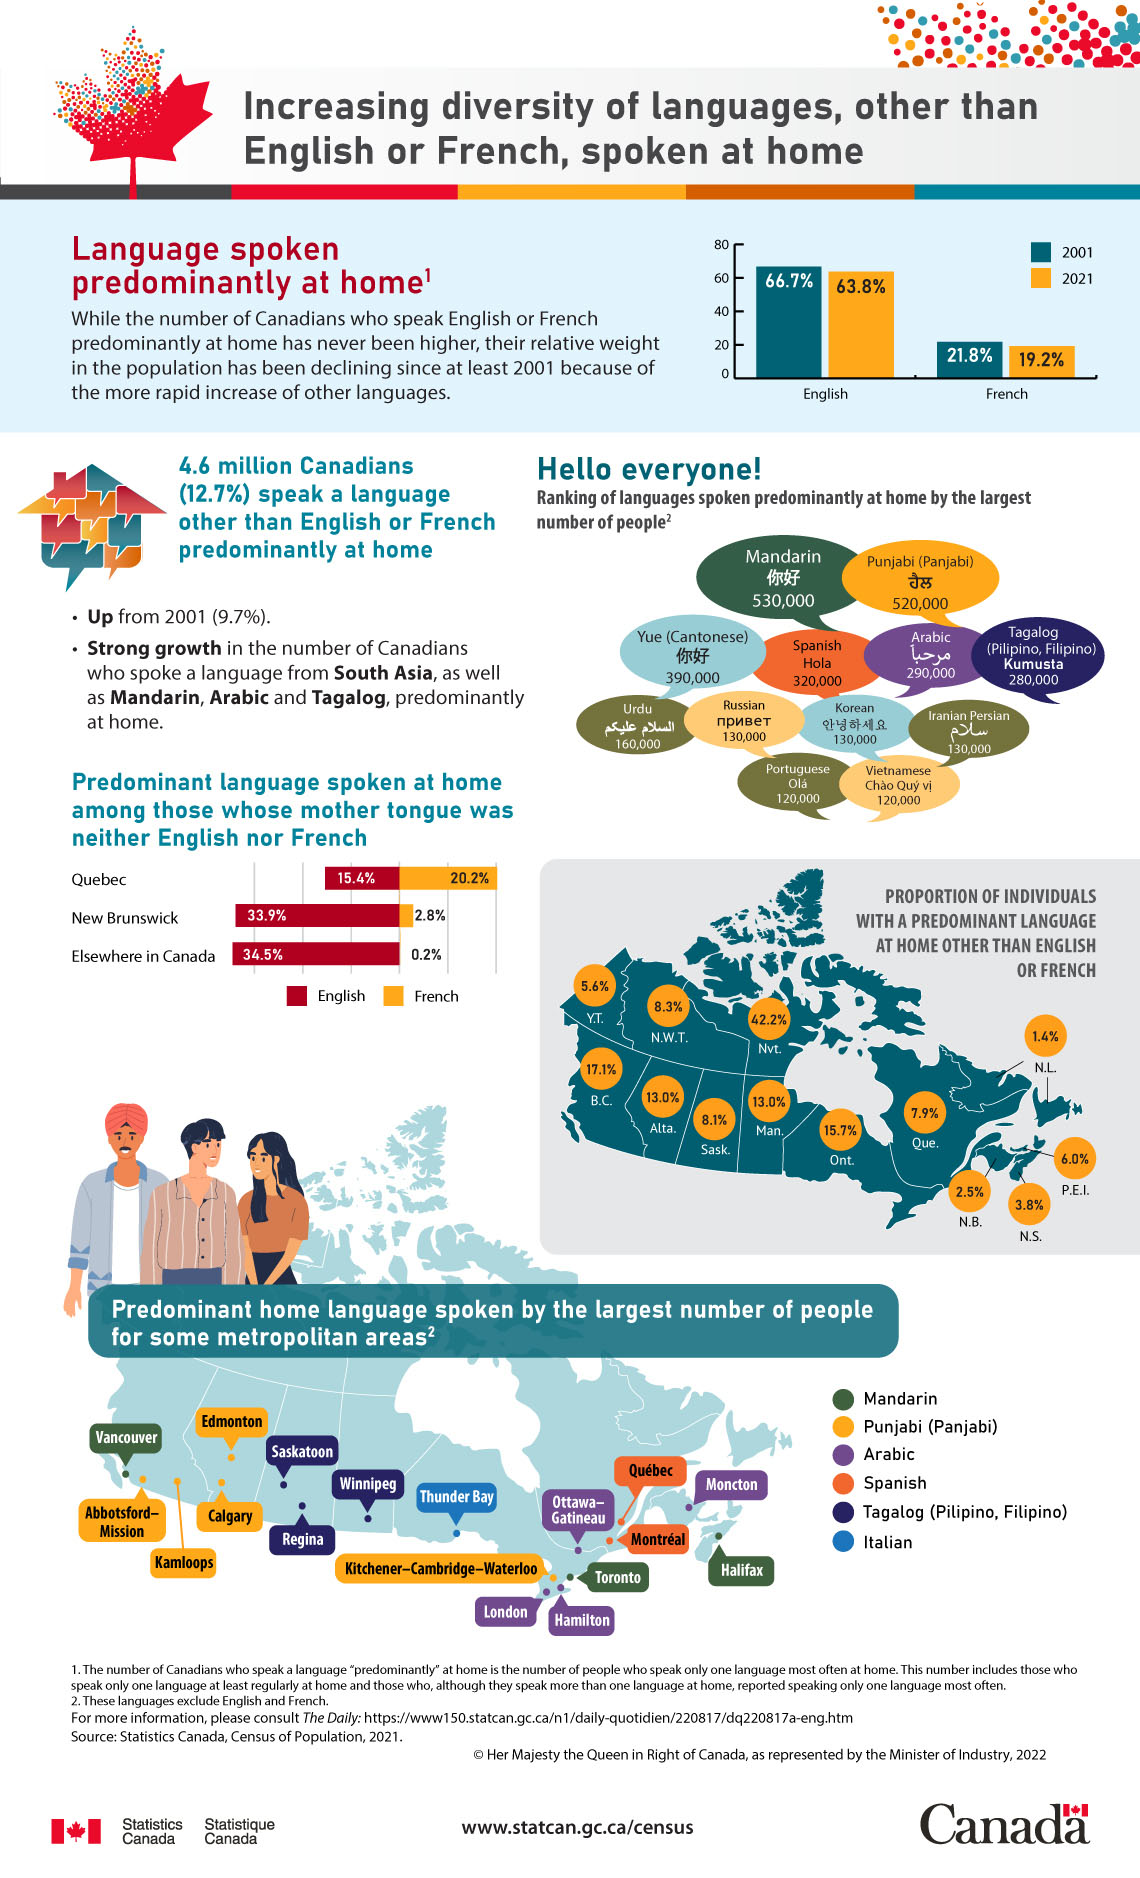
While the number of Canadians who speak English or French predominantly at home has never been higher, their relative weight in the population has been declining since at least 2001 because of the more rapid increase of other languages.
| Language | Year | |
|---|---|---|
| 2001 | 2021 | |
| English | 66.7% | 63.8% |
| French | 21.8% | 19.2% |
4.6 million Canadians (12.7%) speak a language other than English or French predominantly at home
- Up from 2001 (9.7%).
- Strong growth in the number of Canadians who spoke a language from South Asia, as well as Mandarin, Arabic and Tagalog, predominantly at home.
Hello everyone! Ranking of languages spoken predominantly at home by the largest number of peopleNote2
| Language | Number of people |
|---|---|
| Mandarin | 530,000 |
| Punjabi (Panjabi) | 520,000 |
| Yue (Cantonese) | 390,000 |
| Spanish | 320,000 |
| Arabic | 290,000 |
| Tagalog (Pilipino, Filipino) | 280,000 |
| Urdu | 160,000 |
| Russian | 130,000 |
| Korean | 130,000 |
| Iranian Persian | 130,000 |
| Portuguese | 120,000 |
| Vietnamese | 120,000 |
Predominant language spoken at home among those whose mother tongue was neither English nor French
| Geography | Language | |
|---|---|---|
| French | English | |
| Quebec | 20.2% | 15.4% |
| New Brunswick | 2.8% | 33.9% |
| Elsewhere in Canada | 0.2% | 34.5% |
Proportion of individuals with a predominant language at home other than English or French
| Geography | Proportion of individuals with a predominant language at home other than English or French |
|---|---|
| Newfoundland and Labrador | 1.4% |
| New Brunswick | 2.5% |
| Nova Scotia | 3.8% |
| Yukon | 5.6% |
| Prince Edward Island | 6.0% |
| Quebec | 7.9% |
| Saskatchewan | 8.1% |
| Northwest Territories | 8.3% |
| Manitoba | 13.0% |
| Alberta | 13.0% |
| Ontario | 15.7% |
| British Columbia | 17.1% |
| Nunavut | 42.2% |
Predominant home language spoken by the largest number of people for some metropolitan areasNote2
| Metropolitan area | Language spoken most often at home by the most people |
|---|---|
| Toronto | Mandarin |
| Vancouver | Mandarin |
| Montréal | Spanish |
| Calgary | Punjabi (Panjabi) |
| Ottawa–Gatineau | Arabic |
| Edmonton | Punjabi (Panjabi) |
| Winnipeg | Tagalog (Pilipino, Filipino) |
| Hamilton | Arabic |
| Kitchener–Cambridge–Waterloo | Punjabi (Panjabi) |
| Saskatoon | Tagalog (Pilipino, Filipino) |
| Regina | Tagalog (Pilipino, Filipino) |
| Kamloops | Punjabi (Panjabi) |
| London | Arabic |
| Halifax | Mandarin |
| Abbotsford–Mission | Punjabi (Panjabi) |
| Moncton | Arabic |
| Québec | Spanish |
| Thunder Bay | Italian |
For more information, please consult The Daily.
Source: Statistics Canada, Census of Population, 2021.
Notes
- Footnote 1.
-
The number of Canadians who speak a language "predominantly" at home is the number of people who speak only one language most often at home. This number includes those who speak only one language at least regularly at home and those who, although they speak more than one language at home, reported speaking only one language most often.
- Footnote 2.
-
These languages exclude English and French.
Contact information
For more information, or to enquire about the concepts, methods or data quality of this release, contact us (toll-free 1-800-263-1136; 514-283-8300; infostats@statcan.gc.ca) or Media Relations (statcan.mediahotline-ligneinfomedias.statcan@statcan.gc.ca).