


It’s a balancing act, living in the digital age. Are Canadian youth and adults spending enough time exercising when they’re not in front of a screen? And when they are in front of one, is that screen time too much?
In the past two years, the COVID-19 pandemic has affected that balance, as Canadians’ routines were significantly changed, resulting in fewer opportunities for organized physical activity and more time spent at home.
Statistics Canada recently released two research papers, one focusing on youth and the other on adults, on the pandemic’s ongoing impact on physical activity and screen time.
The research, drawing on Canadian Community Health Survey data from 2018 to early 2022 (excluding 2019), found that there were differences among age groups and genders, and across waves of the pandemic.
Most adults maintained activity levels, while older adults increased theirs
The research on adults shows that the percentage of women aged 18 to 64 years meeting the physical activity recommendation remained stable from 2018 (54.3%) to 2020 before the pandemic (January to March, 52.9%), to 2020 during the pandemic (September to December, 54.9%) and through 2021 (55.1%).
Men in the same age group saw a decline in the percentage meeting the physical activity recommendation from 63.0% in 2018 to 59.8% in 2021. Meanwhile, men and women aged 65 years and older saw a steady increase through 2021, exceeding their pre-pandemic levels by 30 minutes of physical activity per week.
Activity levels for boys and girls dropped in 2020, but only boys rebounded in 2021-2022
The research on youth shows that about 6 in 10 boys (60.4%) met the physical activity recommendation in the spring of 2018, but this dropped to 36.9% in the fall of 2020—its lowest point. One year later, nearly two-thirds (65.6%) of boys were meeting the recommendation—more than in 2018.
Conversely, nearly half (46.8%) of girls met the recommendation in the spring of 2018. This proportion dropped to its lowest point of about one-quarter (26.5%) in the winter of 2021 and rose to a high of roughly 4 in 10 (40.8%) in the fall of 2021.
Less time available for screen time on school and work days
About 4 in 10 youth (40.7%) met the screen time recommendation (two hours or less per day) on school days in 2018, dropping to less than 3 in 10 (29.1%) in 2021. On weekends, these proportions dropped from 21.4% in 2018 to 13.2% in 2021.
As well, there was a decrease in the proportion of youth who were meeting the screen time recommendation from November 2021 to February 2022, when the Omicron wave forced school closures and curtailed activities.
Similar to youth, there was a shift from the lowest category of screen-time usage to the highest among adults. Over half (53.9%) of adults met the screen-time recommendation on work days in 2018, but this dropped 8.9 percentage points to 45.0% in 2021. On non-work days, it was a 9.8 percentage-point difference (from 37.8% to 28.0%) over the same period.
Conversely, the percentage of adults who spent four or more hours a day in front of screens on a non-work day increased 9.8 percentage points, from 27.3% in 2018 to 37.0% in 2021.
Online screen time continues to increase
The latest data from the Canadian Internet Use Survey indicate an increase in screen time. Of the 94.5% of Canadians that used the Internet in 2022, just over 3 in 10 (30.6%) spent 10 to less than 20 hours a week on general usage (excluding time spent watching streamed video content and using video gaming services)—up 10.8 percentage points from 2020.
The proportion of those spending less than 10 hours a week on general Internet usage declined 6.8 points to 38.3% in 2022, and for those who spent 20 hours or more, it was a 1.8-point decline to 25.4%.
Screen time, by percentage of adults
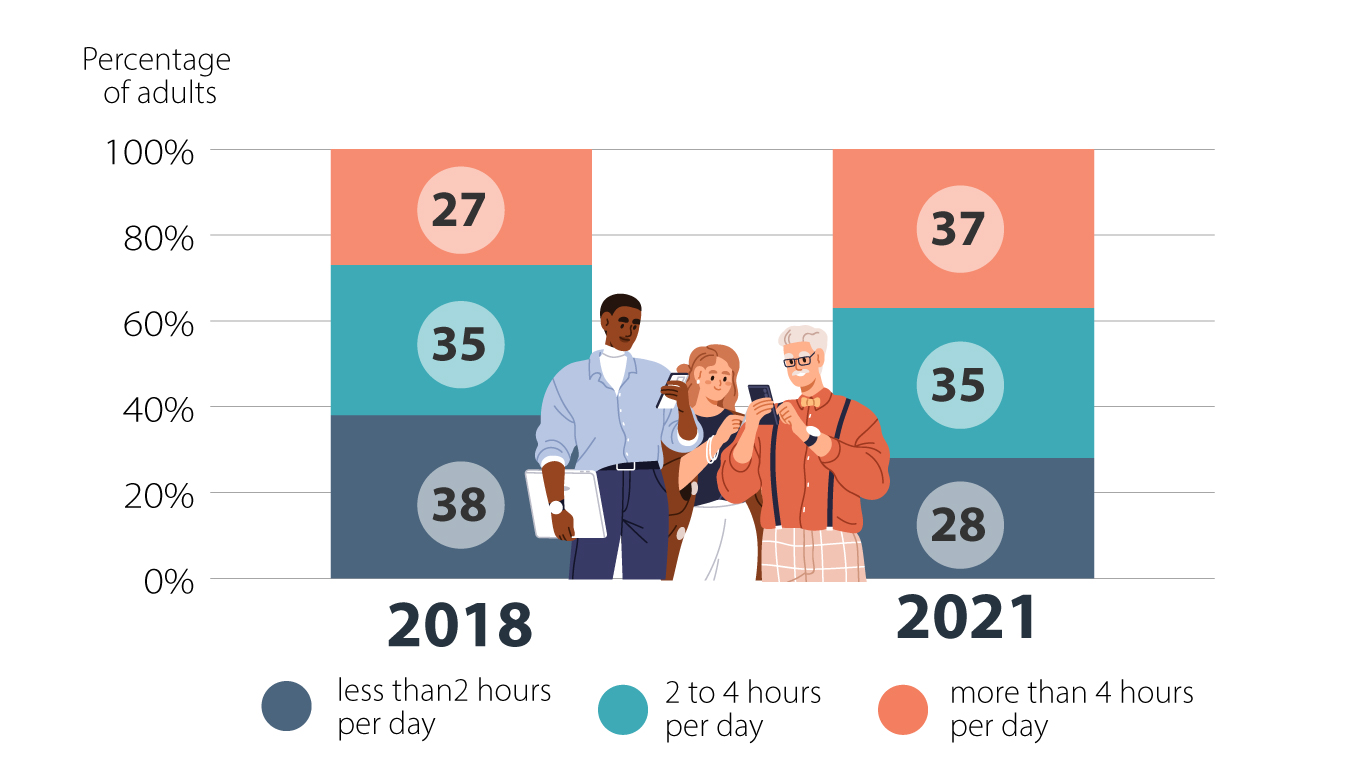
Description - Screen time, by percentage of adults
The title of the chart is “Screen time, by percentage of adults”
This is a vertical bar chart, stacked with a line.
The vertical axis represents percentage rates.
The vertical axis starts at 0% and goes to 100%, with increments of 20%.
The horizontal axis represents two years: 2018 and 2021. Each bar represents a year.
Each bar is divided into three categories of screen usage, all adding up to 100%. The first category is less than 2 hours per day, the second category is 2 to 4 hours per day, and the third category is more than 4 hours per day.
At period 2018, the first category is 38%, the second category is 35%, and the third category is 27%.
At period 2021, the first category is 28%, the second category is 35%, and the third category is 37%.
Screen- and exercise-related household purchases
The average Canadian household expenditure on computer equipment and supplies increased from $390 in 2019 to $758 in 2021, according to recently released data from the Survey on Household Spending.
Over the same period, households spent more money on televisions but less on TV and satellite radio services, perhaps an indication of a shift toward streamed video.
Average expenditures decreased for sports, athletic and recreational equipment and related services (from $208 to $178) but increased for bicycles (from $40 to $106).
Getting active outside
An increasing proportion of Canadian households reported participating in one or more outdoor activities close to home, ranging from walking and running to cycling and yoga. Nearly 8 in 10 (78%) did so in 2021, up from 77% in 2019 and 73% in 2017.

StatsCAN app
Download the StatsCAN app today to have these articles at your fingertips! Already using the app? Leave a review in the Apple App Store and Google Play and let us know what you think.
Contact information
For more information, contact the Statistical Information Service (toll-free 1-800-263-1136; 514-283-8300; infostats@statcan.gc.ca) or Media Relations (statcan.mediahotline-ligneinfomedias.statcan@statcan.gc.ca).