


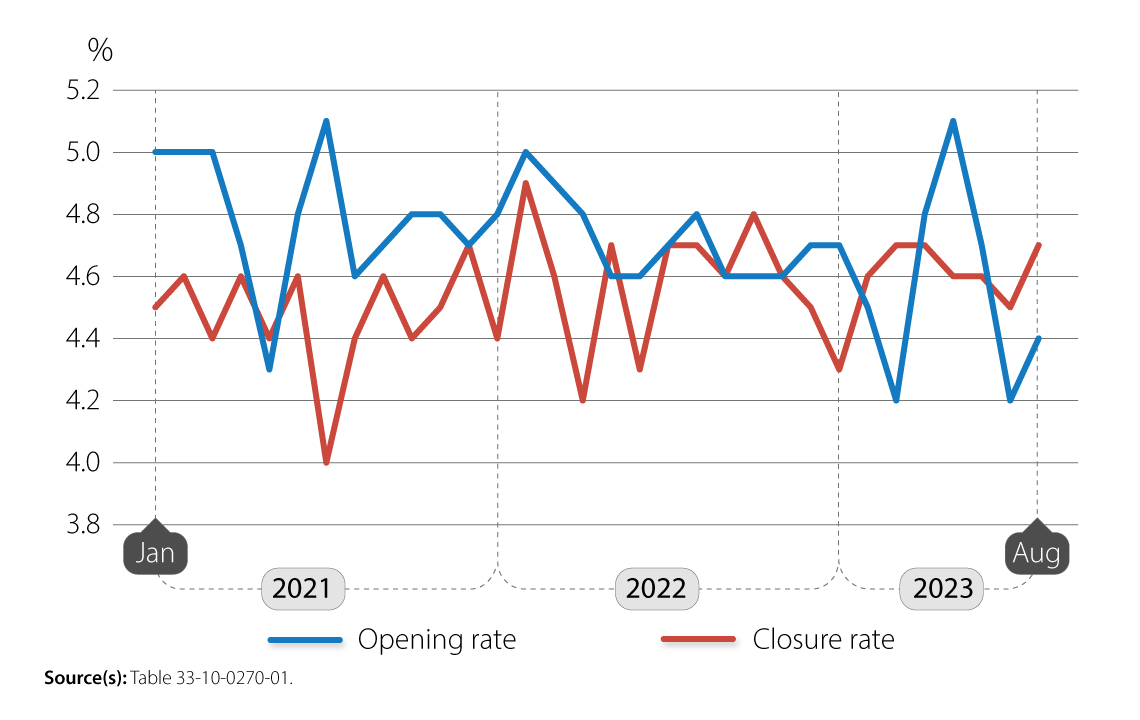
The business opening rate rose from 4.2% in July to 4.4% in August, following two consecutive months of contractions. The opening rate was 0.3 percentage points below its 2015-2019 historical average before the COVID-19 pandemic.


The business closure rate grew 0.2 percentage points to 4.7% in August 2023, slightly above its historical average of 4.6%. This was the first increase in the business closure rate since March. The number of business insolvency filings rose to 382 in August compared with 342 in July.
In August, the number of active businesses remained relatively unchanged (-0.1%; -856) for a third month in a row, as the 0.2 percentage point growth in the opening rate was offset by a similar increase in the closure rate. The real gross domestic product held moderately stable for the second straight month, while payroll employment (excluding public administration) dropped by 0.3% in August.
Chart 1: Monthly business openings and closures as a percentage of active businesses, business sector, January 2021 to August 2023, seasonally adjusted data
Description - Monthly business openings and closures as a percentage of active businesses, business sector, January 2021 to August 2023, seasonally adjusted data
The title of the chart is “Monthly business openings and closures as a percentage of active businesses, business sector, January 2021 to August 2023, seasonally adjusted data".
This is a line chart.
The vertical axis shows the rates of openings and closures, from 3.8% to 5.2%, by increments of 0.2%.
The horizontal axis shows years from January 2021 to August 2023, by increments of one year.
There are two series in this chart.
The first series is Opening rate. The lowest points in this line are 4.2% in March and July 2023, and the highest points in this line are 5.1% in July 2021 and May 2023.
The second series is Closure rate. The lowest point in this line is 4.0% in July 2021, and the highest point in this line is 4.9% in February 2022.
Source(s): Table 33-10-0270-01.
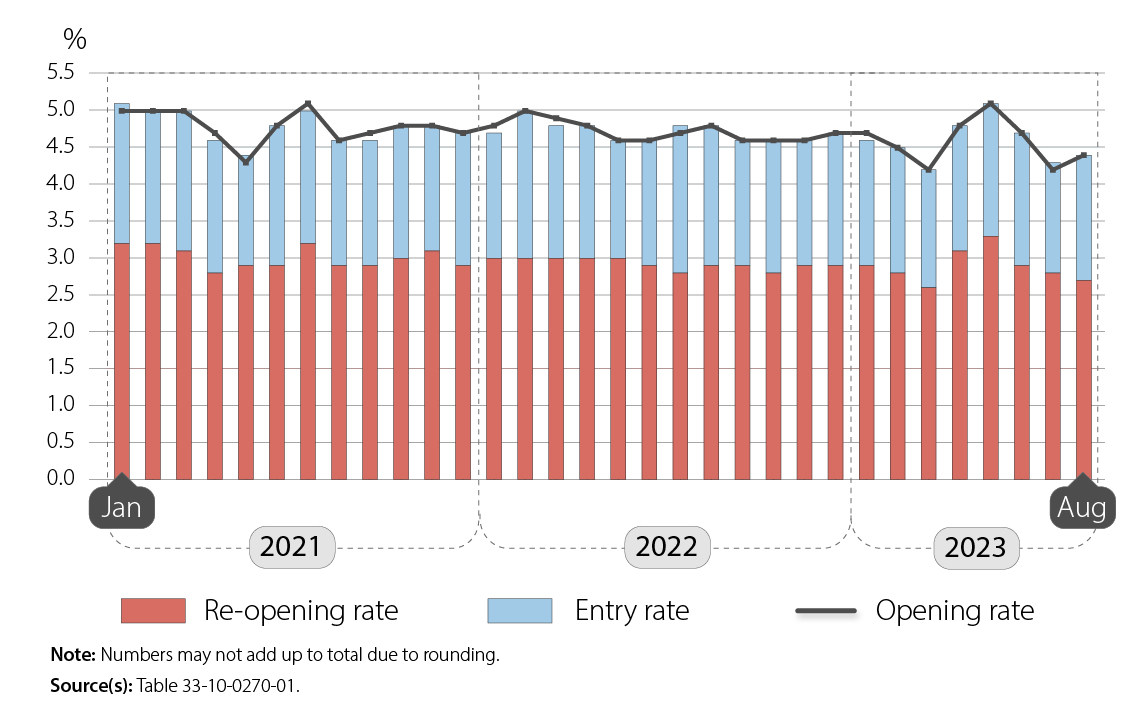
The rise in the opening rate in August was entirely driven by the 0.2 percentage-point increase in the entry rate (1.7%). The re-opening rate edged down 0.1 percentage points to 2.7%, its third consecutive decrease. Both the re-opening rate (-0.2 percentage points) and the entry rate (-0.1 percentage points) were below their respective historical averages.
Chart 2: Business opening rate and its components, business sector, January 2021 to August 2023, seasonally adjusted data
Description - Chart 2: Business opening rate and its components, business sector, January 2021 to August 2023, seasonally adjusted data
The title of the chart is “Business opening rate and its components, business sector, January 2021 to August 2023, seasonally adjusted data".
This is a vertical stacked bar chart with line.
The vertical axis represents the % rate.
The vertical axis starts at 0.0% and goes to 5.5%, by increments of 0.5%.
The horizontal axis represents the months and year and goes from January 2021 to August 2023.
There are three series. The first series represents the re-opening rate. The second series represents the entry rate. The third series represents the opening rate.
At period January 2021, the first series is at 3.2%, the second series is at 1.9% and the third series is at 5.0%.
At period February 2021, the first series is at 3.2%, the second series is at 1.8% and the third series is at 5.0%.
At period March 2021, the first series is at 3.1%, the second series is at 1.9% and the third series is at 5.0%.
At period April 2021, the first series is at 2.8%, the second series is at 1.8% and the third series is at 4.7%.
At period May 2021, the first series is at 2.9%, the second series is at 1.5% and the third series is at 4.3%.
At period June 2021, the first series is at 2.9%, the second series is at 1.9% and the third series is at 4.8%.
At period July 2021, the first series is at 3.2%, the second series is at 1.8% and the third series is at 5.1%.
At period August 2021, the first series is at 2.9%, the second series is at 1.7% and the third series is at 4.6%.
At period September 2021, the first series is at 2.9%, the second series is at 1.7% and the third series is at 4.7%.
At period October 2021, the first series is at 3.0%, the second series is at 1.8% and the third series is at 4.8%.
At period November 2021, the first series is at 3.1%, the second series is at 1.7% and the third series is at 4.8%.
At period December 2021, the first series is at 2.9%, the second series is at 1.8% and the third series is at 4.7%.
At period January 2022, the first series is at 3.0%, the second series is at 1.7% and the third series is at 4.8%.
At period February 2022, the first series is at 3.0%, the second series is at 2.0% and the third series is at 5.0%.
At period March 2022, the first series is at 3.0%, the second series is at 1.8% and the third series is at 4.9%.
At period April 2022, the first series is at 3.0%, the second series is at 1.8% and the third series is at 4.8%.
At period May 2022, the first series is at 3.0%, the second series is at 1.6% and the third series is at 4.6%.
At period June 2022, the first series is at 2.9%, the second series is at 1.7% and the third series is at 4.6%.
At period July 2022, the first series is at 2.8%, the second series is at 2.0% and the third series is at 4.7%.
At period August 2022, the first series is at 2.9%, the second series is at 1.9% and the third series is at 4.8%.
At period September 2022, the first series is at 2.9%, the second series is at 1.7% and the third series is at 4.6%.
At period October 2022, the first series is at 2.8%, the second series is at 1.8% and the third series is at 4.6%.
At period November 2022, the first series is at 2.9%, the second series is at 1.7% and the third series is at 4.6%.
At period December 2022, the first series is at 2.9%, the second series is at 1.8% and the third series is at 4.7%.
At period January 2023, the first series is at 2.9%, the second series is at 1.7% and the third series is at 4.7%.
At period February 2023, the first series is at 2.8%, the second series is at 1.7% and the third series is at 4.5%.
At period March 2023, the first series is at 2.6%, the second series is at 1.6% and the third series is at 4.2%.
At period April 2023, the first series is at 3.1%, the second series is at 1.7% and the third series is at 4.8%.
At period May 2023, the first series is at 3.3%, the second series is at 1.8% and the third series is at 5.1%.
At period June 2023, the first series is at 2.9%, the second series is at 1.8% and the third series is at 4.7%.
At period July 2023, the first series is at 2.8%, the second series is at 1.5% and the third series is at 4.2%.
At period August 2023, the first series is at 2.7%, the second series is at 1.7% and the third series is at 4.4%.
Source(s): Table 33-10-0270-01.
Note(s): Numbers may not add up to total due to rounding.
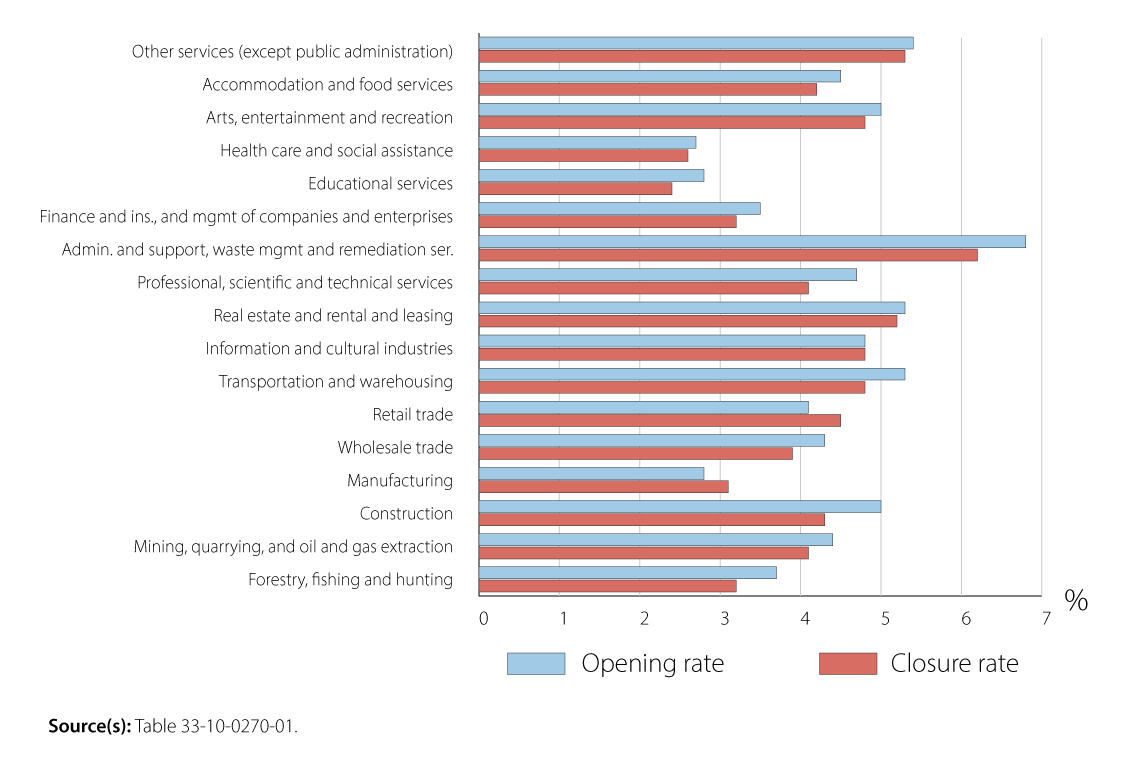
Chart 3: Business opening and closure rates, August 2023, by sector, seasonally adjusted data
Description - Chart 3: Business opening and closure rates, August 2023, by sector, seasonally adjusted data
The title of the chart is “Business opening and closure rates, August 2023, by sector, seasonally adjusted data".
This is a horizontal bar chart.
The horizontal axis shows the business opening rate and the business closure rate from 0% to 1% by increments of 1 percentage point.
The vertical axis shows the sectors.
There are two series of bars for each sector. The blue bar represents the opening rate, and the orange bar represents the closure rate.
The first set of bars represents the other services (except public administration) sector, where the opening rate was at 3.7% and the closure rate, at 3.2%.
The second set of bars represents the accommodation and food services sector, where the opening rate was at 4.4% and the closure rate, at 4.1%.
The third set of bars represents the arts, entertainment and recreation sector, where the opening rate was at 5.0% and the closure rate, at 4.3%.
The fourth set of bars represents the health care and social assistance sector, where the opening rate was at 2.8% and the closure rate, at 3.1%.
The fifth set of bars represents the educational services sector, where the opening rate was at 4.3% and the closure rate, at 3.9%.
The sixth set of bars represents the finance and insurance, and managements of companies and enterprises sector, where the opening rate was at 4.1% and the closure rate, at 4.5%.
The seventh set of bars represents the administrative and support, waste management and remediation services sector, where the opening rate was at 5.3% and the closure rate, at 4.8%.
The eighth set of bars represents the professional, scientific and technical services sector, where the opening rate was at 4.8% and the closure rate, at 4.8%.
The ninth set of bars represents the real estate and rental and leasing sector, where the opening rate was at 5.3% and the closure rate, at 5.2%.
The 10th set of bars represents the information and cultural industries sector, where the opening rate was at 4.7% and the closure rate, at 4.1%.
The 11th set of bars represents the transportation and warehousing sector, where the opening rate was at 6.8% and the closure rate, at 6.2%.
The 12th set of bars represents the retail trade sector, where the opening rate was at 3.5% and the closure rate, at 3.2%.
The 13th set of bars represents the wholesale trade sector, where the opening rate was at 2.8% and the closure rate, at 2.4%.
The 14th set of bars represents the manufacturing sector, where the opening rate was at 2.7% and the closure rate, at 2.6%.
The 15th set of bars represents the construction sector, where the opening rate was at 5.0% and the closure rate, at 4.8%.
The 16th set of bars represents the mining, quarrying, and oil and gas extraction sector, where the opening rate was at 4.5% and the closure rate, at 4.2%.
The 17th set of bars represents the forestry, fishing and hunting sector, where the opening rate was at 5.4% and the closure rate, at 5.3%.
Source(s): Table 33-10-0270-01.
Business openings and closures are mainly driven by smaller businesses. In August, businesses employing 1 to 4 workers accounted for 85.8% of openings and 83.7% of closures. In addition, 12.8% of opening and 14.0% of closing businesses employed 5 to 19 persons.
The series on temporary business closures and exits (or "permanent closures") is now updated to include data up to February 2023
The exit rate held steady at 1.9% in February, 0.2 percentage points above its historical average of 1.7%.


With the exception of retail trade (1.3% exit rate; -0.3 percentage points compared with the previous month), the exit rate remained unchanged or varied little in all sectors in February.
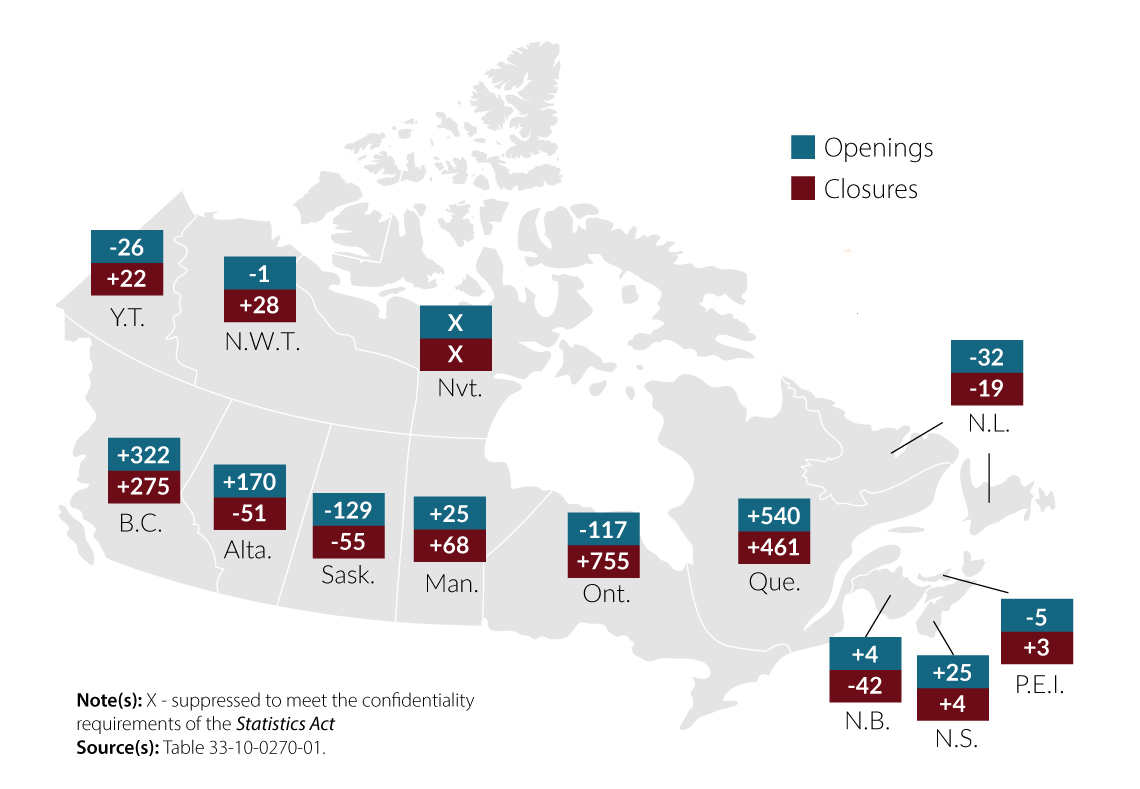
Chart 4: Change in the number of business openings and closures by province and territory from July to August 2023, seasonally adjusted data
Description - Chart 4: Change in the number of business openings and closures by province and territory from July to August 2023, seasonally adjusted data
The title of the map is "Change in the number of business openings and closures by province and territory from July to August 2023, seasonally adjusted data".
This is a map of Canada by province and territory showing the change in business openings and in business closures from July to August 2023.
Quebec, British Columbia and Alberta drove the increase in the overall number of business openings. The overall rise in business closures was led by Ontario, Quebec and British Columbia.
In Newfoundland and Labrador, the number of business openings decreased by 32 and the number of business closures decreased by 19.
In Prince Edward Island, the number of business openings decreased by 5 and the number of business closures increased by 3.
In Nova Scotia, the number of business openings increased by 25 and the number of business closures increased by 4.
In New Brunswick, the number of business openings increased by 4 and the number of business closures decreased by 42.
In Quebec, the number of business openings increased by 540 and the number of business closures increased by 461.
In Ontario, the number of business openings decreased by 117 and the number of business closures increased by 755.
In Manitoba, the number of business openings increased by 25 and the number of business closures increased by 68.
In Saskatchewan, the number of business openings decreased by 129 and the number of business closures decreased by 55.
In Alberta, the number of business openings increased by 170 and the number of business closures decreased by 51.
In British Columbia, the number of business openings increased by 322 and the number of business closures increased by 275.
In Yukon, the number of business openings decreased by 26 and the number of business closures increased by 22.
In the Northwest Territories, the number of business openings decreased by 1 and the number of business closures increased by 28.
In Nunavut, the change in business openings and closures is not available.
Note(s): NA signifies "suppressed to meet the confidentiality requirements of the Statistics Act".
Source(s): Table 33-10-0270-01.
Related products
Definitions, data sources and methods
Previous release
Data tables
- Experimental estimates for business openings and closures for Canada, provinces and territories, census metropolitan areas, seasonally adjusted
- Experimental estimates for business openings and closures by employment size for Canada, provinces and territories, census metropolitan areas, seasonally adjusted
StatsCAN app
Did you know you can read StatsCAN Plus articles and more on the StatsCAN app? If you’re already using the app, let us know what you think by leaving a review in the Apple App Store and Google Play.
Contact information
For more information, contact the Statistical Information Service (toll-free 1-800-263-1136; 514-283-8300; infostats@statcan.gc.ca) or Media Relations (statcan.mediahotline-ligneinfomedias.statcan@statcan.gc.ca).