

While the hot days of summer are not generally associated with the cold or flu season, approximately one in seven Canadians reported having a respiratory infection in the summer of 2024. This is what they told us about their experience.
In August and September 2024, we asked Canadians if they had experienced any symptoms over the past month that made them think they might have had a respiratory infection, such as COVID-19, a cold, the flu or respiratory syncytial virus. Nearly 14% of Canadians reported having a respiratory infection during this period.
Among all age groups, individuals aged 25 to 34 years (16.0%) and 35 to 44 years (15.8%) were more likely to report having a recent respiratory infection (i.e., in the month preceding the survey). Relatively higher rates were also observed among members of groups, organizations or associations (14.5%), women (14.4%) and people working at a paid job or business (14.1%).
There were no significant differences in the recent respiratory infection rates among the provinces, between racialized and non-racialized groups or between Indigenous and non-Indigenous groups.
Most Canadians who report having a respiratory infection exhibit mild or moderate symptoms
Symptoms of a respiratory infection generally vary from one season to another, depending on the type and strain of the virus. Most Canadians (90.0%) who reported having a respiratory infection in the summer of 2024 exhibited symptoms of mild or moderate severity.
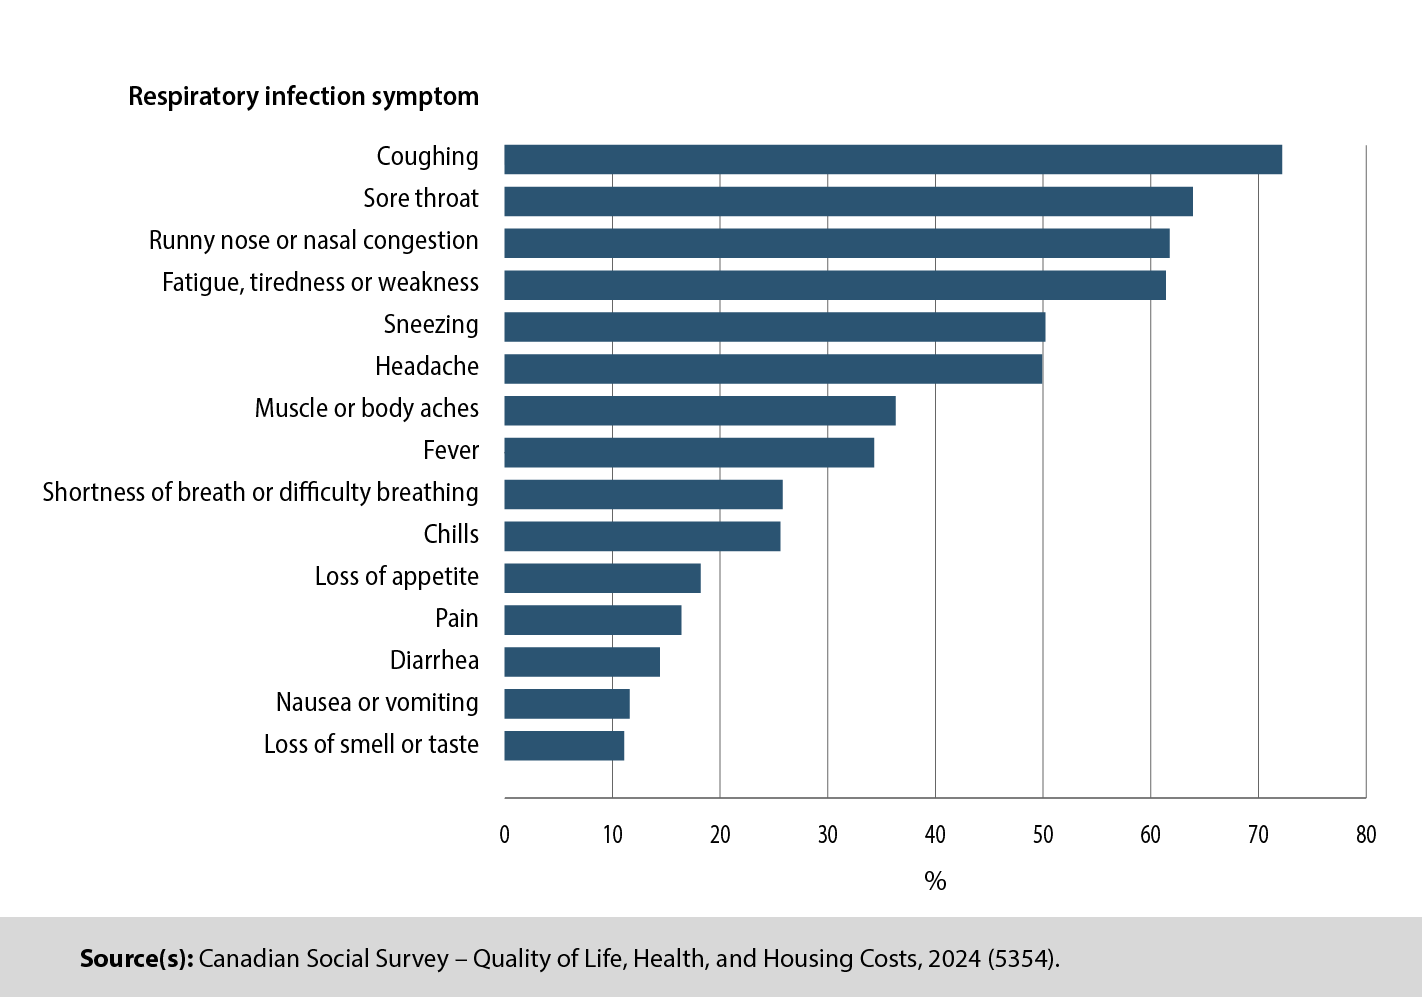
The most commonly reported acute symptoms among the majority of individuals who reported having a respiratory infection were coughing (72.2%), a sore throat (63.9%) and runny nose or nasal congestion (61.8%). Approximately 1 in 3 respiratory infection sufferers reported having a fever, 1 in 4 reported having shortness of breath or chills, and just over 1 in 10 reported having nausea and vomiting or a loss of taste and smell.
Chart 1: Type and prevalence of respiratory infection symptoms Canadians report experiencing, July to September 2024
Description - Chart 1: Type and prevalence of respiratory infection symptoms Canadians report experiencing, July to September 2024
The title of this chart is “Type and prevalence of respiratory infection symptoms Canadians report experiencing, July to September 2024.”
This is a horizontal bar chart.
The horizontal axis shows the percentage of respondents who reported experiencing the symptom due to their respiratory infection in the month preceding the survey, ranging from 0% to 80% by increments of 10%.
The vertical axis displays the 15 respiratory infection symptoms respondents reported experiencing from their respiratory infection.
The 1st bar represents the respiratory infection symptom of coughing, and the percentage of respondents reporting experiencing this symptom was 72.2%.
The 2nd bar represents the respiratory infection symptom of sore throat, at 63.9%.
The 3rd bar represents the respiratory infection symptom of runny nose or nasal congestion, at 61.8%.
The 4th bar represents the respiratory infection symptom of fatigue, tiredness or weakness, at 61.4%.
The 5th bar represents the respiratory infection symptom of sneezing, at 50.2%.
The 6th bar represents the respiratory infection symptom of headache, at 49.9%.
The 7th bar represents the respiratory infection symptom of muscle or body aches, at 36.3%.
The 8th bar represents the respiratory infection symptom of fever, at 34.3%.
The 9th bar represents the respiratory infection symptom of shortness of breath or difficulty breathing, at 25.8%.
The 10th bar represents the respiratory infection symptom of chills, at 25.6%.
The 11th bar represents the respiratory infection symptom of loss of appetite, at 18.2%.
The 12th bar represents the respiratory infection symptom of pain, at 16.4%.
The 13th bar represents the respiratory infection symptom of diarrhea, at 14.4%.
The 14th bar represents the respiratory infection symptom of nausea or vomiting, at 11.6%.
The 15th bar represents the respiratory infection symptom of loss of smell or taste, at 11.1%.
Source(s): Canadian Social Survey – Quality of Life, Health, and Housing Costs, 2024 (5354).
One in three Canadians who report having a respiratory infection consult a health care service provider about their symptoms
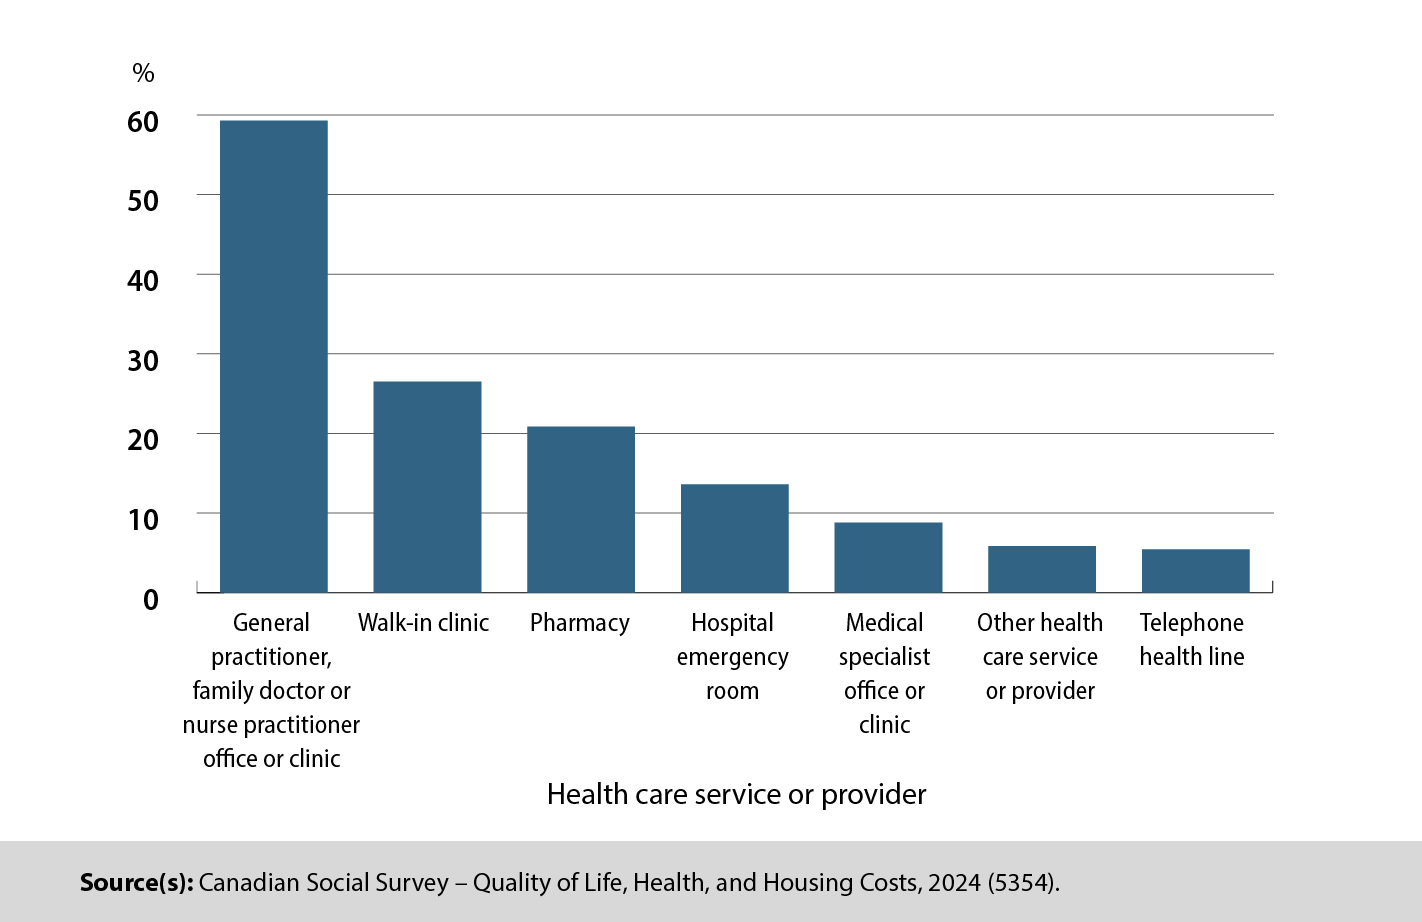
Among Canadians who reported having a respiratory infection, over one in four (28.9%) consulted at least one health care service provider for their symptoms. Of them, the majority visited a general practitioner, family doctor or nurse practitioner’s office or clinic (59.3%), while 26.5% visited a walk-in clinic for their respiratory infection.
Among Canadians who reported visiting a health care service provider for a respiratory infection in the month prior to the survey, over two-thirds (70.3%) had a chronic condition, 60.4% were women and almost half (48.8%) were individuals aged 25 to 54 years.
Chart 2: Type of health care service or provider consulted by Canadians who reported having a respiratory infection, July to September 2024
Description - Chart 2: Type of health care service or provider consulted by Canadians who reported having a respiratory infection, July to September 2024
The title of this chart is “Type of health care service or provider consulted by Canadians who reported having a respiratory infection, July to September 2024.”
This is a vertical bar chart.
The horizontal axis displays the types of health care services or providers respondents consulted for their respiratory infection.
The vertical axis shows the percentage of respondents who reported consulting health care services or providers due to their respiratory infection in the month preceding the survey, ranging from 0% to 60% by increments of 10%.
The first bar represents general practitioner, family doctor or nurse practitioner office or clinic, and the percentage of respondents who consulted this type of service or provider was 59.3%.
The second bar represents walk-in clinic, at 26.5%.
The third bar represents pharmacy, at 20.9%.
The fourth bar represents hospital emergency room, at 13.6%.
The fifth bar represents medical specialist office or clinic, at 8.8%.
The sixth bar represents other health care service or provider, at 5.9%.
The seventh bar represents telephone health line, at 5.4%.
Source(s): Canadian Social Survey – Quality of Life, Health, and Housing Costs, 2024 (5354).
Canadians living with a self-identified disability or chronic health condition are most likely to report having a recent respiratory infection
Canadians with a pre-existing health condition or illness were more likely to report having a recent respiratory infection in the summer of 2024 than those in good health.
Canadians seeking care in the past month who self-identified with a disability (15.9%) or those with a chronic health condition (14.7%) were more likely to report having a recent respiratory infection than those who did not self-identify with a disability (12.9%) or did not have a chronic health condition (11.9%).
People who perceived their health in general as fair to poor in summer 2024 were more likely to report having a recent respiratory infection in the past month (16.9%) than those with good to excellent general health (12.7%).
Canadians who reported their mental health as being fair to poor (18.1%) were also more likely to report having a recent respiratory infection in the past month than those who reported having good to excellent mental health (12.2%).
📲 Looking for more? Staying informed has never been easier!
Follow the “Health” subject in the StatsCAN app to receive personalized updates and stay connected with the most recent articles, reports and analyses.
Contact information
For more information, contact the Statistical Information Service (toll-free 1-800-263-1136; 514-283-8300; infostats@statcan.gc.ca) or Media Relations (statcan.mediahotline-ligneinfomedias.statcan@statcan.gc.ca).