


Canada has nearly 8.8 million square kilometres of land area, along with an estimated 1.3 million square kilometres of freshwater area and 247 000 kilometres of coastline. In other words, there’s a lot to see when deciding where to go on vacation!
In 2024, the National Travel Survey (NTS) found that Canadian residents took 292.1 million domestic trips. The third quarter (94.3 million) accounted for most of these trips, followed by the fourth quarter (71.0 million), second quarter (70.0 million) and first quarter (56.8 million). These trips were for all purposes, but most of them were for holiday, leisure or recreation or to visit friends or relatives.
Let’s take a trip back to 2024 and look at some detailed data for 20 selected tourism regions across the provinces to get a sense of where Canadians go for and what they do on their vacations.
July and August are the most popular months for vacations, with September following close behind
July was the most popular month for vacationing in Halifax Metro, Nova Scotia, and Québec, Quebec. Food, festivals and landmarks are among the endless options available in these urban areas.
Vacationers heading west were more likely to choose July as the month to visit urban destinations in Calgary, Edmonton and their surrounding areas in Alberta. The famous Calgary Stampede is just one of several festivals in July to attract visitors.
In Eastern Canada, August was the most popular travel month for the tourist regions of Avalon, Newfoundland and Labrador, Cape Breton Island, Nova Scotia, and Charlottetown, Stratford and Cornwall, Prince Edward Island. If you’re looking for a beach, trail, great seafood or a whale-watching excursion, you can’t go wrong with these destinations.
Also popular in August were the array of cottage and camping options in Muskoka, Parry Sound and Algonquin Park, Ontario, as well as exploring the breathtaking Canadian Rockies in Alberta.
September was the most popular month for visits to the Greater Toronto Area and Niagara Falls and Wine Country in Ontario, Cantons de l’Est (Eastern Townships), Quebec (Louise Penny readers, we’re looking at you!), and perhaps a scenic ferry ride to Vancouver Island, British Columbia.
Holiday, leisure or recreation the most cited trip purpose in warmer months; visits to see friends or relatives were more spread out through the year
Although catching up outdoors is nice in mild weather, colder weather is often a less important factor in planning visits to see friends or relatives. For example, November was the most popular month for these types of visits to Saskatoon, Saskatchewan, while the month of March was the most popular for Ottawa and Countryside, Ontario.
December—when holiday gatherings are abundant—was the top month for visits to see friends or relatives in Montréal, Quebec, and Vancouver, Coast and Mountains, British Columbia.
However, the bulk of overall tourism-related visits to these regions happened in the warmer months, which indicates that most of us still go on vacation during those months to see what they all have to offer!
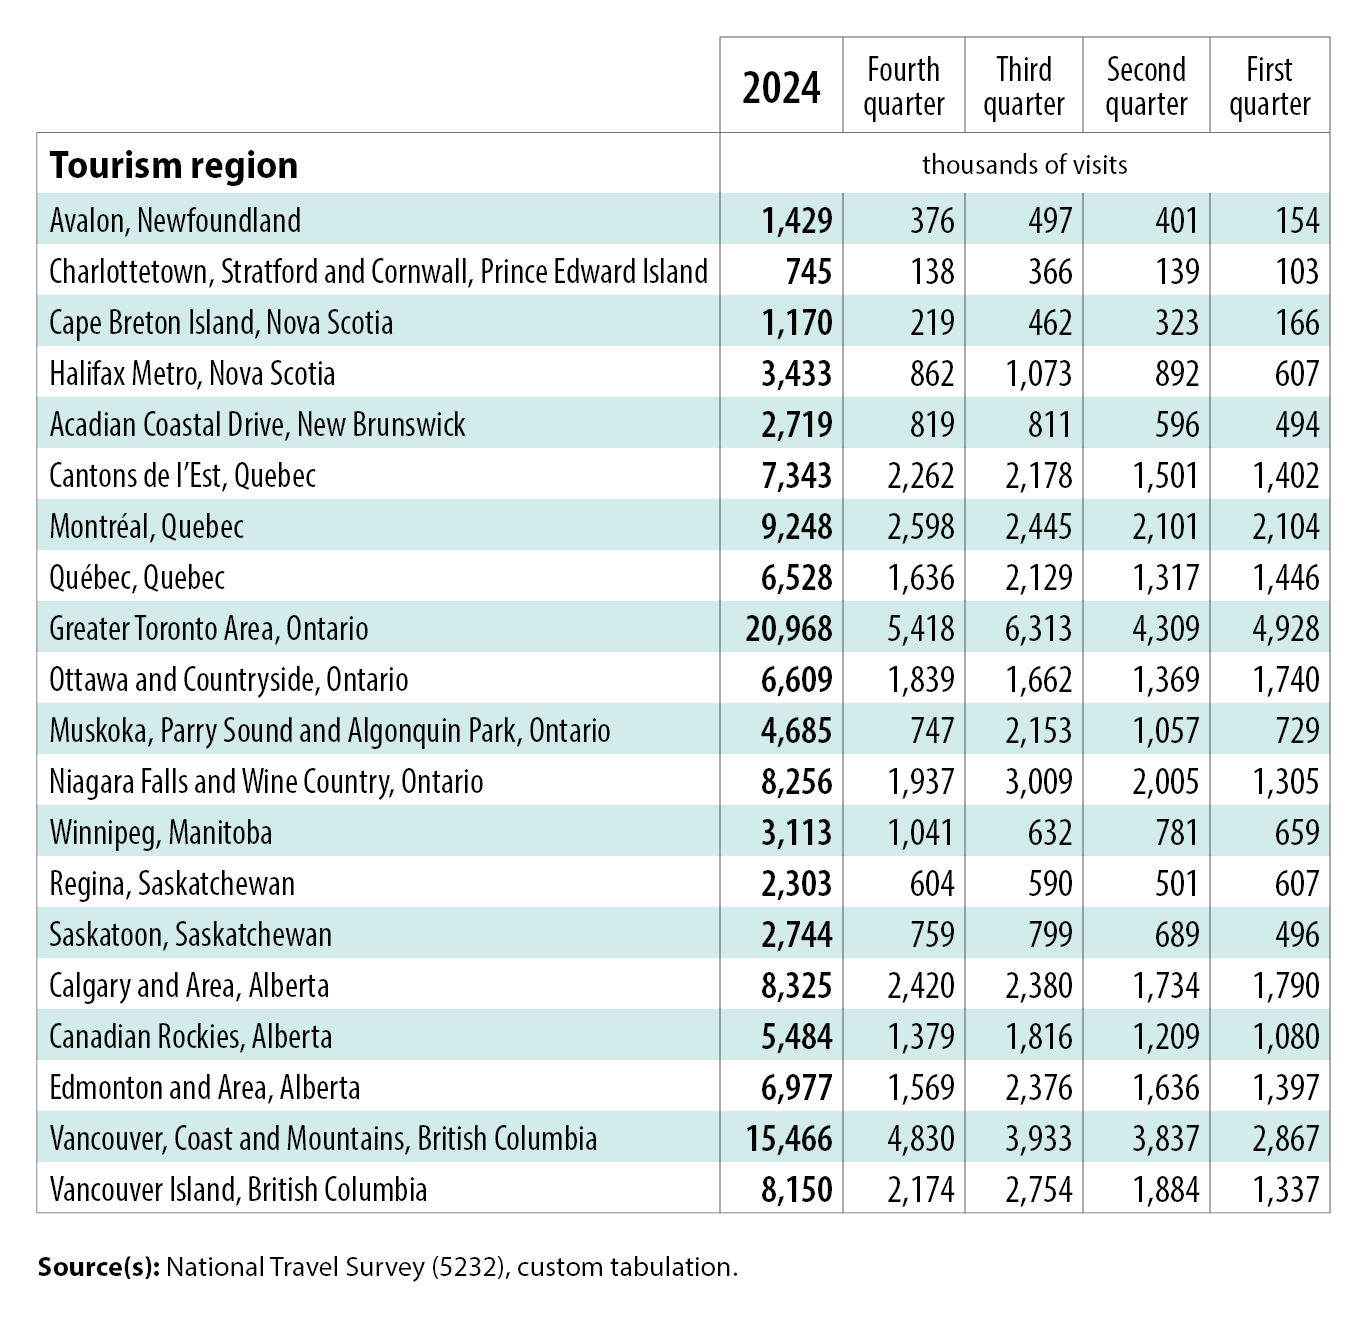
Table 1: Trips taken by Canadian residents within Canada, 2024
Description - Table 1: Domestic trips within Canada, 2024
The title of this table is "Table 1: Trips taken by Canadian residents within Canada, 2024."
The table lists 20 tourism regions, along with the number of visits in thousands in 2024 and in each quarter of 2024.
In the tourism region Avalon, Newfoundland, there were 1,429,000 visits in 2024, 376,000 visits in the fourth quarter of 2024, 497,000 visits in the third quarter of 2024, 401,000 visits in the second quarter of 2024 and 154,000 visits in the first quarter of 2024.
In the tourism region Charlottetown, Stratford and Cornwall, Prince Edward Island, there were 745,000 visits in 2024, 138,000 visits in the fourth quarter of 2024, 366,000 visits in the third quarter of 2024, 139,000 visits in the second quarter of 2024 and 103,000 visits in the first quarter of 2024.
In the tourism region Cape Breton Island, Nova Scotia, there were 1,170,000 visits in 2024, 219,000 visits in the fourth quarter of 2024, 462,000 visits in the third quarter of 2024, 323,000 visits in the second quarter of 2024 and 166,000 visits in the first quarter of 2024.
In the tourism region Halifax Metro, Nova Scotia, there were 3,433,000 visits in 2024, 862,000 visits in the fourth quarter of 2024, 1,073,000 visits in the third quarter of 2024, 892,000 visits in the second quarter of 2024 and 607,000 visits in the first quarter of 2024.
In the tourism region Acadian Coastal Drive, New Brunswick, there were 2,719,000 visits in 2024, 819,000 visits in the fourth quarter of 2024, 811,000 visits in the third quarter of 2024, 596,000 visits in the second quarter of 2024 and 494,000 visits in the first quarter of 2024.
In the tourism region Cantons de l’Est, Quebec, there were 7,343,000 visits in 2024, 2,262,000 visits in the fourth quarter of 2024, 2,178,000 visits in the third quarter of 2024, 1,501,000 visits in the second quarter of 2024 and 1,402,000 visits in the first quarter of 2024.
In the tourism region Montréal, Quebec, there were 9,248,000 visits in 2024, 2,598,000 visits in the fourth quarter of 2024, 2,445,000 visits in the third quarter of 2024, 2,101,000 visits in the second quarter of 2024 and 2,104,000 visits in the first quarter of 2024.
In the tourism region Québec, Quebec, there were 6,528,000 visits in 2024, 1,636,000 visits in the fourth quarter of 2024, 2,129,000 visits in the third quarter of 2024, 1,317,000 visits in the second quarter of 2024 and 1,446,000 visits in the first quarter of 2024.
In the tourism region Greater Toronto Area, Ontario, there were 20,698,000 visits in 2024, 5,418,000 visits in the fourth quarter of 2024, 6,313,000 visits in the third quarter of 2024, 4,309,000 visits in the second quarter of 2024 and 4,928,000 visits in the first quarter of 2024.
In the tourism region Ottawa and Countryside, Ontario, there were 6,609,000 visits in 2024, 1,839,000 visits in the fourth quarter of 2024, 1,662,000 visits in the third quarter of 2024, 1,369,000 visits in the second quarter of 2024 and 1,740,000 visits in the first quarter of 2024.
In the tourism region Muskoka, Parry Sound and Algonquin Park, Ontario, there were 4,685,000 visits in 2024, 747,000 visits in the fourth quarter of 2024, 2,153,000 visits in the third quarter of 2024, 1,057,000 visits in the second quarter of 2024 and 729,000 visits in the first quarter of 2024.
In the tourism region Niagara Falls and Wine Country, Ontario, there were 8,256,000 visits in 2024, 1,937,000 visits in the fourth quarter of 2024, 3,009,000 visits in the third quarter of 2024, 2,005,000 visits in the second quarter of 2024 and 1,305,000 visits in the first quarter of 2024.
In the tourism region Winnipeg, Manitoba, there were 3,113,000 visits in 2024, 1,041,000 visits in the fourth quarter of 2024, 632,000 visits in the third quarter of 2024, 781,000 visits in the second quarter of 2024 and 659,000 visits in the first quarter of 2024.
In the tourism region Regina, Saskatchewan, there were 2,303,000 visits in 2024, 604,000 visits in the fourth quarter of 2024, 590,000 visits in the third quarter of 2024, 501,000 visits in the second quarter of 2024 and 607,000 visits in the first quarter of 2024.
In the tourism region Saskatoon, Saskatchewan, there were 2,744,000 visits in 2024, 759,000 visits in the fourth quarter of 2024, 799,000 visits in the third quarter of 2024, 689,000 visits in the second quarter of 2024 and 496,000 visits in the first quarter of 2024.
In the tourism region Calgary and Area, Alberta, there were 8,325,000 visits in 2024, 2,420,000 visits in the fourth quarter of 2024, 2,380,000 visits in the third quarter of 2024, 1,734,000 visits in the second quarter of 2024 and 1,790,000 visits in the first quarter of 2024.
In the tourism region Canadian Rockies, Alberta, there were 5,484,000 visits in 2024, 1,379,000 visits in the fourth quarter of 2024, 1,816,000 visits in the third quarter of 2024, 1,209,000 visits in the second quarter of 2024 and 1,080,000 visits in the first quarter of 2024.
In the tourism region Edmonton and Area, Alberta, there were 6,977,000 visits in 2024, 1,569,000 visits in the fourth quarter of 2024, 2,376,000 visits in the third quarter of 2024, 1,636,000 visits in the second quarter of 2024 and 1,397,000 visits in the first quarter of 2024.
In the tourism region Vancouver, Coast and Mountains, British Columbia, there were 15,466,000 visits in 2024, 4,830,000 visits in the fourth quarter of 2024, 3,933,000 visits in the third quarter of 2024, 3,837,000 visits in the second quarter of 2024 and 2,867,000 visits in the first quarter of 2024.
In the tourism region Vancouver Island, British Columbia, there were 8,150,000 visits in 2024, 2,174,000 visits in the fourth quarter of 2024, 2,754,000 visits in the third quarter of 2024, 1,884,000 visits in the second quarter of 2024 and 1,337,000 visits in the first quarter of 2024.
Source(s): National Travel Survey (5232), custom tabulation.
Looking ahead
The NTS will release its latest data (first quarter of 2025) on August 25, 2025, in The Daily. Select annual tables on traveller characteristics and expenditures, by province, tourism region, economic region and census metropolitan area, are available upon request.
Stay tuned for more StatsCAN Plus articles in September on tourism in the western, central and eastern parts of the country using detailed 2024 NTS data.
📲 Looking for more? Staying informed has never been easier!
Follow the "Travel and tourism" subject in the StatsCAN app to receive personalized updates and stay connected with the most recent articles, reports and analyses.
Contact information
For more information, contact the Statistical Information Service (toll-free 1-800-263-1136; 514-283-8300; infostats@statcan.gc.ca) or Media Relations (statcan.mediahotline-ligneinfomedias.statcan@statcan.gc.ca).