


(Note: This article is the second in a two-part series on changing household food expenditures.)
Last week, we discussed in further detail four of the eight main categories of food purchased from stores and how these expenditures changed from 2021 to 2023, as tracked by the Survey of Household Spending. In this article, let’s have a look at the remaining four categories.
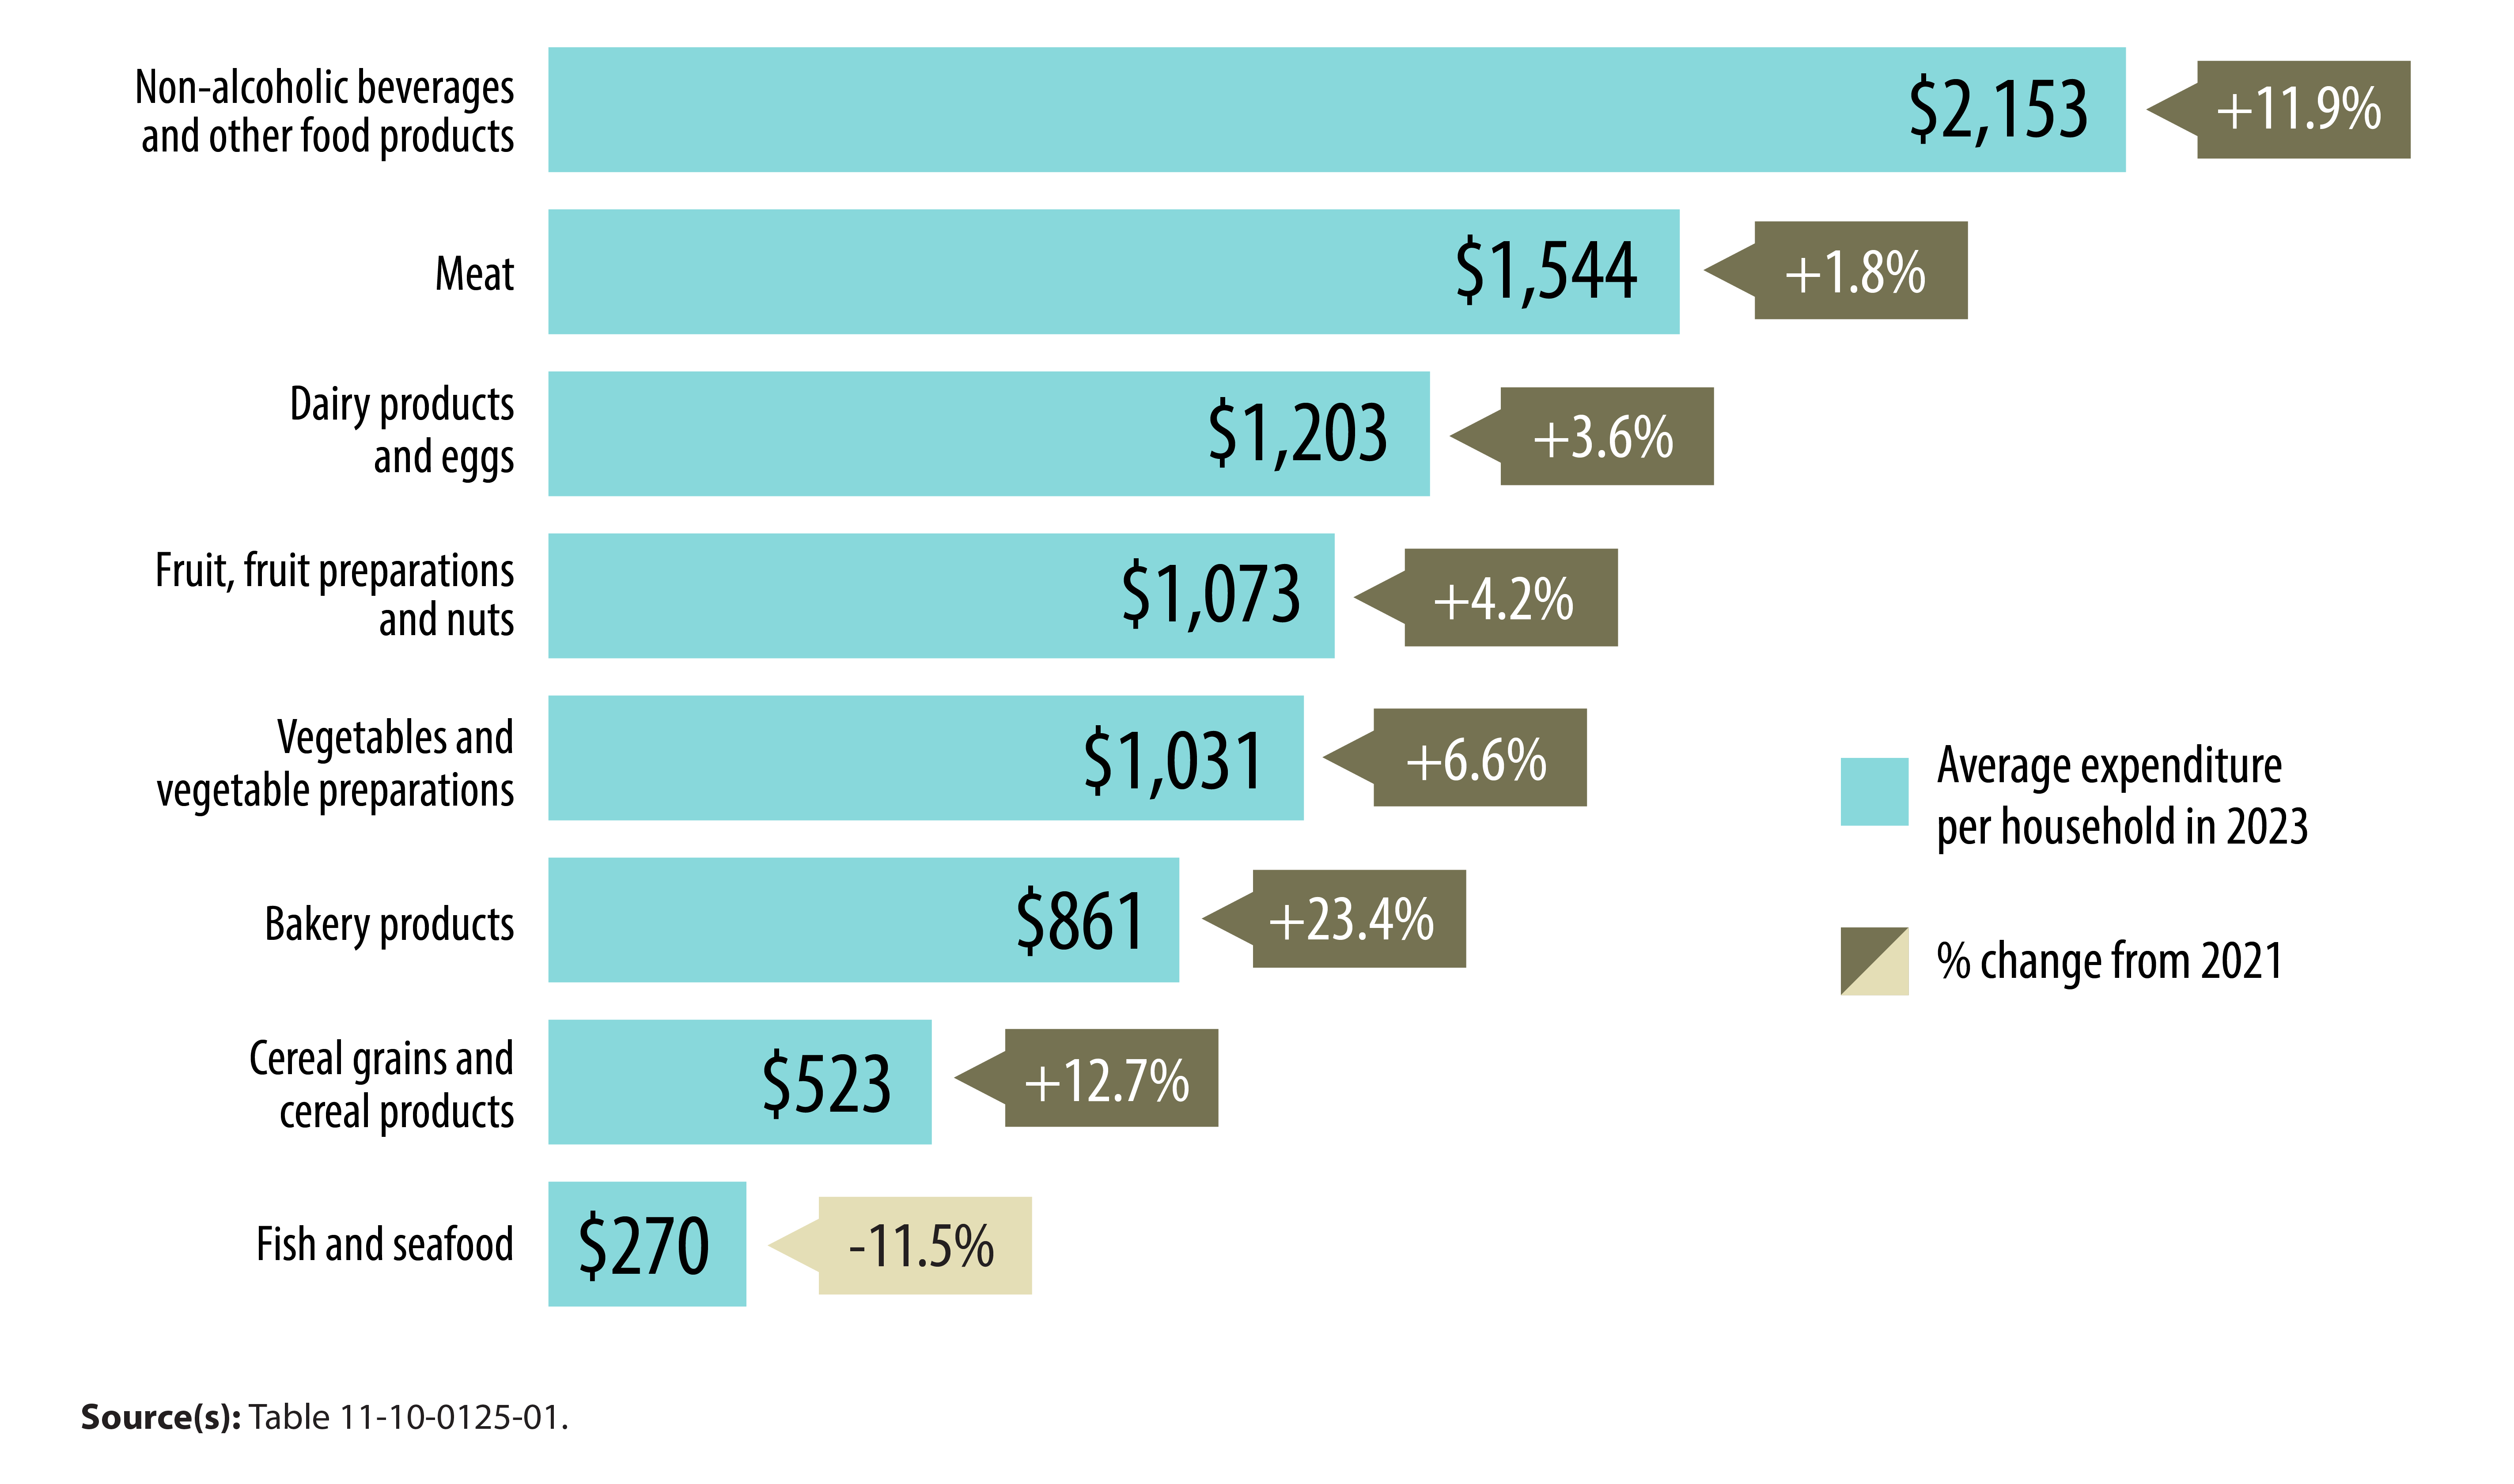
Chart 1: Food purchased from stores, 2023 (% change from 2021)
Description - Chart 1: Food purchased from stores, 2023 (% change from 2021)
The title of this infographic is “Food purchased from stores, 2023 (% change from 2021).”
The infographic lists eight categories of food purchased from stores, along with the average household expenditure per category in 2023 and the percentage change since 2021.
For non-alcoholic beverages and other food products, the average expenditure per household in 2023 was $2,153 and the percentage change since 2021 was +11.9%.
For meat, the average expenditure per household in 2023 was $1,544 and the percentage change since 2021 was +1.8%.
For dairy products and eggs, the average expenditure per household in 2023 was $1,203 and the percentage change since 2021 was +3.6%.
For fruit, fruit preparations and nuts, the average expenditure per household in 2023 was $1,073 and the percentage change since 2021 was +4.2%.
For vegetables and vegetable preparations, the average expenditure per household in 2023 was $1,031 and the percentage change since 2021 was +6.6%.
For bakery products, the average expenditure per household in 2023 was $861 and the percentage change since 2021 was +23.4%.
For cereal grains and cereal products, the average expenditure per household in 2023 was $523 and the percentage change since 2021 was +12.7%.
For fish and seafood, the average expenditure per household in 2023 was $270 and the percentage change since 2021 was -11.5%.
Source(s): Table 11-10-0125-01.
Spending up on most vegetables and more evenly distributed than in other categories
In 2023, the average expenditure of $779 (+3.0% from 2021) on fresh vegetables mirrored what was spent on fresh fruit and was the main contributor to the $1,031 spent on vegetables and vegetable preparations.
Spending on tomatoes ($93; +2.2%) topped all others, followed by spending on onions ($76; +10.1%), peppers ($68; -2.9%), lettuce ($60; +13.2) and potatoes ($57; +7.5%). Spending on various types of other vegetables was unchanged, at $212.
Households spent more on canned vegetables and other vegetable preparations ($155; +14.8%) and frozen and dried vegetables ($97; +27.6%), an indication of the ongoing need for meals in a pinch.
Households also felt a pinch in the wallet in 2023, paying higher prices for fresh vegetables (+17.1%) and preserved vegetables and vegetable preparations (+22.4%) than they did in 2021.
Pricier pastry, bread drive an increase in spending on bakery products
Canadian households spent an average of $861 on bakery products in 2023 (+23.4% from 2021)—mainly attributable to ready-to-eat pastry (except frozen) ($236, +49.4%) and bread ($224, +31.0%)—giving this category the highest spending increase among them all.
Consumer prices for bakery products increased at the same rate as household spending (+23.4%) from 2021 to 2023. In addition to global supply chain issues, growing conditions in western Canada in 2021 contributed to lower production for wheat and other major field crops. By December 31, 2022, stocks on Canadian farms were up due to higher production that year.
A staple in most diets, bread remained among the highest expenditures on a single product or product type in 2023, despite the sticker shock.
Spending on unsweetened rolls and buns ($116; -7.9%) decreased, as did spending on a variety of frozen bakery products such as pies.
More spending on rice, pasta, breakfast cereal, cookies, crackers
Households spent an average of $523 on cereal grains and other cereal products in 2023, up 12.7% from 2021.
Higher expenditures in 2023 included pasta products ($95; +37.7%) and rice and rice mixes ($92; +21.0%). Spending on breakfast cereal and other grain products (except infant) increased to $298, though at a much slower pace (+5.3%).
Prices for pasta products, which faced similar upward price pressures as bread and other grain products, rose by 35.3% from 2021 to 2023.
Seafood spending dips underwater
At $270 in 2023, average fish and seafood expenditures were down 11.5% from 2021 and continued to make up the smallest share of the average food purchased from stores.
Salmon ($43; -27.1%) drove the decline in the fish and seafood category. Already an expensive protein option compared with chicken or pork, the average per-kilogram price of salmon ran as high as $29.10 in March 2023.
Expenditures on canned salmon and tuna were also down in 2023, as well as for seafood and marine products such as shellfish.
Overall, Canadians paid higher prices for fish (+14.6%) and seafood and other marine products (+4.9%) in 2023 than they did in 2021.
Food Day Canada
Whatever you might be picking up at the grocery store, there’s a special day for Canadian foodies to celebrate next month.
August 3 is Food Day Canada, which engages and inspires everyone to shop, cook and dine Canadian. The day was originally created as the “World’s Longest Barbecue” by longtime Canadian food advocate Anita Stewart, her family and a number of pioneering supporters to show support for Canada’s beef ranchers and farmers.
Stewart, who passed away in 2020, became a member of the Order of Canada in 2012. In 2023, Parliament officially recognized Food Day Canada in its 20th year.

Note to readers
Average expenditures presented by the Survey of Household Spending (SHS) are based on data collected from Canadian households in the 10 provinces and three territorial capitals. Canada-level statistics include the 10 provinces only.
Some changes in average expenditures between reference years may not be statistically significant. For more information on the SHS, visit the survey information page.
📲 Looking for more? Staying informed has never been easier!
Follow the “Income, pensions, spending and wealth” subject in the StatsCAN app to receive personalized updates and stay connected with the most recent articles, reports and analyses.
Contact information
For more information, contact the Statistical Information Service (toll-free 1-800-263-1136; 514-283-8300; infostats@statcan.gc.ca) or Media Relations (statcan.mediahotline-ligneinfomedias.statcan@statcan.gc.ca).