


Rural living often brings to mind images of rustic single-family homes in a quaint village, isolated farmhouses, mobile homes or cottages by a quiet lake. Life outside the hustle and bustle of modern-day urban centres has its advantages, not the least of which is lower house prices. Indeed, the farther you get from a major city, the lower housing costs generally are.
Here, rural means anywhere outside of a census metropolitan area or census agglomeration, and urban means areas inside them, based on Statistics Canada’s Standard Geographical Classification.
Over half of the private occupied dwellings in rural Canada were built prior to 1981
In 2021, approximately one in six occupied private dwellings (16.6%), or 2.5 million homes, were located in rural Canada. Of these occupied private dwellings, two-thirds (66.3%) were larger homes with at least three or four bedrooms. Regardless of dwelling size, owner-estimated home values in rural areas ($355,600) were significantly lower than those in urban areas ($677,000).
Over half (54.2%) of the private occupied dwellings in rural Canada were built in 1980 or earlier. From 2016 to 2021, 120,630 new dwellings were built in rural areas, compared with 908,590 having been built in urban areas over the same period.
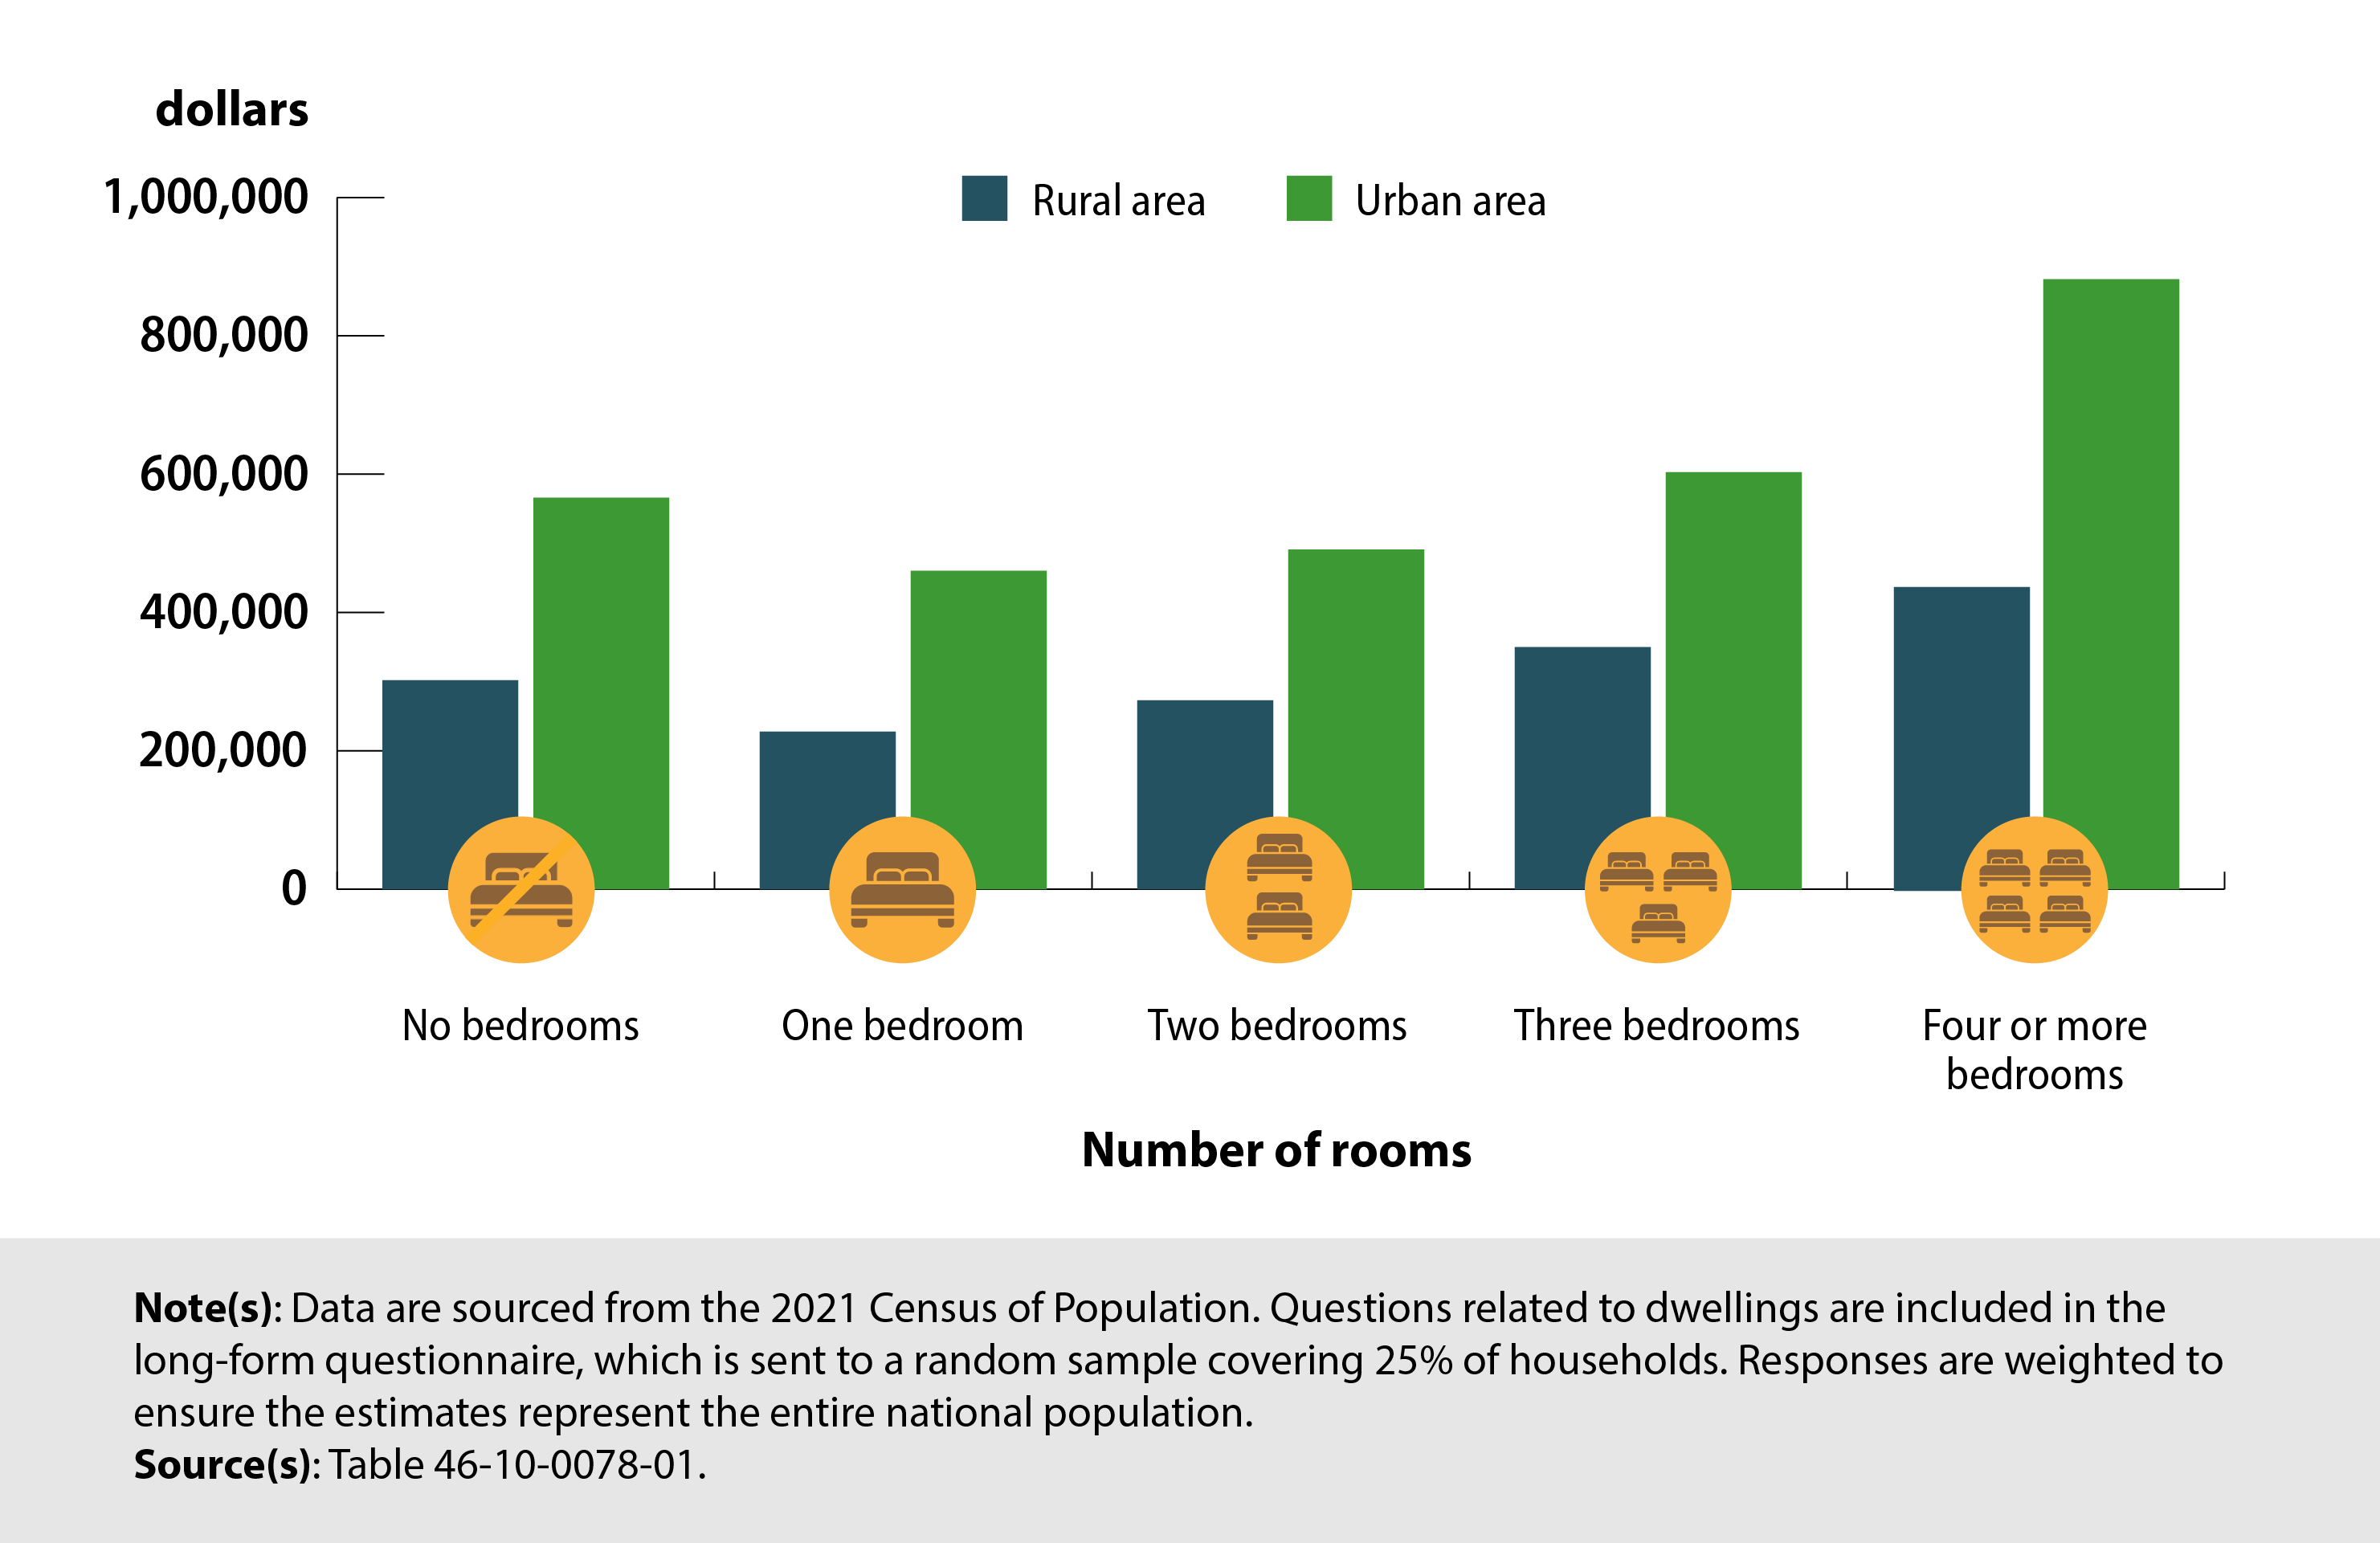
Chart 1: Average owner-estimated value of their home by number of bedrooms, Canada, rural area and urban area, 2021
Description - Chart 1: Average owner-estimated value of their home by number of bedrooms, Canada, rural area and urban area, 2021
Chart 1:
The title of this chart is “Average owner-estimated value of their home by number of bedrooms, Canada, rural area and urban area, 2021.”
This is a grouped bar chart. There are two bars in each group: the first bar represents the average owner estimate of the value of their home in rural areas, and the second bar represents the average owner estimate of the value of their home in urban areas.
The horizontal axis represents the number of bedrooms. There are four groups: no bedrooms, one bedroom, two bedrooms, three bedrooms and four or more bedrooms.
The vertical axis represents the average owner-estimated value of their home in dollars.
The vertical axis starts at $0 and goes to $1,000,000, by increments of $200,000.
For no bedrooms, the rural area estimated value is $302,000, and the urban area estimated value is $566,000.
For one bedroom, the rural area estimated value is $227,800, and the urban area estimated value is $460,400.
For two bedrooms, the rural area estimated value is $273,200, and the urban area estimated value is $491,200.
For three bedrooms, the rural area estimated value is $350,000, and the urban area estimated value is $603,000.
For four or more bedrooms, the rural area estimated value is $439,200, and the urban area estimated value is $882,000.
Note(s): Data are sourced from the 2021 Census of Population. Questions related to dwellings are included in the long-form questionnaire, which is sent to a random sample covering 25% of households. Responses are weighted to ensure the estimates represent the entire national population.
Source(s): Table 46-10-0078-01.
Canadians living in rural areas are more likely to be homeowners than urban dwellers
In 2021, just over three-quarters (77.1%) of Canadians living in rural areas owned their home, compared with just under two-thirds (64.3%) of those living in urban areas. Renting was higher in urban areas, where more than one-third (35.6%) of residents rented their home, compared with about one-fifth (20.5%) in rural areas. Housing provided by a local government, First Nation or Indian band was more common in rural areas (2.4%) than in urban ones (0.1%).
Over 9 in 10 Canadians deemed their housing “suitable” in 2021. However, Canadians living in an urban area were more likely to deem their housing unsuitable (5.8%) than those living in a rural area (3.2%).
Residential investment in single-family housing tops all other building types combined in rural Canada
In 2023, new construction of single-family homes in rural Canada attracted the most investment, totalling just over $7.6 billion, about twice as much as all other building types combined. Investment in multi-apartments was next, reaching nearly $2.3 billion. From 2022 to 2023, investment in multi-apartments jumped 61.2% in rural areas, while investment in single-family homes grew by 22.5%.
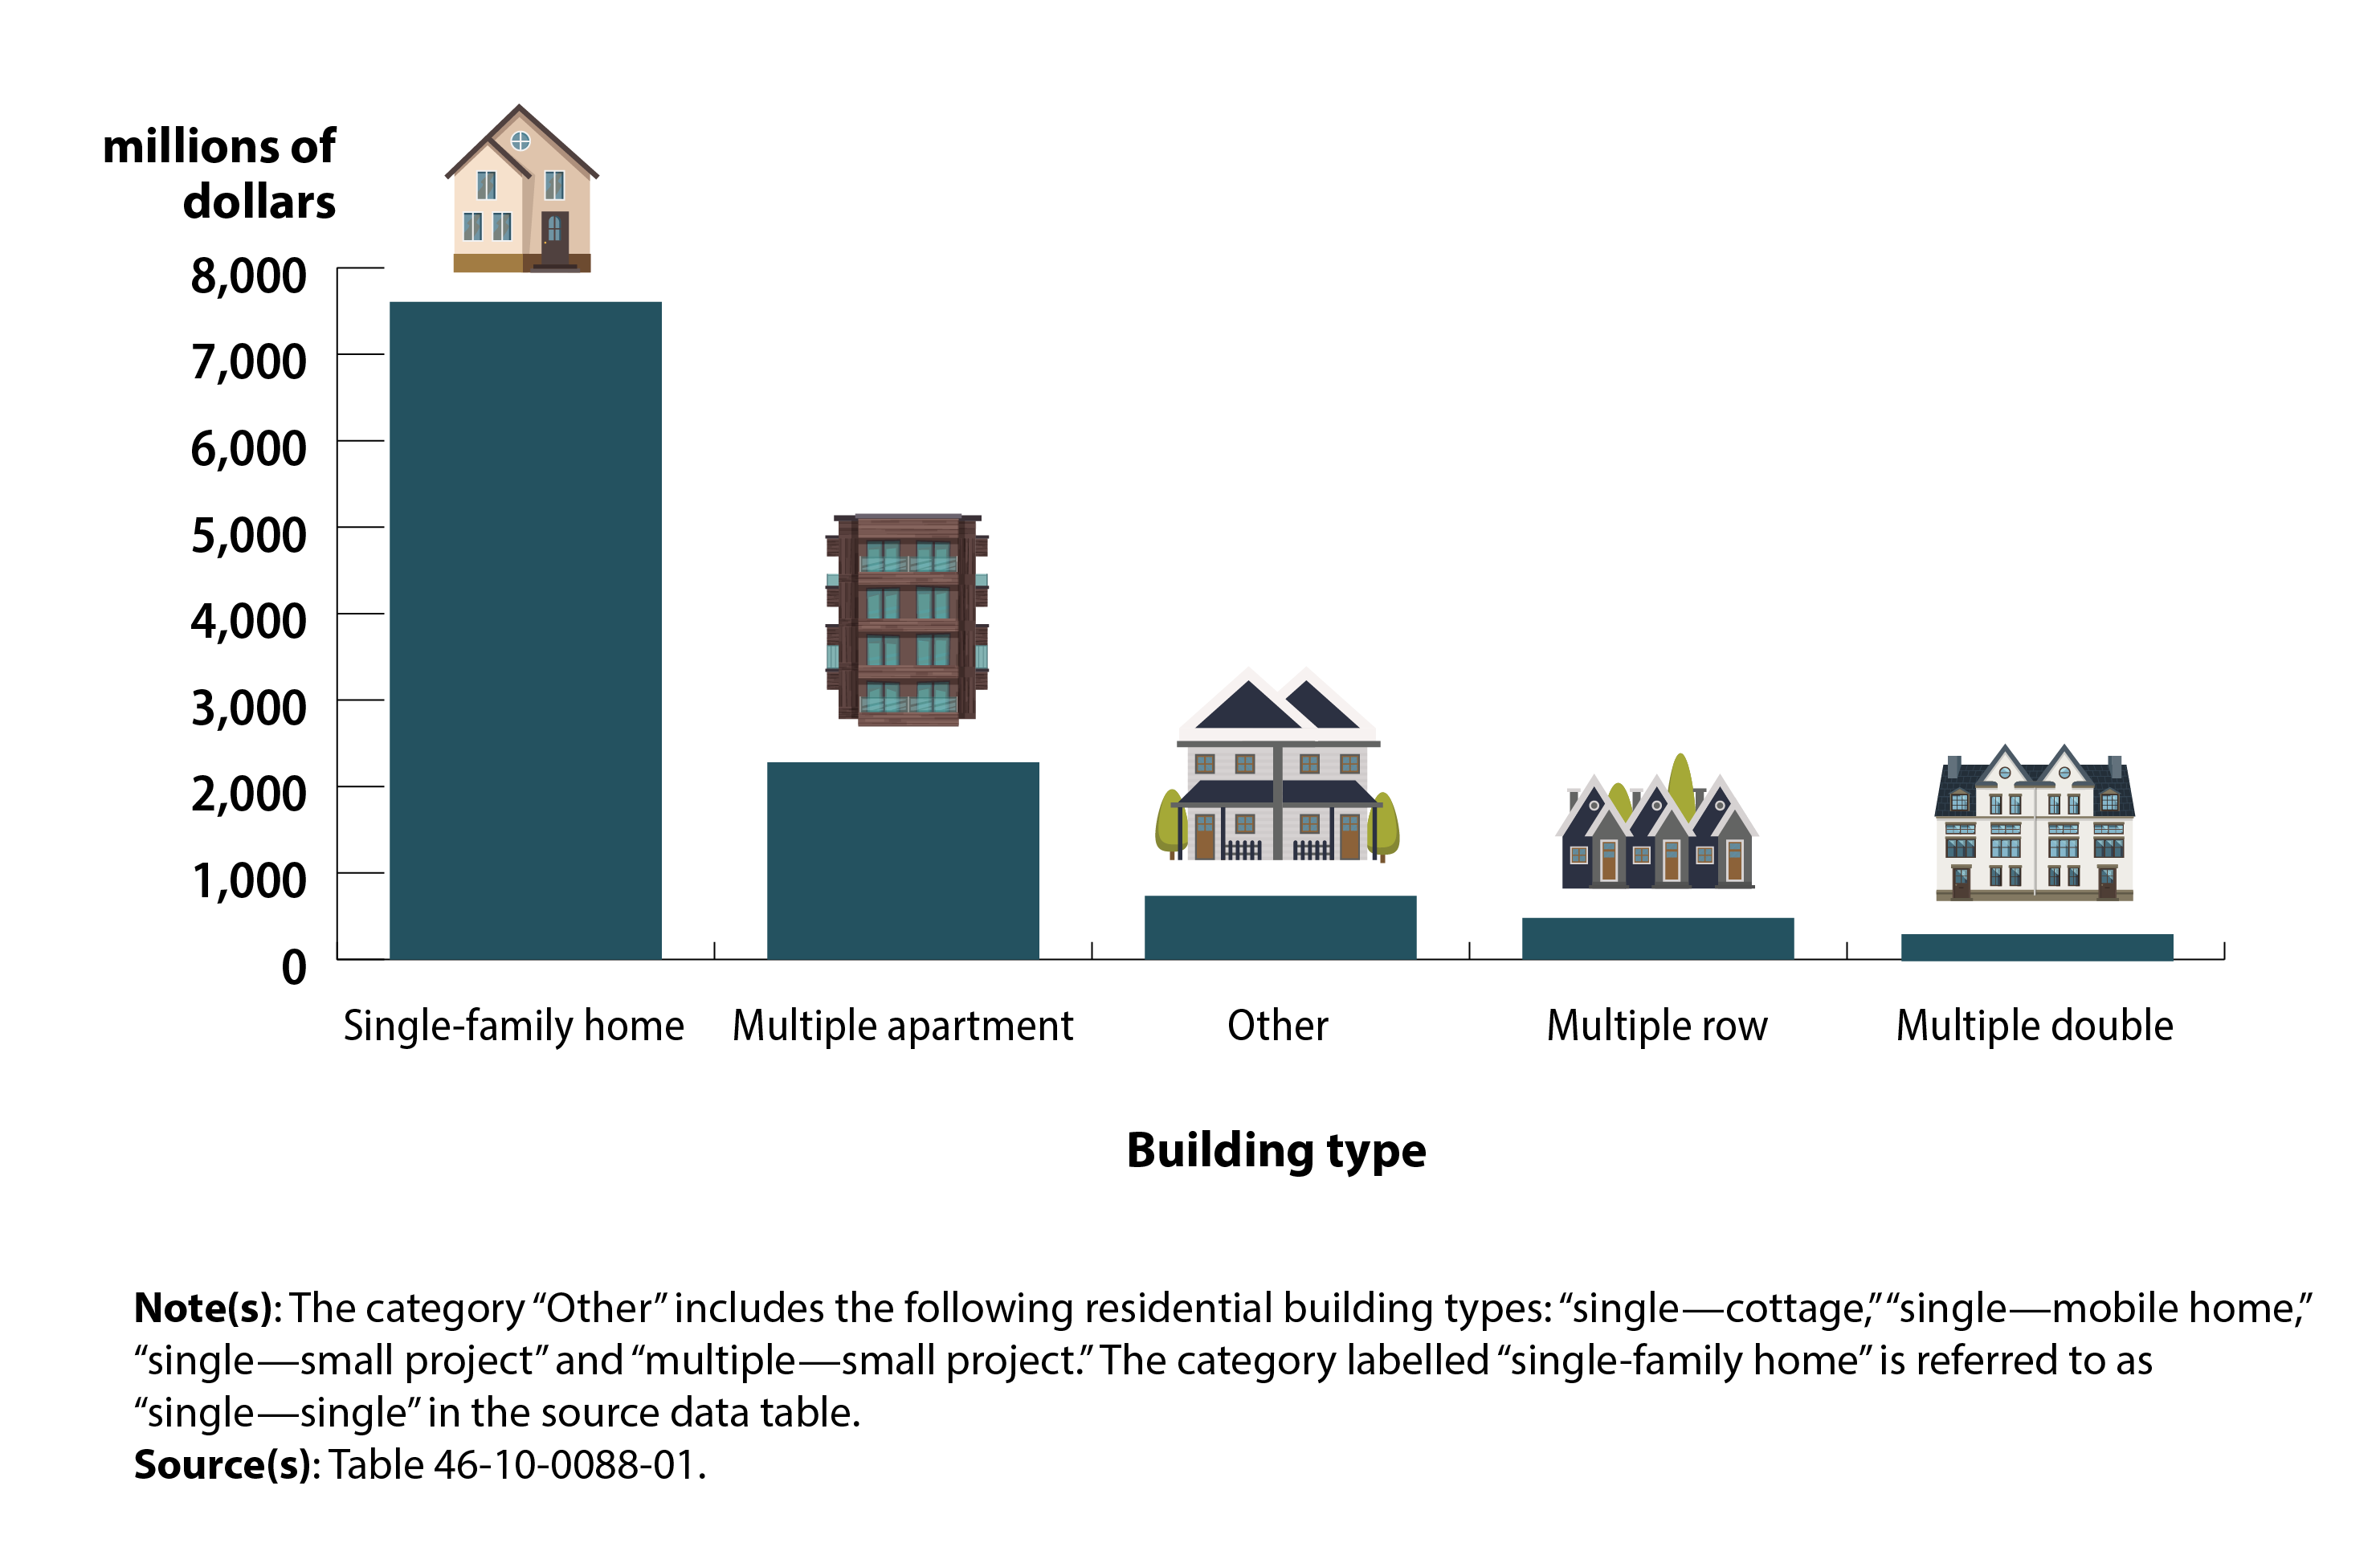
Chart 2: Investment in new construction by building type in rural Canada, 2023
Description - Chart 2: Investment in new construction by building type in rural Canada, 2023
Chart 2:
The title of this chart is “Investment in new construction by building type in rural Canada, 2023.”
This is a vertical bar chart.
The vertical axis represents the millions of dollars of investment in new construction.
The horizontal axis represents the building types in rural Canada. The five categories are single-family home, multiple apartment, other, multiple row and multiple double.
For single-family home build types, there were $7,605.9 million of investment in new construction.
For multiple apartment build types, there were $2,279.5 million of investment in new construction.
For other build types, there were $736.0 million of investment in new construction.
For multiple row build types, there were $480.4 million of investment in new construction.
For multiple double build types, there were $310.4 million of investment in new construction.
Note(s): The category “Other” includes the following residential building types: “single—cottage,” “single—mobile home,” “single—small project” and “multiple—small project.” The category labelled “single-family home” is referred to as “single—single” in the source data table.
Source(s): Table 46-10-0088-01.
Cottage renovations see COVID-19 pandemic-related boom in rural Canada
The second summer of the COVID-19 pandemic saw a boom in rural cottage renovations or alternations, with investment almost doubling from $624.5 million in 2019 to a record high of $1.2 billion in 2021. Investments in rural single-family homes (+70.2%) and multi-apartments (+27.8%) renovations and alterations also increased over the same period.
Looking for statistics about rural Canada?
Statistics Canada’s Rural Data Lab brings together data, tools and analyses that showcase Canada’s vibrant rural and small-town communities and regions. A new video introduces the Rural Data Lab and its central hub, the Rural Canada statistics portal, a one-stop access point for rural-related data resources. The portal offers interactive tools, visualizations, and analyses designed to provide insights on key topics such as population, housing, access to services and more.
Check out the infographic "Rural and small-town Canada", which gives a snapshot of population, housing, business and access to services in rural and small-town Canada.
Note to readers
The Rural Canada Housing Profiles and interactive dashboard define rural and small-town areas as communities outside census metropolitan areas or census agglomerations, based on Statistics Canada’s Standard Geographical Classification. Communities located within census metropolitan areas or census agglomerations are classified as part of functional urban areas. To learn more, see Standard Geographical Classification (SGC) 2021 - Volume I, The Classification.
For data sourced from the 2021 Census of Population, questions related to dwellings are included in the long-form questionnaire, which is sent to a random sample covering 25% of households. Responses are weighted to ensure that the estimates accurately represent the entire national population.
📲 Looking for more? Staying informed has never been easier!
Follow the “Housing” subject in the StatsCAN app to receive personalized updates and stay connected with the most recent articles, reports and analyses.
Contact information
For more information, contact the Statistical Information Service (toll-free 1-800-263-1136; 514-283-8300; infostats@statcan.gc.ca) or Media Relations (statcan.mediahotline-ligneinfomedias.statcan@statcan.gc.ca).