

A decade ago, Canada stood alongside all United Nations member states and adopted the 2030 Agenda for Sustainable Development, a universal call to action to end poverty, protect the planet, and ensure that all people enjoy peace and prosperity.
The 2030 Agenda set forth 17 Sustainable Development Goals (SDGs) with a fundamental commitment to leave no one behind.
An overview of Canada’s progress since 2015
Canada’s progress on achieving the SDGs is tracked through Statistics Canada's updated Global Indicator Framework data hub.
There are 251 indicators that measure progress towards the 169 global targets of the SDGs. By leveraging available data, it is currently possible to classify the progress of 130 of these indicators into five progress levels, ranging from “Deterioration” to “Target achieved.” Chart 1 provides a visual summary of Canada’s progress since 2015, broken down by goal. For each goal, circles of various sizes indicate the number of indicators falling into each progress category. For example, as of 2025, Canada has already achieved the SDG targets for two indicators under goal 2: Zero hunger. However, most food and hunger indicators are not on track to meet their 2030 targets, highlighting challenges in addressing food insecurity, food price volatility and sustainable agriculture.
Overall, close to half (45%) of SDG indicators for which progress can be measured have already been achieved or are on track to be achieved in Canada by 2030. Furthermore, 10% show some progress, but require acceleration to meet their target, and 21% show limited progress. Meanwhile, 24% have deteriorated since 2015.
Chart 1: Canada’s progress towards the Sustainable Development Goals from 2015 to October 21, 2025, by goal
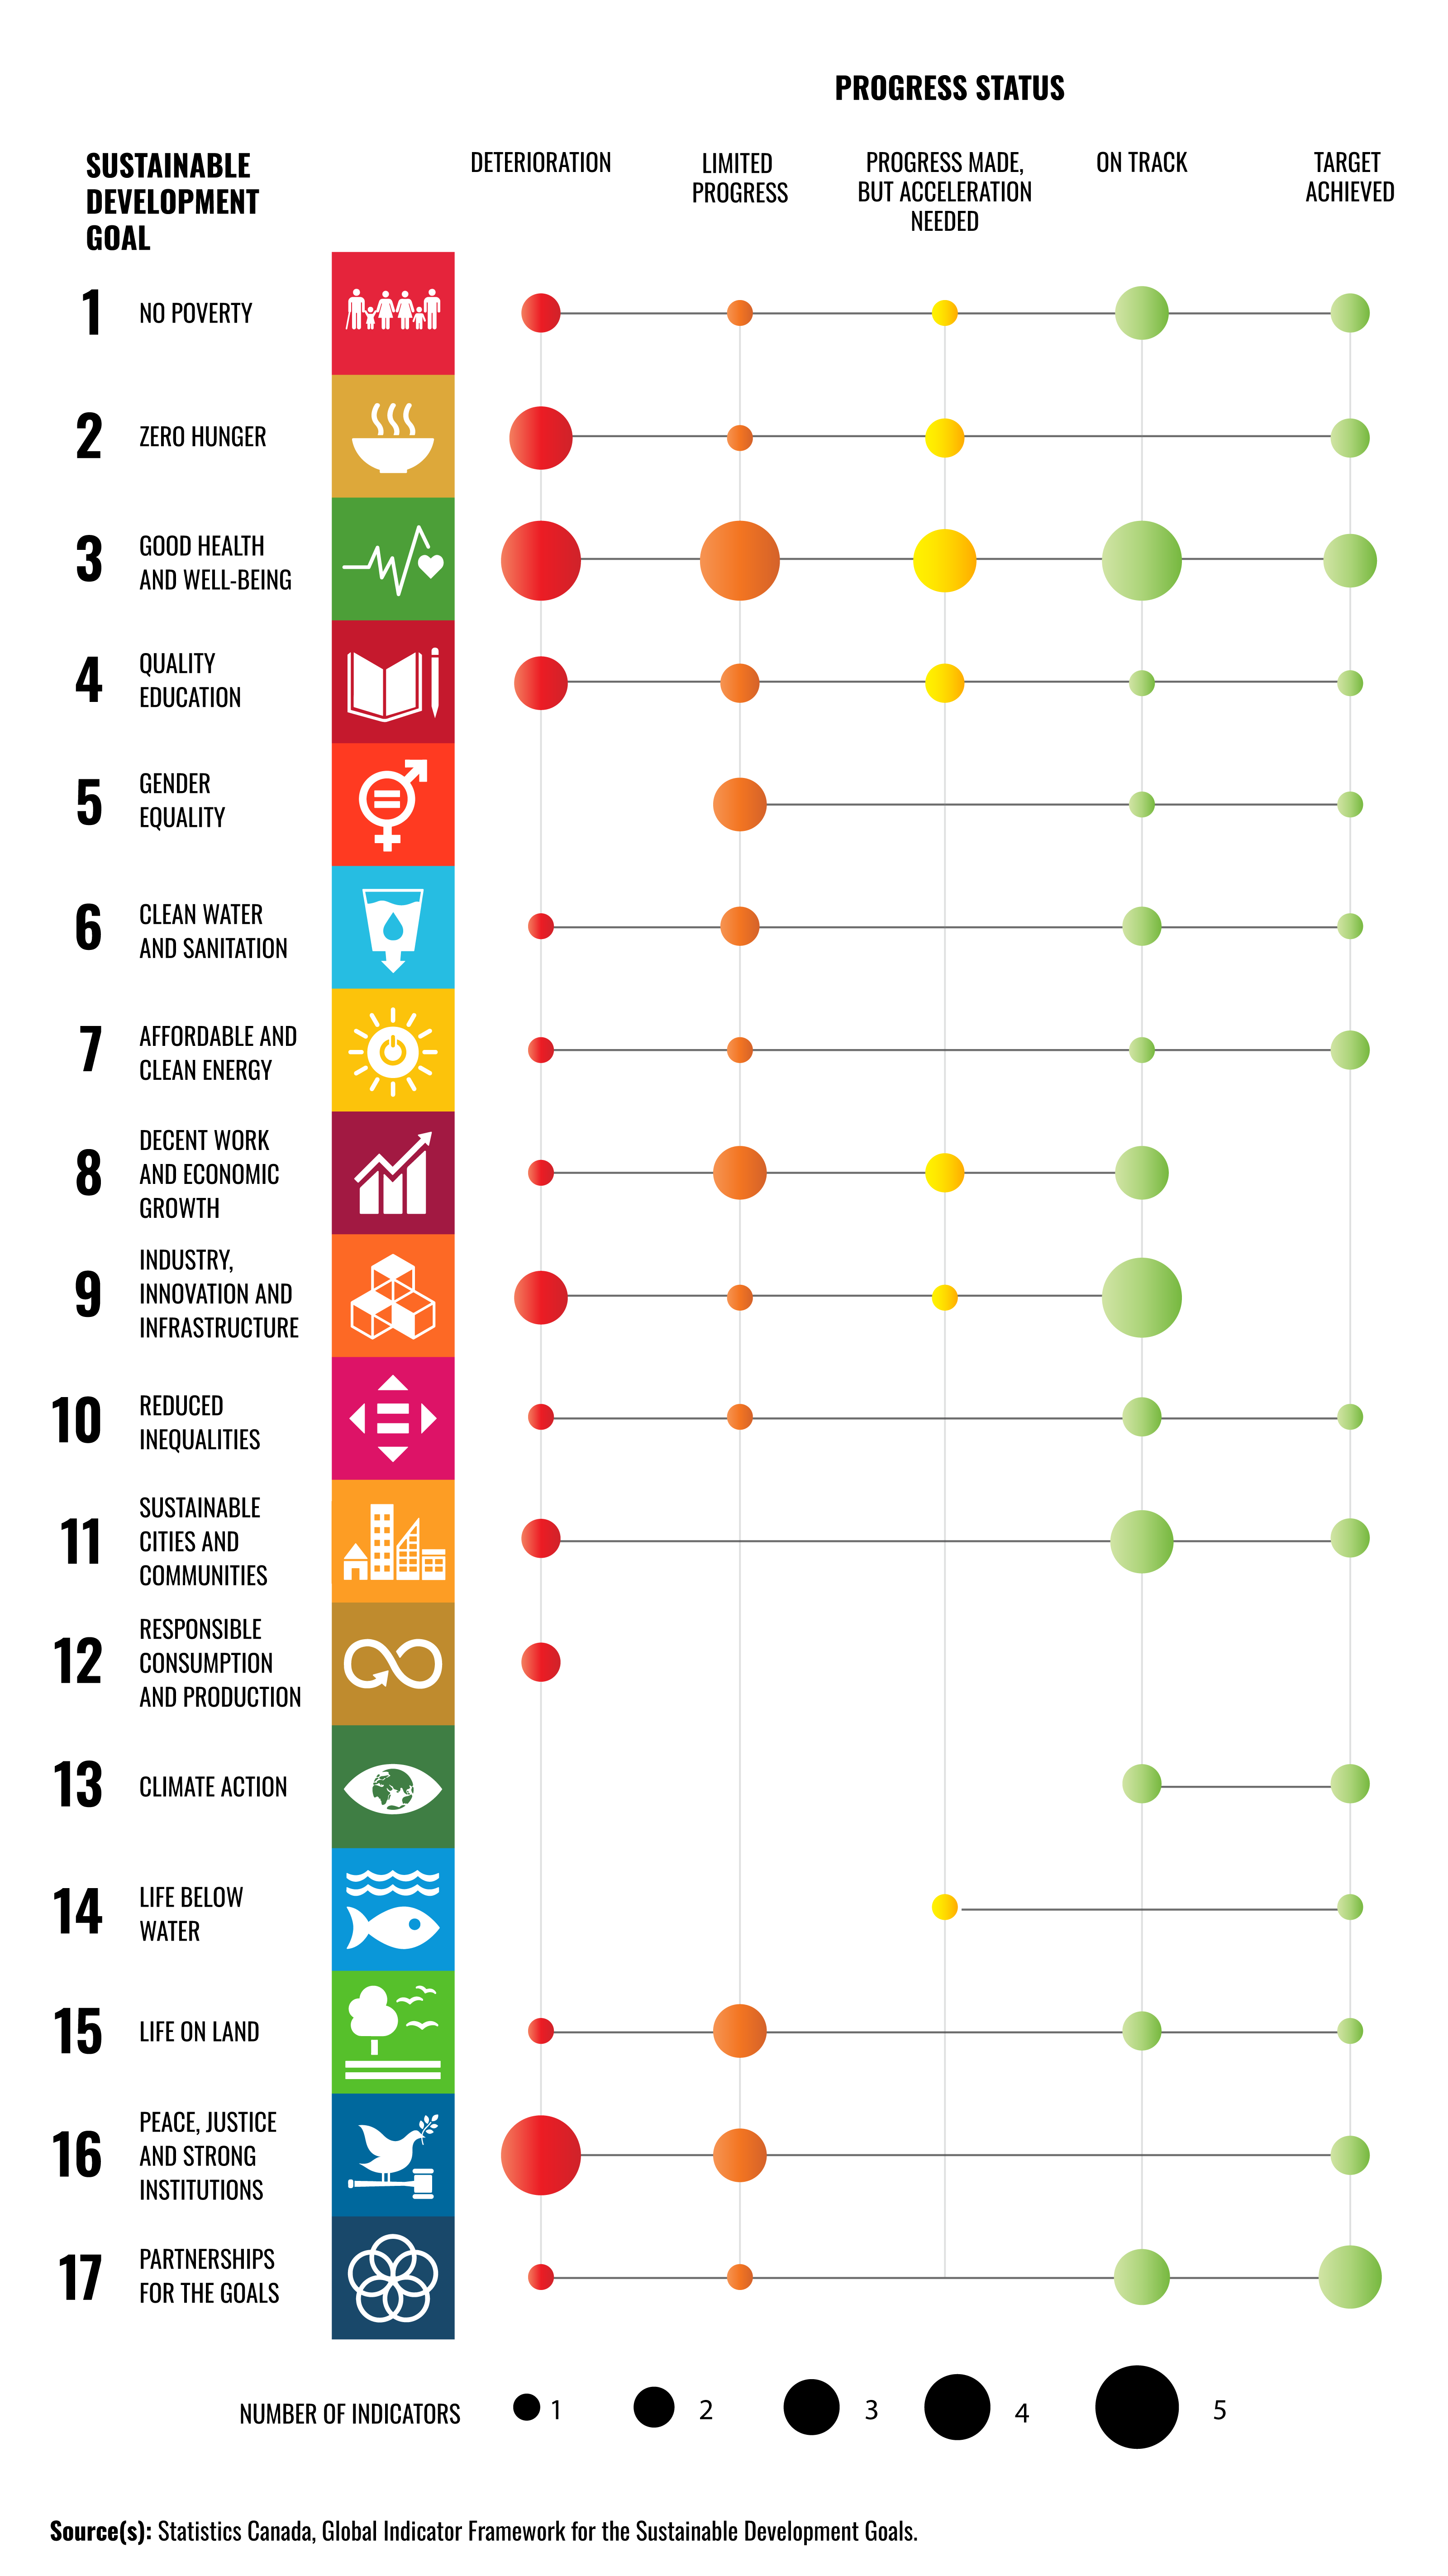
Description - Chart 1: Canada’s progress towards the Sustainable Development Goals from 2015 to October 21, 2025, by goal
This chart has a table depicting the Canada’s progress on the United Nations’ 17 Sustainable Development Goals. They are listed vertically, from top to bottom in numerical order.
Each goal is measured by five levels of progress: Deterioration; Limited progress; Progress made, but acceleration needed; On track; and Target achieved. These are listed horizontally, from left to right.
For each level of progress there has a circle, depicting the number of indicators. The smallest circle represents 1 indicator, and the largest circle represents 5 indicators. Each circle will be described below by its corresponding number of indicators. A zero means there has no indicator.
The first goal is No poverty. Deterioration has 2 indicators; Limited progress has 1; Progress made, but acceleration needed has 1; On Track has 3 and Target achieved has 2.
The second goal is Zero hunger. Deterioration has 4 indicators; Limited progress has 1; Progress made, but acceleration needed has 2; On Track has 0 and Target achieved has 2.
The third goal is Good health and well-being. Deterioration has 5 indicators; Limited progress has 5; Progress made, but acceleration needed has 4; On Track has 5 and Target achieved has 3.
The fourth goal is Quality education. Deterioration has 3 indicators; Limited progress has 2; Progress made, but acceleration needed has 2; On Track has 1 and Target achieved has 1.
The fifth goal has Gender equality. Deterioration has 0 indicators; Limited progress has 3; Progress made, but acceleration needed has 0; On Track has 1 and Target achieved has 1.
The sixth goal is Clean water and sanitation. Deterioration has 1 indicator; Limited progress has 2; Progress made, but acceleration needed has 0; On Track has 2 and Target achieved has 1.
The seventh goal is Affordable and clean energy. Deterioration has 1 indicator; Limited progress has 1; Progress made, but acceleration needed has 0; On Track has 1 and Target achieved has 2.
The eighth goal is Decent work and economic growth. Deterioration has 1 indicator; Limited progress has 3; Progress made, but acceleration needed has 2; On Track has 3 and Target achieved has 0.
The ninth goal is Industry; innovation and infrastructure. Deterioration has 3 indicators; Limited progress has 1; Progress made, but acceleration needed has 1; On Track has 5 and Target achieved has 0.
The 10th goal is Reduced inequalities. Deterioration has 1 indicator; Limited progress has 1; Progress made, but acceleration needed has 0; On track has 2 and Target achieved has 1.
The 11th goal is Sustainable cities and communities. Deterioration has 2 indicators; Limited progress has 0; Progress made, but acceleration needed has 0; On track has 4 and Target achieved has 2.
The 12th goal is Responsible consumption and production. Deterioration has 2 indicators; Limited progress has 0; Progress made, but acceleration needed has 0; On track has 0 and Target achieved has 0.
The 13th goal is Climate action. Deterioration has 0 indicators; Limited progress has 0; Progress made, but acceleration needed has 0; On track has 2 and Target achieved has 2.
The 14th goal is Life below water. Deterioration has 0 indicators; Limited progress has 0; Progress made, but acceleration needed has 1; On track has 0 and Target achieved has 1.
The 15th goal is Life on land. Deterioration has 1 indicator; Limited progress has 3; Progress made, but acceleration needed has 0; On track has 2 and Target achieved has 1.
The 16th goal is Peace; justice and strong institutions. Deterioration has 5 indicators; Limited progress has 3; Progress made, but acceleration needed has 0; On track has 0 and Target achieved has 2.
The 17th goal is Partnerships for the goals. Deterioration has 1 indicator; Limited progress has 1; Progress made, but acceleration needed has 0; On track has 3 and Target achieved has 4.
Source(s): Statistics Canada, Global Indicator Framework for the Sustainable Development Goals.
Let’s take a more detailed look at Canada’s progress through a selection of indicators illustrating diverse stories.
Falling behind on food security
SDG goal 2 aims to end hunger, achieve food security, improve nutrition and promote sustainable agriculture.
In 2023, almost 1 in 5 Canadians (19.1%) living outside the territories faced moderate or severe food insecurity, up from 11.6% in 2018.
Certain groups were disproportionately affected by food insecurity. Notably, persons living in female lone-parent families had the highest rate of moderate or severe food insecurity (43.1%) in 2023. Among demographic groups, the rate was highest for Black Canadians (37.7%). Additionally, approximately 1 in 3 Indigenous persons living off reserve (33.7%) experienced moderate or severe food insecurity.
For more data related to this indicator, visit Indicator 2.1.2 - Prevalence of moderate or severe food insecurity in the population.
Wanted: More women in managerial positions
SDG goal 5 seeks to achieve gender equality and empower all women and girls.
In Canada, women held more than one-third (36.4%) of all managerial positions in 2024, up slightly from 34.8% in 2015.
Among all managerial occupational categories, middle management occupations in trades, transportation, production and utilities had the lowest level of female representation in Canada in 2024 (17.7%), largely unchanged from 2015 (17.3%). Meanwhile, the proportion of women in managerial positions was highest among specialized middle management occupations in 2024, when women accounted for nearly half (48.7%) of managerial roles.
For more data related to this indicator, visit Indicator 5.5.2 - Proportion of women in managerial positions.
Canadian workers’ average hourly wage growth surpasses inflation
SDG goal 8 of the SDGs promotes sustained, inclusive and sustainable economic growth, full and productive employment and decent work for all. The average hourly earnings of employees is one of the indicators measuring progress towards this goal.
From 2015 to 2024, the average hourly wage of Canadian workers, including full- and part-time employees, rose 36.1% to $35.20, which outpaced inflation over the same period (27.1%). The notable increase in wages demonstrates progress that is on track towards achieving the 2030 target of full and productive employment and decent work for all.
Among provinces in 2024, British Columbia ($36.65) and Ontario ($36.44) recorded the highest average hourly earnings of full- and part-time employees. On the other hand, Alberta (+21.6%) and Saskatchewan (+22.7%) had the smallest increases among all provinces from 2015 to 2024, with slight inflation-adjusted declines.
Across all occupations, management roles recorded the largest increase in average hourly wages in Canada, with earnings increasing to $60.48 in 2024, a 40.6% increase since 2015. In 2024, health occupations (except management) earned $36.70 per hour on average and recorded the smallest increase (+24.5%) from 2015.
For more data related to this indicator, visit Indicator 8.5.1 - Average hourly earnings of employees, by sex, age, occupation and persons with disabilities.
These stories offer a glimpse into Canada’s progress towards the SDGs. To explore more SDG data, insights, and tools, visit the Sustainable Development Goals Information Hub and help build a more sustainable future.

Contact information
For more information, contact the Statistical Information Service (toll-free 1-800-263-1136; 514-283-8300; infostats@statcan.gc.ca) or Media Relations (statcan.mediahotline-ligneinfomedias.statcan@statcan.gc.ca).