

Strong demand at home and abroad—shaped by shifting economic conditions and changing geopolitical landscapes—helped drive another year of growth for Canada’s natural gas sector in 2025, as the shift from other fossil fuels, such as coal, to natural gas continues. This has led to the emergence of new markets for natural gas exports.
In 2025, this translated into the sector reaching record levels across key indicators. Marketable production of natural gas rose 3.4% from 2024, reaching 8.2 billion gigajoules in 2025. Exports increased to 3.7 billion gigajoules (+6.4%), while domestic demand rose to 5.3 billion gigajoules (+2.7%) over the same period.
Chart 1: Key indicators of natural gas, Canada
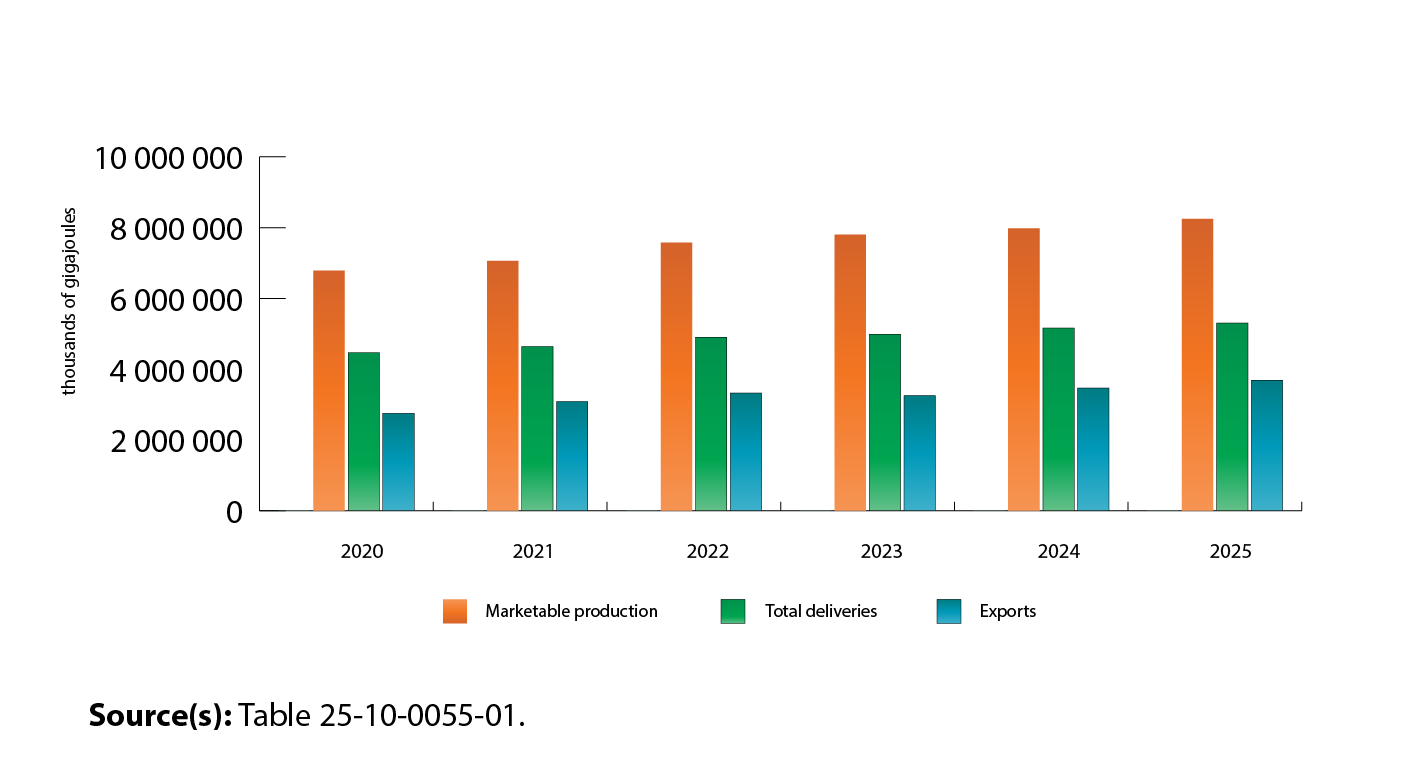
Description - Chart 1: Key indicators of natural gas, Canada
The title of this chart is “Key indicators of natural gas, Canada.”
This is a vertical bar chart.
The vertical axis shows volumes of natural gas in thousands of gigajoules. It goes from 0 to 10,000,000, by increments of 2,000,000.
The horizontal axis shows the years from 2020 to 2025, in chronological order from left to right.
There are three bars for each year. The first bar represents marketable production, the second bar represents total deliveries and the third bar represents exports.
In 2020, marketable production was 6,788,294 thousand gigajoules, total deliveries were 4,464,270 thousand gigajoules and exports were 2,753,608 thousand gigajoules.
In 2021, marketable production was 7,606,125 thousand gigajoules, total deliveries were 4,640,633 thousand gigajoules and exports were 3,081,488 thousand gigajoules.
In 2022, marketable production was 7,578,140 thousand gigajoules, total deliveries were 4,902,736 thousand gigajoules and exports were 3,326,466 thousand gigajoules.
In 2023, marketable production was 7,800,780 thousand gigajoules, total deliveries were 4,990,123 thousand gigajoules and exports were 3,429,333 thousand gigajoules.
In 2024, marketable production was 7,978,834 thousand gigajoules, total deliveries were 5,162,639 thousand gigajoules and exports were 3,466,721 thousand gigajoules.
In 2025, marketable production was 8,249,087 thousand gigajoules, total deliveries were 5,302,061 thousand gigajoules and exports were 3,687,803 thousand gigajoules.
Source(s): Table 25-10-0055-01.
Sharp growth in British Columbia drives series high in natural gas marketable production
Most of the increase in Canadian production of natural gas in 2025 came from British Columbia (+6.1%), followed by Alberta (+2.1%). Together, these provinces accounted for almost all (99.1%) natural gas production nationwide.
The increase in British Columbia was the sixth consecutive annual gain in that province. In fact, increases have been recorded in every year since the start of the current data series in 2016, except in 2019, when production was reduced throughout the year due to a major pipeline rupture that took place at the end of 2018. The increase in production in 2025 is linked to the July opening of Canada’s first liquefied natural gas (LNG) export facility in Kitimat, British Columbia.
Colder weather causes domestic demand to rise in 2025
Domestic demand rose 2.7% in 2025 to reach a record 5.3 billion gigajoules. This gain was observed in all sectors and was driven by strong growth in the commercial and institutional sectors (+9.3%) and the residential sector (+7.2%).
Notably, consumption increased in the first quarter on a year-over-year basis because of strong growth in the commercial and institutional (+11.4%) and residential (+9.3%) sectors, due to colder temperatures.
Industrial consumption of natural gas also experienced growth in 2025 (+1.1%), reaching a series high of 4.0 billion gigajoules. Alberta consumed two-thirds (66.4%) of this volume, as natural gas is a key input in oil sands operations, which also posted record growth in 2025. Demand in the industrial sector accounted for more than three-quarters (76.2%) of all natural gas deliveries in Canada.
Record exports of natural gas driven by new export markets
Exports of Canadian natural gas rose 6.4% to reach a record 3.7 billion gigajoules in 2025. This growth was driven by British Columbia, which exported 1.7 billion gigajoules (+9.5%) in 2025.
Exports to the United States increased 2.7% to 3.6 billion gigajoules in 2025, driven by strong demand resulting from colder weather in the first quarter, which was up 9.3% from the same quarter in 2024. Exports to all other countries totalled 0.1 billion gigajoules in 2025, comprising 3.4% of total exports that year.
Chart 2: Canadian exports of natural gas
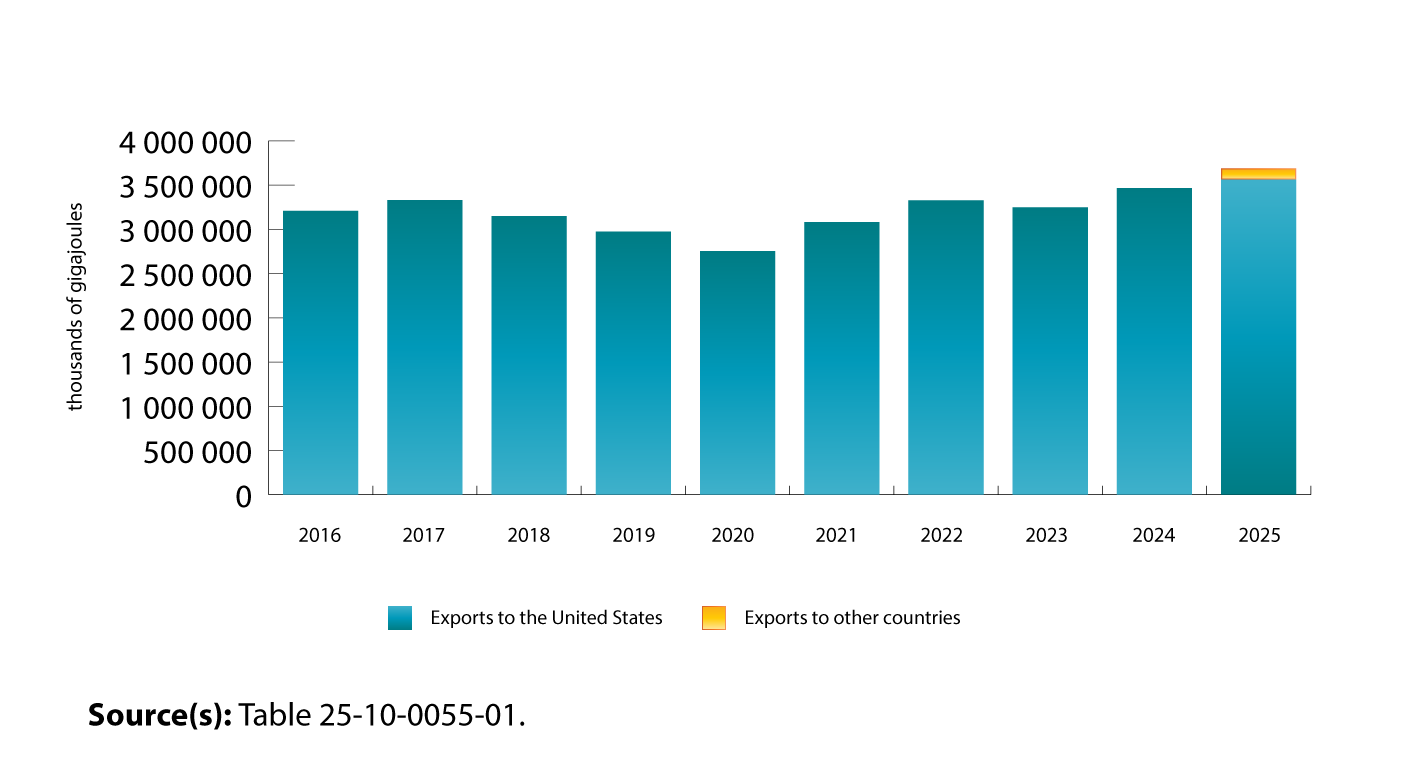
Description - Chart 2: Canadian exports of natural gas
The title of this chart is “Canadian exports of natural gas.”
This is a vertical bar chart.
The vertical axis shows volumes of natural gas in thousands of gigajoules. It goes from 0 to 4,000,000, by increments of 500,000.
The horizontal axis shows the years from 2016 to 2025, in chronological order from left to right.
There is one bar for each year. For 2016 to 2024, the bar represents exports to the United States. For 2025, the bar is a stacked bar with two values. The bottom value represents exports to the United States, and the top value represents exports to other countries.
In 2016, exports to the United States were 3,209,609.3 thousand gigajoules.
In 2017, exports to the United States were 3,330,632.1 thousand gigajoules.
In 2018, exports to the United States were 3,149,200.0 thousand gigajoules.
In 2019, exports to the United States were 2,973,569.4 thousand gigajoules.
In 2020, exports to the United States were 2,753,608.2 thousand gigajoules.
In 2021, exports to the United States were 3,081,488.0 thousand gigajoules.
In 2022, exports to the United States were 3,326,466.4 thousand gigajoules.
In 2023, exports to the United States were 3,249,332.9 thousand gigajoules.
In 2024, exports to the United States were 3,466,721.1 thousand gigajoules.
In 2025, exports to the United States were 3,561,953.7 thousand gigajoules, and exports to other countries were 125,849.4 thousand gigajoules.
Source(s): Table 25-10-0055-01.
In July 2025, the first cargo shipment to Asian markets took place from the new LNG export facility in Kitimat, British Columbia. This project pushed Canadian natural gas to new frontiers, as 7.6% of all natural gas exports from British Columbia went to countries other than the United States. This was a first; prior to the opening of the Kitimat facility, all of the province’s exports of natural gas were delivered to the United States.
Colder weather results in more withdrawals of natural gas from storage
Increased demand for natural gas in some parts of the United States and Canada due to colder weather resulted in lower year-over-year inventories for seven months of 2025. Withdrawals of natural gas from storage totalled 0.6 billion gigajoules in 2025, an increase of more than one-third (+36.6%) from 2024. Despite this, inventories reached 1.2 billion gigajoules in October 2025, the highest level in the history of the series. October is when inventories tend to peak before the beginning of the heating season.
Did you know? Statistics Canada also publishes down-to-the-minute electricity data through the High-frequency electricity data visualization tool.
For more information on energy in Canada, including production, consumption, international trade and much more, visit the Canadian Centre for Energy Information portal and follow #energynews on social media.
Other energy 2025 year-in-review articles
Contact information
For more information, contact the Statistical Information Service (toll-free 1-800-263-1136; 514-283-8300; infostats@statcan.gc.ca) or Media Relations (statcan.mediahotline-ligneinfomedias.statcan@statcan.gc.ca).