


Electricity generated from all sources in Canada totalled 625.2 million megawatt-hours (MWh) in 2025, up 2.6% over 2024 and enough electricity to power 56 million homes for a year. Meanwhile, electricity available for consumption jumped 3.6% to 618.3 million MWh.
However, much like in 2023 and 2024, many regions in Canada continued to be affected by persistent and widespread drought conditions in 2025. As a result, hydroelectric generation, Canada’s single-largest generation source, remained muted.
In 2025, hydroelectricity totalled 343.4 million MWh, slightly higher (+0.5%) than 2024’s record low of 341.8 million MWh. Hydroelectricity represented just over half (54.9%) of Canada’s total generation in 2025, marking the lowest share since this series was redesigned in 2016.
Chart 1: Canadian electricity generation by type, 2016 to 2025
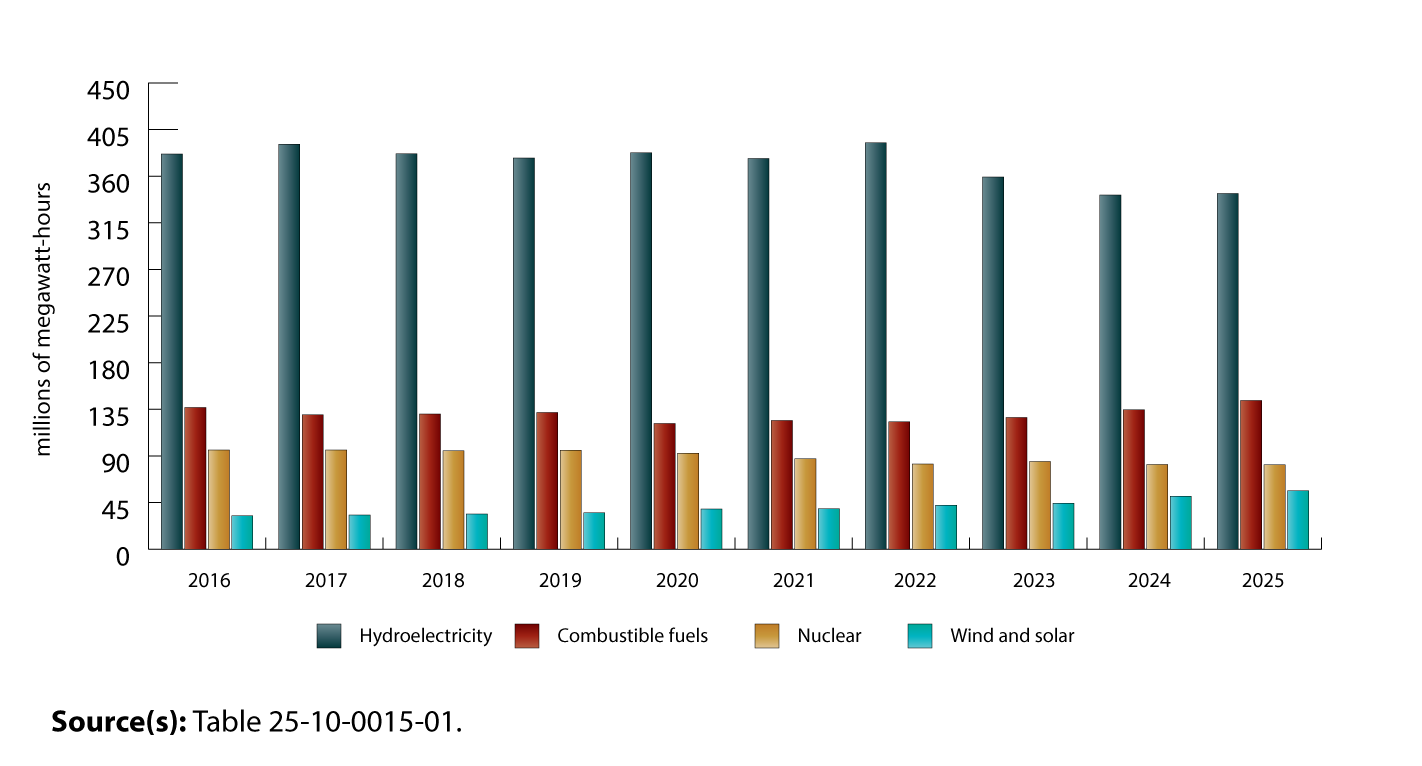
Description - Canadian electricity generation by type, 2016 to 2025
The title of this chart is “Canadian electricity generation by type, 2016 to 2025.”
This is a vertical bar chart.
The vertical axis represents the percentage of total generation in increments of 45 million megawatts.
The horizontal axis represents the years from 2016 to 2025, in chronological order from left to right.
There are four bars for each year. The first bar represents hydroelectricity, the second bar represents combustibles, the third bar represents nuclear and the fourth bar represents wind and solar.
Hydroelectricity generation was 381.4 megawatt-hours in 2016, 392.2 in 2017, 385.5 in 2018, 377.2 in 2019, 369.7 in 2020, 361.9 in 2021, 357.4 in 2022, 350.3 in 2023, 341.8 in 2024, and 343.4 in 2025.
Electricity generation from combustible fuels was 136.7 megawatt-hours in 2016, 131.6 in 2017, 130.4 in 2018, 126.7 in 2019, 119.5 in 2020, 127.9 in 2021, 137.8 in 2022, 140.8 in 2023, 134.6 in 2024, and 143.4 in 2025.
Nuclear generation was 95.7 megawatt-hours in 2016, 87.0 in 2017, 87.3 in 2018, 89.5 in 2019, 92.5 in 2020, 88.3 in 2021, 86.8 in 2022, 83.3 in 2023, 81.7 in 2024, and 81.6 in 2025.
Wind and solar generation was 32.3 megawatt-hours in 2016, 35.5 in 2017, 38.4 in 2018, 41.0 in 2019, 43.2 in 2020, 46.5 in 2021, 48.7 in 2022, 50.4 in 2023, 51.1 in 2024, and 56.5 in 2025.
Source(s): Table 25-10-0015-01.
Combustible generation soars to new high
In contrast to hydroelectricity, electricity generation from combustible fuels increased in 2025. This fuel type includes anything burned to generate electricity in a turbine, such as natural gas, coal, fuel oil, diesel and biomass like wood.
In 2025, combustibles totalled 143.4 million MWh, up 6.6% year over year and reaching the highest level since the series was redesigned in 2016. In 2025, combustible electricity represented 22.9% of Canada’s total generation, its highest share since the series redesign.
The overall increase was driven by Ontario, where generation from combustibles was up by nearly one-quarter (+23.7%) year over year, partly to compensate for the province’s lower nuclear generation.
Maintenance keeps generation at nuclear stations low
Nuclear electricity generation edged down 0.2% year over year to 81.6 million MWh in 2025, its lowest level since the series was redesigned. Two provinces currently generate nuclear electricity—Ontario and New Brunswick—with Ontario (96%) accounting for the vast majority in 2025.
Over the past decade, various units at generating stations in Ontario have been taken offline as part of multi-year refurbishment projects to extend their service lives, resulting in lower generation levels. As a result, nuclear generation in Ontario was 2.1% lower in 2025 than in 2024.
In contrast, generation at New Brunswick’s sole nuclear site rose 86.6% to 3.3 million MWh in 2025, due to the station being offline for maintenance from April to December 2024. While higher than it was in 2024, New Brunswick’s nuclear generation level in 2025 was its second-lowest level since the series was redesigned, as additional maintenance required an outage from July to December.
In total, nuclear accounted for 13.0% of Canada’s total electricity generation in 2025.
Wind and solar continue to grow by leaps and bounds
Electricity generation from wind turbines grew 10.1% year over year to 50.5 million MWh in 2025, while solar climbed 13.9% to 6.0 million MWh. Both were record highs and, combined, they accounted for 9.0% of Canada’s total generation, their largest share to date.
Wind generation in Alberta rose 16.5% to 14.9 million MWh, replacing Ontario as Canada’s largest wind generator in 2025. Alberta led the country in solar generation as well, increasing by more than one-quarter (+26.6%) year over year to 3.5 million MWh.
Chart 2: Wind generation, top three provinces, 2016 to 2025
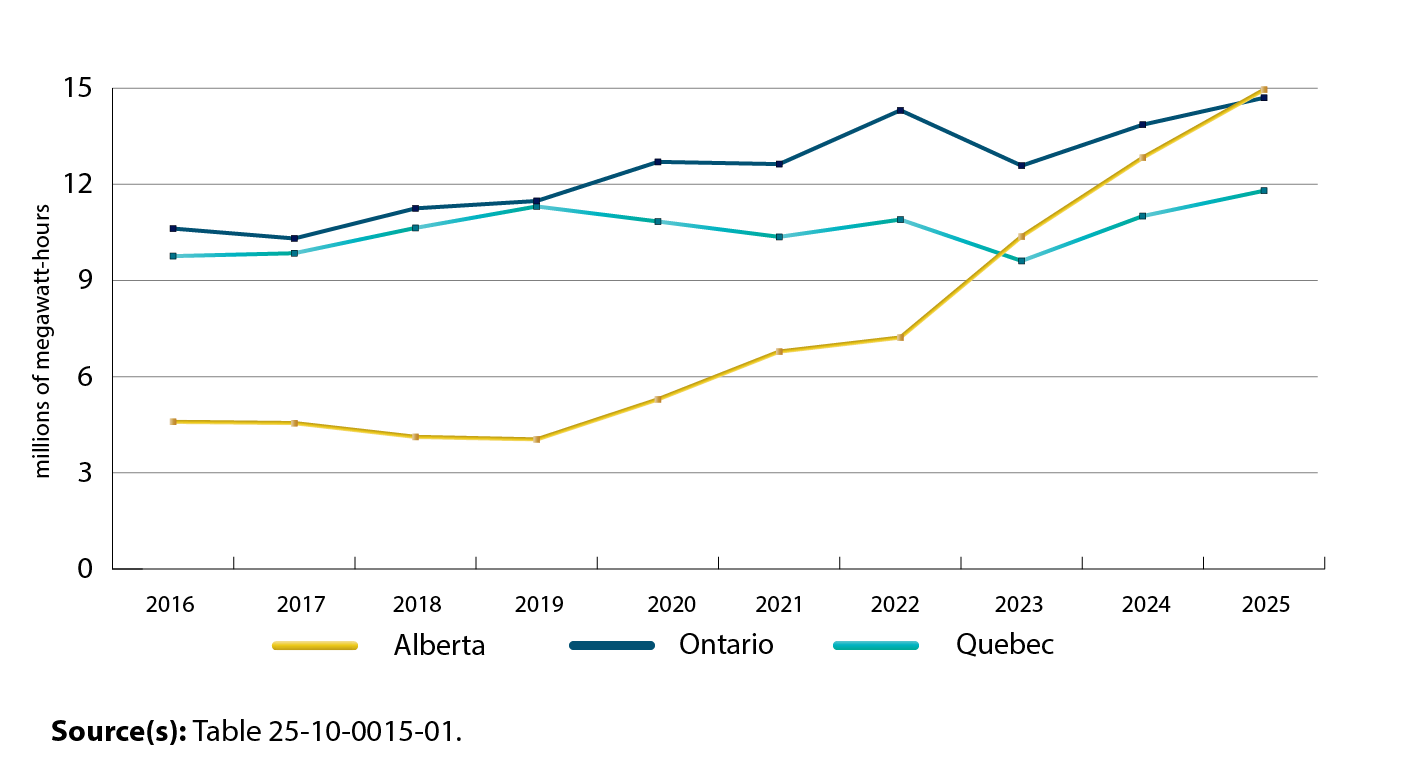
Description - Wind generation, top three provinces, 2016 to 2025
The title of this chart is “Wind generation, top three provinces, 2016 to 2025.”
This chart shows annual wind electricity generation, measured in megawatt-hours, for the three leading provinces—Ontario, Quebec, and Alberta—from 2016 to 2025.
This is a line chart with three lines. One line represents wind generation in Alberta, the second line represents wind generation in Ontario and the third represents wind generation in Quebec.
The vertical axis represents millions of megawatt-hours, from 0 to 15 million megawatt-hours, in increments of 3 million megawatt-hours.
The horizontal axis represents years in chronological order from left to right and goes from 2016 to 2025.
In Alberta, wind generation was 4.6 megawatt-hours in 2016, 4.6 in 2017, 4.1 in 2018, 4.0 in 2019, 5.3 in 2020, 6.8 in 2021, 7.2 in 2022, 10.4 in 2023, 12.8 in 2024, and 14.9 in 2025.
In Ontario, wind generation was 10.6 megawatt-hours in 2016, 10.3 in 2017, 11.3 in 2018, 11.5 in 2019, 12.7 in 2020, 12.6 in 2021, 14.3 in 2022, 12.6 in 2023, 13.9 in 2024, and 14.7 in 2025.
In Quebec, wind generation was 9.8 megawatt-hours in 2016, 9.8 in 2017, 10.6 in 2018, 11.3 in 2019, 10.8 in 2020, 10.4 in 2021, 10.9 in 2022, 9.6 in 2023, 11.0 in 2024, and 11.8 in 2025.
Source(s): Table 25-10-0015-01.
Canada’s electricity trade surplus narrows
In 2025, total imports of electricity from the United States, Canada’s lone electricity trade partner, jumped 8.2% to 25.2 million MWh, the highest level observed since the series was redesigned. In contrast, exports fell 10.4% to 32.1 million MWh, a series low.
Chart 3: Canadian imports and exports of electricity, 2016 to 2025
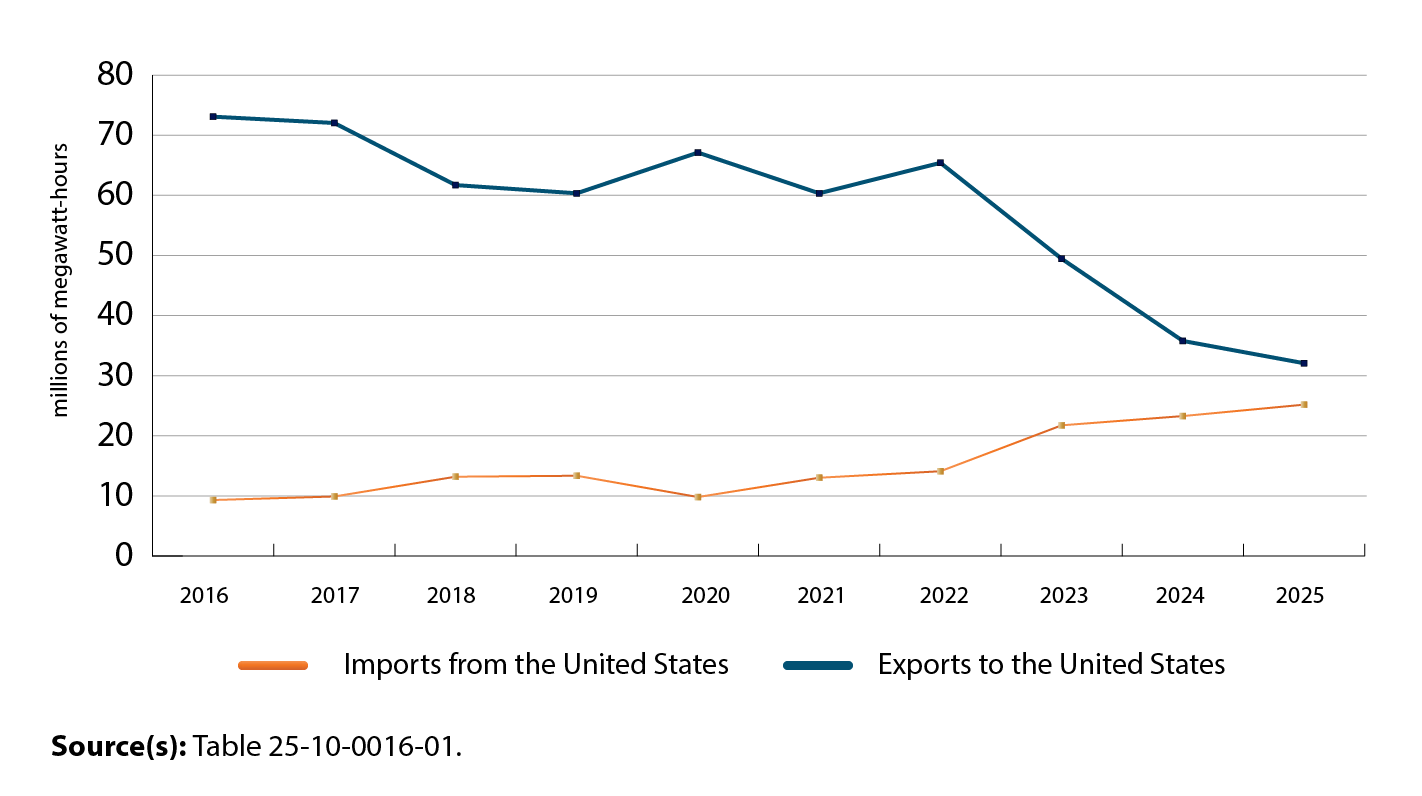
Description - Canadian imports and exports of electricity, 2016 to 2025
The title of this chart is “Canadian imports and exports of electricity, 2016 to 2025.”
This is a line chart. The bottom line represents imports from the United States, and the top line represents exports to the United States.
The vertical axis represents millions of megawatt-hours, from 0 to 80 million megawatt-hours, in increments of 10 million megawatt-hours.
The horizontal axis represents years in chronological order from left to right and goes from 2016 to 2025.
In 2016, imports were 9.3 million megawatt-hours and exports were 73.1 million megawatt-hours.
In 2017, imports were 9.9 million megawatt-hours and exports were 72.0 million megawatt-hours.
In 2018, imports were 13.2 million megawatt-hours and exports were 61.7 million megawatt-hours.
In 2019, imports were 13.4 million megawatt-hours and exports were 60.3 million megawatt-hours.
In 2020, imports were 9.8 million megawatt-hours and exports were 67.1 million megawatt-hours.
In 2021, imports were 13.0 million megawatt-hours and exports were 60.3 million megawatt-hours.
In 2022, imports were 14.1 million megawatt-hours and exports were 65.4 million megawatt-hours.
In 2023, imports were 21.7 million megawatt-hours and exports were 49.5 million megawatt-hours.
In 2024, imports were 23.3 million megawatt-hours and exports were 35.8 million megawatt-hours.
In 2025, imports were 25.2 million megawatt-hours and exports were 32.1 million megawatt-hours.
Source(s): Table 25-10-0016-01.
As previously mentioned, parts of Canada have been struggling with dry conditions since at least 2023, impacting hydroelectric generation. This shortfall, combined with steadily growing domestic demand, has meant less electricity is available for export to the United States, which is an important revenue source for some provinces, including Quebec and Manitoba.
Prior to 2024, electricity imports never exceeded exports. However, in the last two years, Canada was a net importer during the months of February, March and April 2024 and in March, October, November and December 2025.
Electricity imports to Quebec (+91.5% to 7.4 million MWh) represented the largest share of the overall growth in imports in 2025, positioning Quebec as the second-highest importer in Canada, behind British Columbia. Typically, British Columbia has the highest imports due to its system of very actively buying or selling electricity as prices fluctuate. In contrast, Quebec has historically imported almost no electricity. From 2016 to 2022, before the worst of the drought conditions set in, Quebec imported an average of 174 000 MWh a year.
Manitoba (-42.3% to 3.5 million MWh) was responsible for the largest share of the overall decrease in electricity exports in 2025, followed by Quebec (-29.4% to 4.2 million MWh). For both provinces, this was the lowest export level since the series redesign. To further illustrate the effects of the drought, from 2016 to 2022, Manitoba’s exports averaged 8.5 million MWh annually, while Quebec’s exports during the same period averaged 25.3 million MWh.
Did you know? Statistics Canada also publishes down-to-the-minute electricity data through the High-frequency electricity data visualization tool.
For more information on energy in Canada, including production, consumption, international trade and much more, visit the Canadian Centre for Energy Information portal and follow #energynews on social media.
Other energy 2025 year-in-review articles
- Natural gas in 2025: Record production, rising consumption and expanding exports (April 8, 2026)
- Another record year of production for refined petroleum in 2025 (April 14, 2026)
- Canadian crude oil reaches new heights in 2025 (June 2, 2026)
Correction
On April 2, 2026, a correction was made to the accessibility text for Chart 2, as the data points for Ontario, Quebec, and Alberta were listed in reverse order. The chart itself was not affected.
Contact information
For more information, contact the Statistical Information Service (toll-free 1-800-263-1136; 514-283-8300; infostats@statcan.gc.ca) or Media Relations (statcan.mediahotline-ligneinfomedias.statcan@statcan.gc.ca).