


The Labour Force Survey (LFS) has been tracking labour market information in Canada since 1945; it has long served as the country’s official measure of employment, unemployment and participation rates. The LFS went from a quarterly survey to a monthly survey in 1952, with additional changes being introduced over time.
In January 1976, a major redesign of the survey was finalized, providing 50 years (and counting!) of comparable data. By increasing the sample size, the LFS was able to produce better quality data. As well, a more robust questionnaire aligned with international labour market concepts allowed for direct questions to determine the labour market status (employed, unemployed or not in the labour force) of both men and women.
At the same time, the LFS added new questions on educational attainment, availability for work, small business incorporation status, industry and occupation of previous job and main reason for leaving last job, among other indicators.
In 1997, further additions aimed to improve data availability while retaining a continuous time series for key indicators. These additions included questions on wages for employees, job permanence, union membership, workplace and firm size. In 2006, questions were added about immigrant status as well as country of birth and education. In 2015, modernization initiatives rolled out an electronic questionnaire, making it more convenient for respondents. Further, the addition of a question in 2022 made it possible to study the labour market outcomes of racialized groups.
On a regular basis, enhancements and improvements to the LFS methodology and content are applied to ensure the survey continues to deliver relevant, high-quality and timely labour market information.
With the consistent series introduced in the beginning of 1976 as a backdrop, let’s take a look back at the last half-century of LFS data.
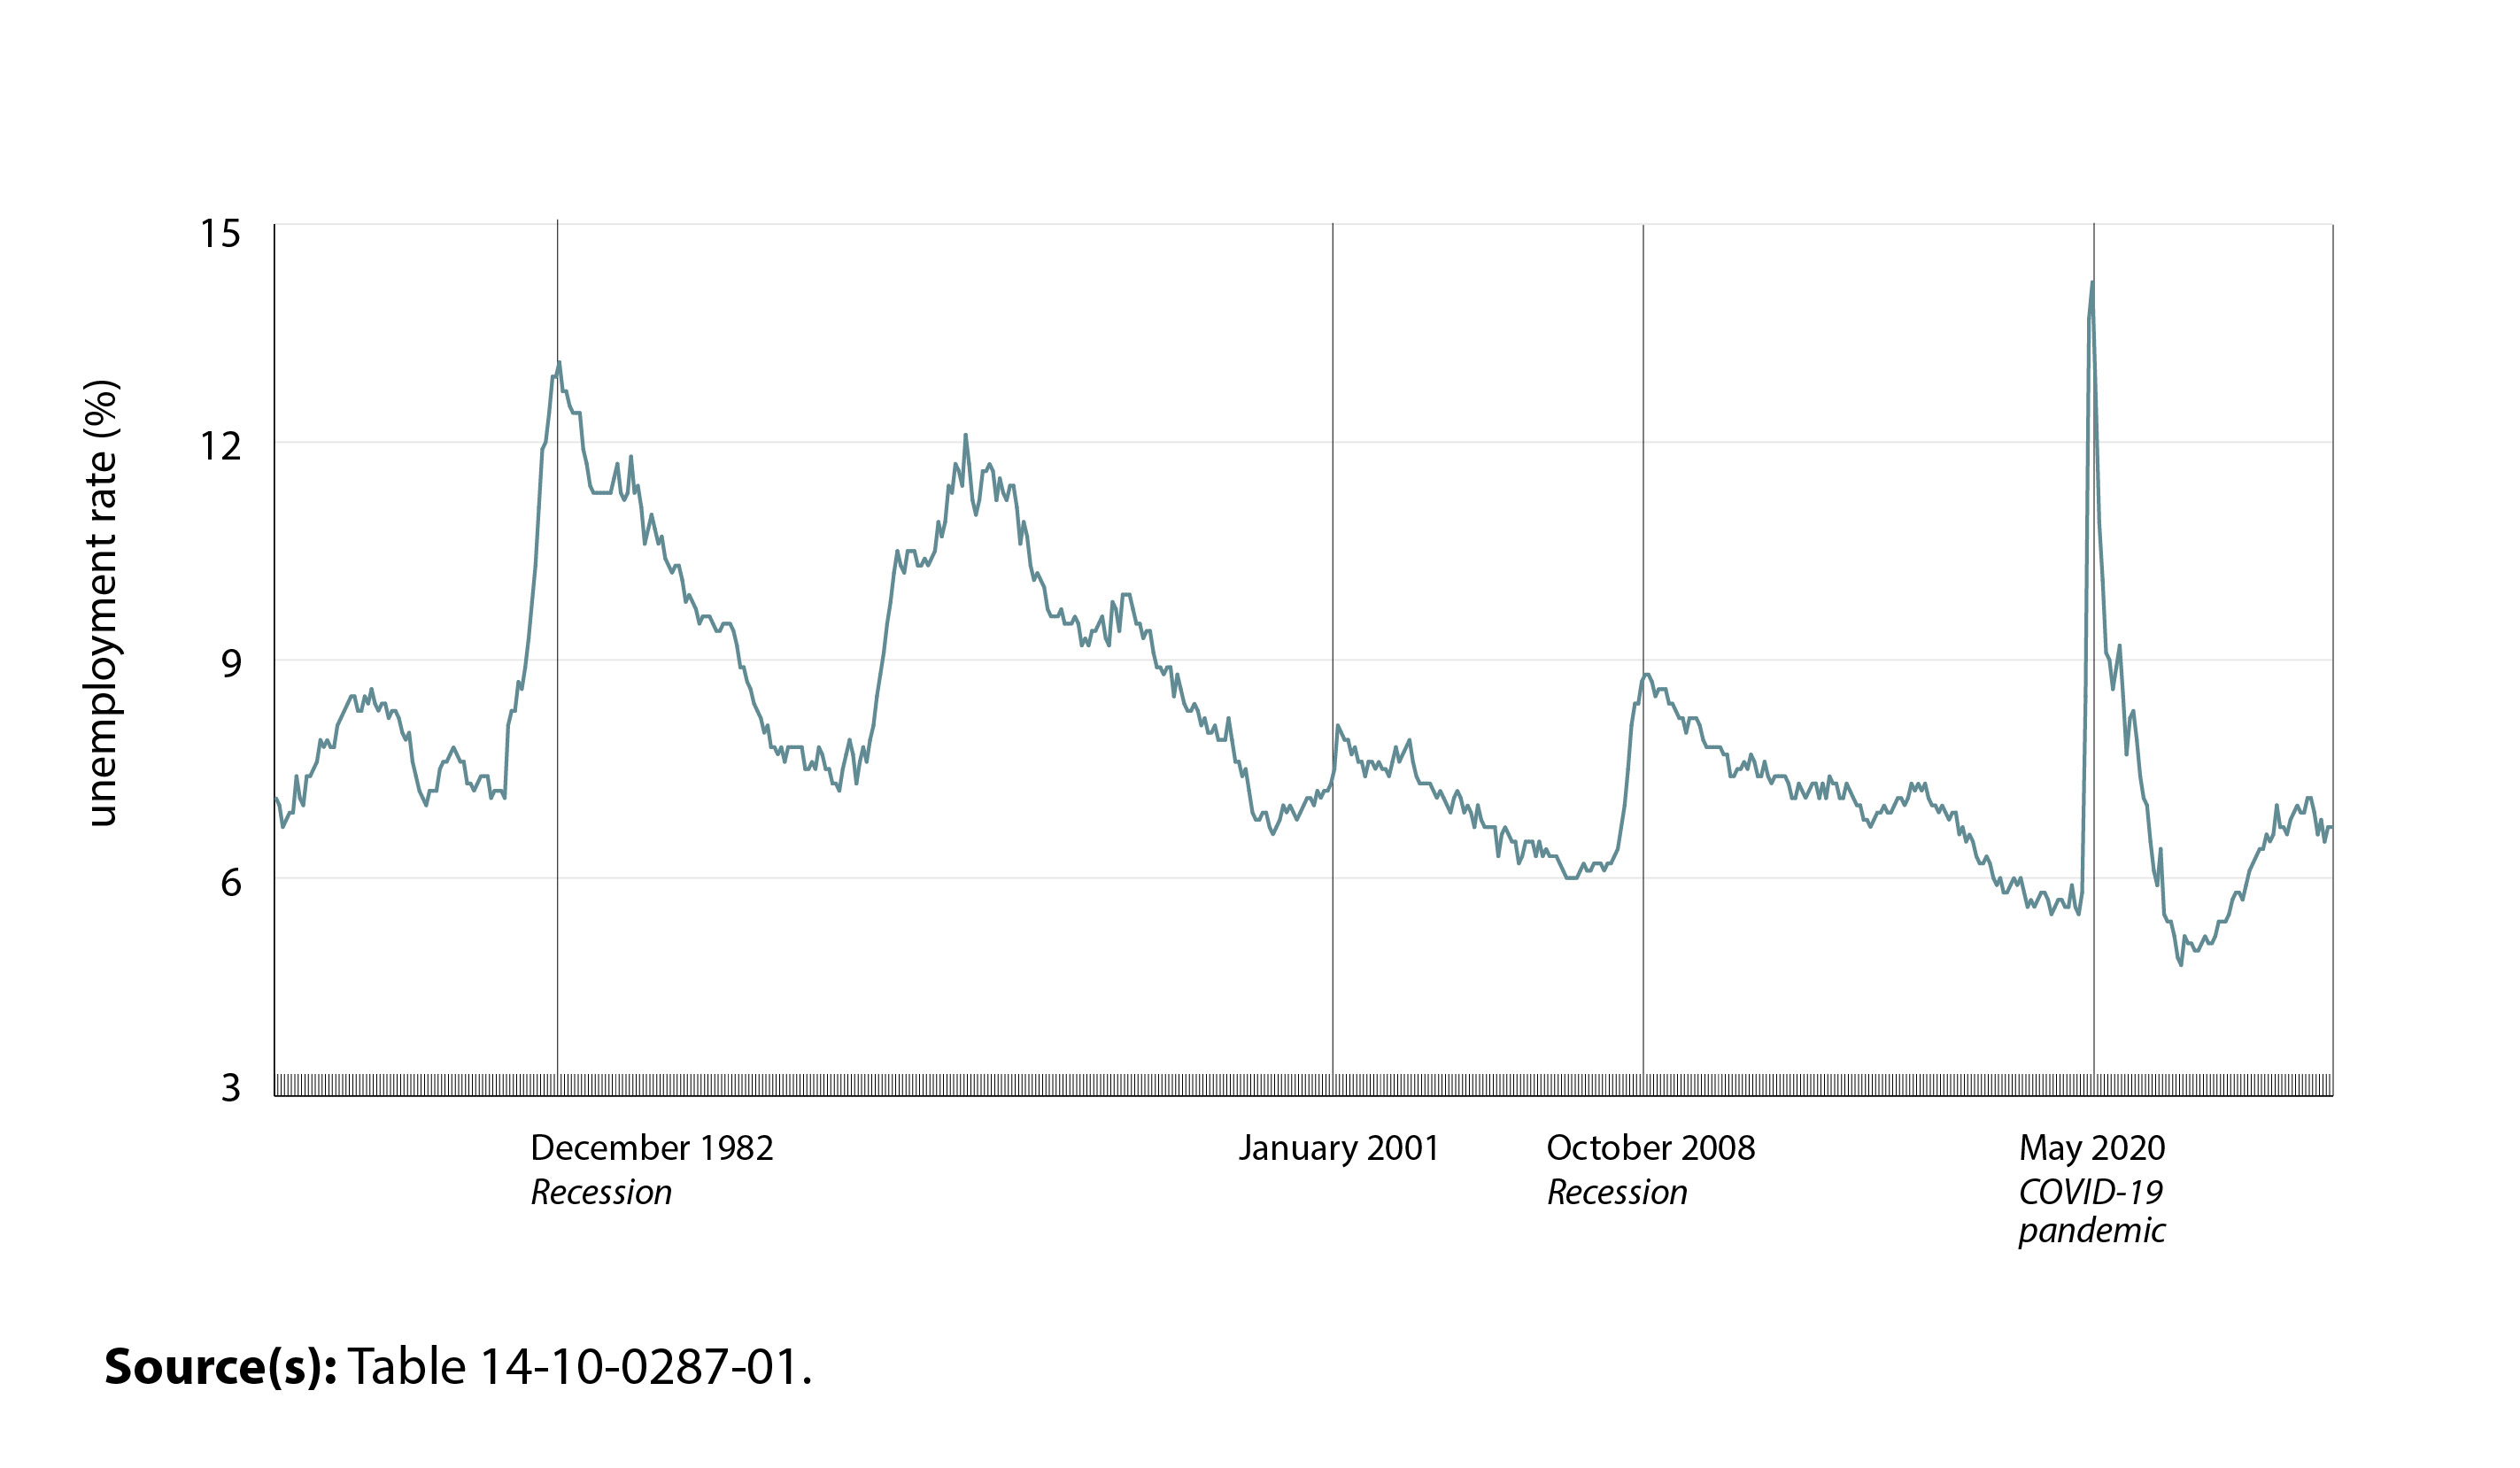
The unemployment rate: From the recession of the early 1980s to the COVID-19 pandemic to 2025’s tariff effects
In January 1976, the unemployment rate (seasonally adjusted) stood at 7.1%, and by April 1982, it crept up to 9.8%, marking the last time until January 1986 (9.8%) that it would dip under 10%.
Unemployment reached a peak of 13.1% in December 1982, at the height of the early 1980s recession.
From the 1980s through the 2010s, the unemployment rate rose and fell along with economic events such as the early 1990s recession, the early 2000s economic downturns and the 2008 global financial and economic crisis.
The unemployment rate increased from one of the lowest levels on record in February 2020 (5.8%) to a record high of 14.2% in May 2020 amid the outbreak of the COVID-19 pandemic. It dropped to its lowest level on record since the 1976 survey redesign in July 2022 (4.8%), at a time when many industries were recovering from the impacts of the pandemic and there were nearly 1 million job vacancies.
While trade uncertainty and threat or imposition of tariffs have affected employment in sectors dependent on exports to the United States over the past year, the unemployment rate, after climbing to a recent high of 7.1% in August and September 2025, declined to 6.7% in March 2026.
Chart 1: Unemployment rate, Canadians aged 15 years and older (seasonally adjusted)
Description - Chart 1: Unemployment rate, Canadians aged 15 years and older (seasonally adjusted)
The title of this chart is “Unemployment rate, Canadians aged 15 years and older (seasonally adjusted).”
This is a line chart.
The vertical axis represents the unemployment rate, from 3% to 15%, in increments of 3%.
The horizontal axis represents the months and years, from January 1976 to March 2026, in chronological order. However, only the following months and years are displayed on the axis, some with an added descriptor: December 1982, recession; January 2001; October 2008, recession; and May 2020, COVID-19 pandemic.
In January 1976, the unemployment rate was 7.1%.
In February 1976, the unemployment rate was 7.0%.
In March 1976, the unemployment rate was 6.7%.
In April 1976, the unemployment rate was 6.8%.
In May 1976, the unemployment rate was 6.9%.
In June 1976, the unemployment rate was 6.9%.
In July 1976, the unemployment rate was 7.4%.
In August 1976, the unemployment rate was 7.1%.
In September 1976, the unemployment rate was 7.0%.
In October 1976, the unemployment rate was 7.4%.
In November 1976, the unemployment rate was 7.4%.
In December 1976, the unemployment rate was 7.5%.
In January 1977, the unemployment rate was 7.6%.
In February 1977, the unemployment rate was 7.9%.
In March 1977, the unemployment rate was 7.8%.
In April 1977, the unemployment rate was 7.9%.
In May 1977, the unemployment rate was 7.8%.
In June 1977, the unemployment rate was 7.8%.
In July 1977, the unemployment rate was 8.1%.
In August 1977, the unemployment rate was 8.2%.
In September 1977, the unemployment rate was 8.3%.
In October 1977, the unemployment rate was 8.4%.
In November 1977, the unemployment rate was 8.5%.
In December 1977, the unemployment rate was 8.5%.
In January 1978, the unemployment rate was 8.3%.
In February 1978, the unemployment rate was 8.3%.
In March 1978, the unemployment rate was 8.5%.
In April 1978, the unemployment rate was 8.4%.
In May 1978, the unemployment rate was 8.6%.
In June 1978, the unemployment rate was 8.4%.
In July 1978, the unemployment rate was 8.3%.
In August 1978, the unemployment rate was 8.4%.
In September 1978, the unemployment rate was 8.4%.
In October 1978, the unemployment rate was 8.2%.
In November 1978, the unemployment rate was 8.3%.
In December 1978, the unemployment rate was 8.3%.
In January 1979, the unemployment rate was 8.2%.
In February 1979, the unemployment rate was 8.0%.
In March 1979, the unemployment rate was 7.9%.
In April 1979, the unemployment rate was 8.0%.
In May 1979, the unemployment rate was 7.6%.
In June 1979, the unemployment rate was 7.4%.
In July 1979, the unemployment rate was 7.2%.
In August 1979, the unemployment rate was 7.1%.
In September 1979, the unemployment rate was 7.0%.
In October 1979, the unemployment rate was 7.2%.
In November 1979, the unemployment rate was 7.2%.
In December 1979, the unemployment rate was 7.2%.
In January 1980, the unemployment rate was 7.5%.
In February 1980, the unemployment rate was 7.6%.
In March 1980, the unemployment rate was 7.6%.
In April 1980, the unemployment rate was 7.7%.
In May 1980, the unemployment rate was 7.8%.
In June 1980, the unemployment rate was 7.7%.
In July 1980, the unemployment rate was 7.6%.
In August 1980, the unemployment rate was 7.6%.
In September 1980, the unemployment rate was 7.3%.
In October 1980, the unemployment rate was 7.3%.
In November 1980, the unemployment rate was 7.2%.
In December 1980, the unemployment rate was 7.3%.
In January 1981, the unemployment rate was 7.4%.
In February 1981, the unemployment rate was 7.4%.
In March 1981, the unemployment rate was 7.4%.
In April 1981, the unemployment rate was 7.1%.
In May 1981, the unemployment rate was 7.2%.
In June 1981, the unemployment rate was 7.2%.
In July 1981, the unemployment rate was 7.2%.
In August 1981, the unemployment rate was 7.1%.
In September 1981, the unemployment rate was 8.1%.
In October 1981, the unemployment rate was 8.3%.
In November 1981, the unemployment rate was 8.3%.
In December 1981, the unemployment rate was 8.7%.
In January 1982, the unemployment rate was 8.6%.
In February 1982, the unemployment rate was 8.9%.
In March 1982, the unemployment rate was 9.3%.
In April 1982, the unemployment rate was 9.8%.
In May 1982, the unemployment rate was 10.3%.
In June 1982, the unemployment rate was 11.1%.
In July 1982, the unemployment rate was 11.9%.
In August 1982, the unemployment rate was 12.0%.
In September 1982, the unemployment rate was 12.4%.
In October 1982, the unemployment rate was 12.9%.
In November 1982, the unemployment rate was 12.9%.
In December 1982, the unemployment rate was 13.1%.
In January 1983, the unemployment rate was 12.7%.
In February 1983, the unemployment rate was 12.7%.
In March 1983, the unemployment rate was 12.5%.
In April 1983, the unemployment rate was 12.4%.
In May 1983, the unemployment rate was 12.4%.
In June 1983, the unemployment rate was 12.4%.
In July 1983, the unemployment rate was 11.9%.
In August 1983, the unemployment rate was 11.7%.
In September 1983, the unemployment rate was 11.4%.
In October 1983, the unemployment rate was 11.3%.
In November 1983, the unemployment rate was 11.3%.
In December 1983, the unemployment rate was 11.3%.
In January 1984, the unemployment rate was 11.3%.
In February 1984, the unemployment rate was 11.3%.
In March 1984, the unemployment rate was 11.3%.
In April 1984, the unemployment rate was 11.5%.
In May 1984, the unemployment rate was 11.7%.
In June 1984, the unemployment rate was 11.3%.
In July 1984, the unemployment rate was 11.2%.
In August 1984, the unemployment rate was 11.3%.
In September 1984, the unemployment rate was 11.8%.
In October 1984, the unemployment rate was 11.3%.
In November 1984, the unemployment rate was 11.4%.
In December 1984, the unemployment rate was 11.1%.
In January 1985, the unemployment rate was 10.6%.
In February 1985, the unemployment rate was 10.8%.
In March 1985, the unemployment rate was 11.0%.
In April 1985, the unemployment rate was 10.8%.
In May 1985, the unemployment rate was 10.6%.
In June 1985, the unemployment rate was 10.7%.
In July 1985, the unemployment rate was 10.4%.
In August 1985, the unemployment rate was 10.3%.
In September 1985, the unemployment rate was 10.2%.
In October 1985, the unemployment rate was 10.3%.
In November 1985, the unemployment rate was 10.3%.
In December 1985, the unemployment rate was 10.1%.
In January 1986, the unemployment rate was 9.8%.
In February 1986, the unemployment rate was 9.9%.
In March 1986, the unemployment rate was 9.8%.
In April 1986, the unemployment rate was 9.7%.
In May 1986, the unemployment rate was 9.5%.
In June 1986, the unemployment rate was 9.6%.
In July 1986, the unemployment rate was 9.6%.
In August 1986, the unemployment rate was 9.6%.
In September 1986, the unemployment rate was 9.5%.
In October 1986, the unemployment rate was 9.4%.
In November 1986, the unemployment rate was 9.4%.
In December 1986, the unemployment rate was 9.5%.
In January 1987, the unemployment rate was 9.5%.
In February 1987, the unemployment rate was 9.5%.
In March 1987, the unemployment rate was 9.4%.
In April 1987, the unemployment rate was 9.2%.
In May 1987, the unemployment rate was 8.9%.
In June 1987, the unemployment rate was 8.9%.
In July 1987, the unemployment rate was 8.7%.
In August 1987, the unemployment rate was 8.6%.
In September 1987, the unemployment rate was 8.4%.
In October 1987, the unemployment rate was 8.3%.
In November 1987, the unemployment rate was 8.2%.
In December 1987, the unemployment rate was 8.0%.
In January 1988, the unemployment rate was 8.1%.
In February 1988, the unemployment rate was 7.8%.
In March 1988, the unemployment rate was 7.8%.
In April 1988, the unemployment rate was 7.7%.
In May 1988, the unemployment rate was 7.8%.
In June 1988, the unemployment rate was 7.6%.
In July 1988, the unemployment rate was 7.8%.
In August 1988, the unemployment rate was 7.8%.
In September 1988, the unemployment rate was 7.8%.
In October 1988, the unemployment rate was 7.8%.
In November 1988, the unemployment rate was 7.8%.
In December 1988, the unemployment rate was 7.5%.
In January 1989, the unemployment rate was 7.5%.
In February 1989, the unemployment rate was 7.6%.
In March 1989, the unemployment rate was 7.5%.
In April 1989, the unemployment rate was 7.8%.
In May 1989, the unemployment rate was 7.7%.
In June 1989, the unemployment rate was 7.5%.
In July 1989, the unemployment rate was 7.5%.
In August 1989, the unemployment rate was 7.3%.
In September 1989, the unemployment rate was 7.3%.
In October 1989, the unemployment rate was 7.2%.
In November 1989, the unemployment rate was 7.5%.
In December 1989, the unemployment rate was 7.7%.
In January 1990, the unemployment rate was 7.9%.
In February 1990, the unemployment rate was 7.7%.
In March 1990, the unemployment rate was 7.3%.
In April 1990, the unemployment rate was 7.6%.
In May 1990, the unemployment rate was 7.8%.
In June 1990, the unemployment rate was 7.6%.
In July 1990, the unemployment rate was 7.9%.
In August 1990, the unemployment rate was 8.1%.
In September 1990, the unemployment rate was 8.5%.
In October 1990, the unemployment rate was 8.8%.
In November 1990, the unemployment rate was 9.1%.
In December 1990, the unemployment rate was 9.5%.
In January 1991, the unemployment rate was 9.8%.
In February 1991, the unemployment rate was 10.2%.
In March 1991, the unemployment rate was 10.5%.
In April 1991, the unemployment rate was 10.3%.
In May 1991, the unemployment rate was 10.2%.
In June 1991, the unemployment rate was 10.5%.
In July 1991, the unemployment rate was 10.5%.
In August 1991, the unemployment rate was 10.5%.
In September 1991, the unemployment rate was 10.3%.
In October 1991, the unemployment rate was 10.3%.
In November 1991, the unemployment rate was 10.4%.
In December 1991, the unemployment rate was 10.3%.
In January 1992, the unemployment rate was 10.4%.
In February 1992, the unemployment rate was 10.5%.
In March 1992, the unemployment rate was 10.9%.
In April 1992, the unemployment rate was 10.7%.
In May 1992, the unemployment rate was 10.9%.
In June 1992, the unemployment rate was 11.4%.
In July 1992, the unemployment rate was 11.3%.
In August 1992, the unemployment rate was 11.7%.
In September 1992, the unemployment rate was 11.6%.
In October 1992, the unemployment rate was 11.4%.
In November 1992, the unemployment rate was 12.1%.
In December 1992, the unemployment rate was 11.7%.
In January 1993, the unemployment rate was 11.2%.
In February 1993, the unemployment rate was 11.0%.
In March 1993, the unemployment rate was 11.2%.
In April 1993, the unemployment rate was 11.6%.
In May 1993, the unemployment rate was 11.6%.
In June 1993, the unemployment rate was 11.7%.
In July 1993, the unemployment rate was 11.6%.
In August 1993, the unemployment rate was 11.2%.
In September 1993, the unemployment rate was 11.5%.
In October 1993, the unemployment rate was 11.3%.
In November 1993, the unemployment rate was 11.2%.
In December 1993, the unemployment rate was 11.4%.
In January 1994, the unemployment rate was 11.4%.
In February 1994, the unemployment rate was 11.1%.
In March 1994, the unemployment rate was 10.6%.
In April 1994, the unemployment rate was 10.9%.
In May 1994, the unemployment rate was 10.7%.
In June 1994, the unemployment rate was 10.3%.
In July 1994, the unemployment rate was 10.1%.
In August 1994, the unemployment rate was 10.2%.
In September 1994, the unemployment rate was 10.1%.
In October 1994, the unemployment rate was 10.0%.
In November 1994, the unemployment rate was 9.7%.
In December 1994, the unemployment rate was 9.6%.
In January 1995, the unemployment rate was 9.6%.
In February 1995, the unemployment rate was 9.6%.
In March 1995, the unemployment rate was 9.7%.
In April 1995, the unemployment rate was 9.5%.
In May 1995, the unemployment rate was 9.5%.
In June 1995, the unemployment rate was 9.5%.
In July 1995, the unemployment rate was 9.6%.
In August 1995, the unemployment rate was 9.5%.
In September 1995, the unemployment rate was 9.2%.
In October 1995, the unemployment rate was 9.3%.
In November 1995, the unemployment rate was 9.2%.
In December 1995, the unemployment rate was 9.4%.
In January 1996, the unemployment rate was 9.4%.
In February 1996, the unemployment rate was 9.5%.
In March 1996, the unemployment rate was 9.6%.
In April 1996, the unemployment rate was 9.3%.
In May 1996, the unemployment rate was 9.2%.
In June 1996, the unemployment rate was 9.8%.
In July 1996, the unemployment rate was 9.7%.
In August 1996, the unemployment rate was 9.4%.
In September 1996, the unemployment rate was 9.9%.
In October 1996, the unemployment rate was 9.9%.
In November 1996, the unemployment rate was 9.9%.
In December 1996, the unemployment rate was 9.7%.
In January 1997, the unemployment rate was 9.5%.
In February 1997, the unemployment rate was 9.5%.
In March 1997, the unemployment rate was 9.3%.
In April 1997, the unemployment rate was 9.4%.
In May 1997, the unemployment rate was 9.4%.
In June 1997, the unemployment rate was 9.1%.
In July 1997, the unemployment rate was 8.9%.
In August 1997, the unemployment rate was 8.9%.
In September 1997, the unemployment rate was 8.8%.
In October 1997, the unemployment rate was 8.9%.
In November 1997, the unemployment rate was 8.9%.
In December 1997, the unemployment rate was 8.5%.
In January 1998, the unemployment rate was 8.8%.
In February 1998, the unemployment rate was 8.6%.
In March 1998, the unemployment rate was 8.4%.
In April 1998, the unemployment rate was 8.3%.
In May 1998, the unemployment rate was 8.3%.
In June 1998, the unemployment rate was 8.4%.
In July 1998, the unemployment rate was 8.3%.
In August 1998, the unemployment rate was 8.1%.
In September 1998, the unemployment rate was 8.2%.
In October 1998, the unemployment rate was 8.0%.
In November 1998, the unemployment rate was 8.0%.
In December 1998, the unemployment rate was 8.1%.
In January 1999, the unemployment rate was 7.9%.
In February 1999, the unemployment rate was 7.9%.
In March 1999, the unemployment rate was 7.9%.
In April 1999, the unemployment rate was 8.2%.
In May 1999, the unemployment rate was 7.9%.
In June 1999, the unemployment rate was 7.6%.
In July 1999, the unemployment rate was 7.6%.
In August 1999, the unemployment rate was 7.4%.
In September 1999, the unemployment rate was 7.5%.
In October 1999, the unemployment rate was 7.2%.
In November 1999, the unemployment rate was 6.9%.
In December 1999, the unemployment rate was 6.8%.
In January 2000, the unemployment rate was 6.8%.
In February 2000, the unemployment rate was 6.9%.
In March 2000, the unemployment rate was 6.9%.
In April 2000, the unemployment rate was 6.7%.
In May 2000, the unemployment rate was 6.6%.
In June 2000, the unemployment rate was 6.7%.
In July 2000, the unemployment rate was 6.8%.
In August 2000, the unemployment rate was 7.0%.
In September 2000, the unemployment rate was 6.9%.
In October 2000, the unemployment rate was 7.0%.
In November 2000, the unemployment rate was 6.9%.
In December 2000, the unemployment rate was 6.8%.
In January 2001, the unemployment rate was 6.9%.
In February 2001, the unemployment rate was 7.0%.
In March 2001, the unemployment rate was 7.1%.
In April 2001, the unemployment rate was 7.1%.
In May 2001, the unemployment rate was 7.0%.
In June 2001, the unemployment rate was 7.2%.
In July 2001, the unemployment rate was 7.1%.
In August 2001, the unemployment rate was 7.2%.
In September 2001, the unemployment rate was 7.2%.
In October 2001, the unemployment rate was 7.3%.
In November 2001, the unemployment rate was 7.5%.
In December 2001, the unemployment rate was 8.1%.
In January 2002, the unemployment rate was 8.0%.
In February 2002, the unemployment rate was 7.9%.
In March 2002, the unemployment rate was 7.9%.
In April 2002, the unemployment rate was 7.7%.
In May 2002, the unemployment rate was 7.8%.
In June 2002, the unemployment rate was 7.6%.
In July 2002, the unemployment rate was 7.6%.
In August 2002, the unemployment rate was 7.4%.
In September 2002, the unemployment rate was 7.6%.
In October 2002, the unemployment rate was 7.6%.
In November 2002, the unemployment rate was 7.5%.
In December 2002, the unemployment rate was 7.6%.
In January 2003, the unemployment rate was 7.5%.
In February 2003, the unemployment rate was 7.5%.
In March 2003, the unemployment rate was 7.4%.
In April 2003, the unemployment rate was 7.6%.
In May 2003, the unemployment rate was 7.8%.
In June 2003, the unemployment rate was 7.6%.
In July 2003, the unemployment rate was 7.7%.
In August 2003, the unemployment rate was 7.8%.
In September 2003, the unemployment rate was 7.9%.
In October 2003, the unemployment rate was 7.6%.
In November 2003, the unemployment rate was 7.4%.
In December 2003, the unemployment rate was 7.3%.
In January 2004, the unemployment rate was 7.3%.
In February 2004, the unemployment rate was 7.3%.
In March 2004, the unemployment rate was 7.3%.
In April 2004, the unemployment rate was 7.2%.
In May 2004, the unemployment rate was 7.1%.
In June 2004, the unemployment rate was 7.2%.
In July 2004, the unemployment rate was 7.1%.
In August 2004, the unemployment rate was 7.0%.
In September 2004, the unemployment rate was 6.9%.
In October 2004, the unemployment rate was 7.1%.
In November 2004, the unemployment rate was 7.2%.
In December 2004, the unemployment rate was 7.1%.
In January 2005, the unemployment rate was 6.9%.
In February 2005, the unemployment rate was 7.0%.
In March 2005, the unemployment rate was 6.9%.
In April 2005, the unemployment rate was 6.7%.
In May 2005, the unemployment rate was 7.0%.
In June 2005, the unemployment rate was 6.8%.
In July 2005, the unemployment rate was 6.7%.
In August 2005, the unemployment rate was 6.7%.
In September 2005, the unemployment rate was 6.7%.
In October 2005, the unemployment rate was 6.7%.
In November 2005, the unemployment rate was 6.3%.
In December 2005, the unemployment rate was 6.6%.
In January 2006, the unemployment rate was 6.7%.
In February 2006, the unemployment rate was 6.6%.
In March 2006, the unemployment rate was 6.5%.
In April 2006, the unemployment rate was 6.5%.
In May 2006, the unemployment rate was 6.2%.
In June 2006, the unemployment rate was 6.3%.
In July 2006, the unemployment rate was 6.5%.
In August 2006, the unemployment rate was 6.5%.
In September 2006, the unemployment rate was 6.5%.
In October 2006, the unemployment rate was 6.3%.
In November 2006, the unemployment rate was 6.5%.
In December 2006, the unemployment rate was 6.3%.
In January 2007, the unemployment rate was 6.4%.
In February 2007, the unemployment rate was 6.3%.
In March 2007, the unemployment rate was 6.3%.
In April 2007, the unemployment rate was 6.3%.
In May 2007, the unemployment rate was 6.2%.
In June 2007, the unemployment rate was 6.1%.
In July 2007, the unemployment rate was 6.0%.
In August 2007, the unemployment rate was 6.0%.
In September 2007, the unemployment rate was 6.0%.
In October 2007, the unemployment rate was 6.0%.
In November 2007, the unemployment rate was 6.1%.
In December 2007, the unemployment rate was 6.2%.
In January 2008, the unemployment rate was 6.1%.
In February 2008, the unemployment rate was 6.1%.
In March 2008, the unemployment rate was 6.2%.
In April 2008, the unemployment rate was 6.2%.
In May 2008, the unemployment rate was 6.2%.
In June 2008, the unemployment rate was 6.1%.
In July 2008, the unemployment rate was 6.2%.
In August 2008, the unemployment rate was 6.2%.
In September 2008, the unemployment rate was 6.3%.
In October 2008, the unemployment rate was 6.4%.
In November 2008, the unemployment rate was 6.7%.
In December 2008, the unemployment rate was 7.0%.
In January 2009, the unemployment rate was 7.5%.
In February 2009, the unemployment rate was 8.1%.
In March 2009, the unemployment rate was 8.4%.
In April 2009, the unemployment rate was 8.4%.
In May 2009, the unemployment rate was 8.7%.
In June 2009, the unemployment rate was 8.8%.
In July 2009, the unemployment rate was 8.8%.
In August 2009, the unemployment rate was 8.7%.
In September 2009, the unemployment rate was 8.5%.
In October 2009, the unemployment rate was 8.6%.
In November 2009, the unemployment rate was 8.6%.
In December 2009, the unemployment rate was 8.6%.
In January 2010, the unemployment rate was 8.4%.
In February 2010, the unemployment rate was 8.4%.
In March 2010, the unemployment rate was 8.3%.
In April 2010, the unemployment rate was 8.2%.
In May 2010, the unemployment rate was 8.2%.
In June 2010, the unemployment rate was 8.0%.
In July 2010, the unemployment rate was 8.2%.
In August 2010, the unemployment rate was 8.2%.
In September 2010, the unemployment rate was 8.2%.
In October 2010, the unemployment rate was 8.1%.
In November 2010, the unemployment rate was 7.9%.
In December 2010, the unemployment rate was 7.8%.
In January 2011, the unemployment rate was 7.8%.
In February 2011, the unemployment rate was 7.8%.
In March 2011, the unemployment rate was 7.8%.
In April 2011, the unemployment rate was 7.8%.
In May 2011, the unemployment rate was 7.7%.
In June 2011, the unemployment rate was 7.7%.
In July 2011, the unemployment rate was 7.4%.
In August 2011, the unemployment rate was 7.4%.
In September 2011, the unemployment rate was 7.5%.
In October 2011, the unemployment rate was 7.5%.
In November 2011, the unemployment rate was 7.6%.
In December 2011, the unemployment rate was 7.5%.
In January 2012, the unemployment rate was 7.7%.
In February 2012, the unemployment rate was 7.6%.
In March 2012, the unemployment rate was 7.4%.
In April 2012, the unemployment rate was 7.4%.
In May 2012, the unemployment rate was 7.6%.
In June 2012, the unemployment rate was 7.4%.
In July 2012, the unemployment rate was 7.3%.
In August 2012, the unemployment rate was 7.4%.
In September 2012, the unemployment rate was 7.4%.
In October 2012, the unemployment rate was 7.4%.
In November 2012, the unemployment rate was 7.4%.
In December 2012, the unemployment rate was 7.3%.
In January 2013, the unemployment rate was 7.1%.
In February 2013, the unemployment rate was 7.1%.
In March 2013, the unemployment rate was 7.3%.
In April 2013, the unemployment rate was 7.2%.
In May 2013, the unemployment rate was 7.1%.
In June 2013, the unemployment rate was 7.2%.
In July 2013, the unemployment rate was 7.3%.
In August 2013, the unemployment rate was 7.3%.
In September 2013, the unemployment rate was 7.1%.
In October 2013, the unemployment rate was 7.3%.
In November 2013, the unemployment rate was 7.1%.
In December 2013, the unemployment rate was 7.4%.
In January 2014, the unemployment rate was 7.3%.
In February 2014, the unemployment rate was 7.3%.
In March 2014, the unemployment rate was 7.1%.
In April 2014, the unemployment rate was 7.1%.
In May 2014, the unemployment rate was 7.3%.
In June 2014, the unemployment rate was 7.2%.
In July 2014, the unemployment rate was 7.1%.
In August 2014, the unemployment rate was 7.0%.
In September 2014, the unemployment rate was 7.0%.
In October 2014, the unemployment rate was 6.8%.
In November 2014, the unemployment rate was 6.8%.
In December 2014, the unemployment rate was 6.7%.
In January 2015, the unemployment rate was 6.8%.
In February 2015, the unemployment rate was 6.9%.
In March 2015, the unemployment rate was 6.9%.
In April 2015, the unemployment rate was 7.0%.
In May 2015, the unemployment rate was 6.9%.
In June 2015, the unemployment rate was 6.9%.
In July 2015, the unemployment rate was 7.0%.
In August 2015, the unemployment rate was 7.1%.
In September 2015, the unemployment rate was 7.1%.
In October 2015, the unemployment rate was 7.0%.
In November 2015, the unemployment rate was 7.1%.
In December 2015, the unemployment rate was 7.3%.
In January 2016, the unemployment rate was 7.2%.
In February 2016, the unemployment rate was 7.3%.
In March 2016, the unemployment rate was 7.2%.
In April 2016, the unemployment rate was 7.3%.
In May 2016, the unemployment rate was 7.1%.
In June 2016, the unemployment rate was 7.0%.
In July 2016, the unemployment rate was 7.0%.
In August 2016, the unemployment rate was 6.9%.
In September 2016, the unemployment rate was 7.0%.
In October 2016, the unemployment rate was 6.9%.
In November 2016, the unemployment rate was 6.8%.
In December 2016, the unemployment rate was 6.9%.
In January 2017, the unemployment rate was 6.9%.
In February 2017, the unemployment rate was 6.6%.
In March 2017, the unemployment rate was 6.7%.
In April 2017, the unemployment rate was 6.5%.
In May 2017, the unemployment rate was 6.6%.
In June 2017, the unemployment rate was 6.5%.
In July 2017, the unemployment rate was 6.3%.
In August 2017, the unemployment rate was 6.2%.
In September 2017, the unemployment rate was 6.2%.
In October 2017, the unemployment rate was 6.3%.
In November 2017, the unemployment rate was 6.2%.
In December 2017, the unemployment rate was 6.0%.
In January 2018, the unemployment rate was 5.9%.
In February 2018, the unemployment rate was 6.0%.
In March 2018, the unemployment rate was 5.8%.
In April 2018, the unemployment rate was 5.8%.
In May 2018, the unemployment rate was 5.9%.
In June 2018, the unemployment rate was 6.0%.
In July 2018, the unemployment rate was 5.9%.
In August 2018, the unemployment rate was 6.0%.
In September 2018, the unemployment rate was 5.8%.
In October 2018, the unemployment rate was 5.6%.
In November 2018, the unemployment rate was 5.7%.
In December 2018, the unemployment rate was 5.6%.
In January 2019, the unemployment rate was 5.7%.
In February 2019, the unemployment rate was 5.8%.
In March 2019, the unemployment rate was 5.8%.
In April 2019, the unemployment rate was 5.7%.
In May 2019, the unemployment rate was 5.5%.
In June 2019, the unemployment rate was 5.6%.
In July 2019, the unemployment rate was 5.7%.
In August 2019, the unemployment rate was 5.7%.
In September 2019, the unemployment rate was 5.6%.
In October 2019, the unemployment rate was 5.6%.
In November 2019, the unemployment rate was 5.9%.
In December 2019, the unemployment rate was 5.6%.
In January 2020, the unemployment rate was 5.5%.
In February 2020, the unemployment rate was 5.8%.
In March 2020, the unemployment rate was 8.5%.
In April 2020, the unemployment rate was 13.7%.
In May 2020, the unemployment rate was 14.2%.
In June 2020, the unemployment rate was 12.6%.
In July 2020, the unemployment rate was 10.9%.
In August 2020, the unemployment rate was 10.1%.
In September 2020, the unemployment rate was 9.1%.
In October 2020, the unemployment rate was 9.0%.
In November 2020, the unemployment rate was 8.6%.
In December 2020, the unemployment rate was 8.9%.
In January 2021, the unemployment rate was 9.2%.
In February 2021, the unemployment rate was 8.5%.
In March 2021, the unemployment rate was 7.7%.
In April 2021, the unemployment rate was 8.2%.
In May 2021, the unemployment rate was 8.3%.
In June 2021, the unemployment rate was 7.9%.
In July 2021, the unemployment rate was 7.4%.
In August 2021, the unemployment rate was 7.1%.
In September 2021, the unemployment rate was 7.0%.
In October 2021, the unemployment rate was 6.5%.
In November 2021, the unemployment rate was 6.1%.
In December 2021, the unemployment rate was 5.9%.
In January 2022, the unemployment rate was 6.4%.
In February 2022, the unemployment rate was 5.5%.
In March 2022, the unemployment rate was 5.4%.
In April 2022, the unemployment rate was 5.4%.
In May 2022, the unemployment rate was 5.2%.
In June 2022, the unemployment rate was 4.9%.
In July 2022, the unemployment rate was 4.8%.
In August 2022, the unemployment rate was 5.2%.
In September 2022, the unemployment rate was 5.1%.
In October 2022, the unemployment rate was 5.1%.
In November 2022, the unemployment rate was 5.0%.
In December 2022, the unemployment rate was 5.0%.
In January 2023, the unemployment rate was 5.1%.
In February 2023, the unemployment rate was 5.2%.
In March 2023, the unemployment rate was 5.1%.
In April 2023, the unemployment rate was 5.1%.
In May 2023, the unemployment rate was 5.2%.
In June 2023, the unemployment rate was 5.4%.
In July 2023, the unemployment rate was 5.4%.
In August 2023, the unemployment rate was 5.4%.
In September 2023, the unemployment rate was 5.5%.
In October 2023, the unemployment rate was 5.7%.
In November 2023, the unemployment rate was 5.8%.
In December 2023, the unemployment rate was 5.8%.
In January 2024, the unemployment rate was 5.7%.
In February 2024, the unemployment rate was 5.9%.
In March 2024, the unemployment rate was 6.1%.
In April 2024, the unemployment rate was 6.2%.
In May 2024, the unemployment rate was 6.3%.
In June 2024, the unemployment rate was 6.4%.
In July 2024, the unemployment rate was 6.4%.
In August 2024, the unemployment rate was 6.6%.
In September 2024, the unemployment rate was 6.5%.
In October 2024, the unemployment rate was 6.6%.
In November 2024, the unemployment rate was 7.0%.
In December 2024, the unemployment rate was 6.7%.
In January 2025, the unemployment rate was 6.7%.
In February 2025, the unemployment rate was 6.6%.
In March 2025, the unemployment rate was 6.8%.
In April 2025, the unemployment rate was 6.9%.
In May 2025, the unemployment rate was 7.0%.
In June 2025, the unemployment rate was 6.9%.
In July 2025, the unemployment rate was 6.9%.
In August 2025, the unemployment rate was 7.1%.
In September 2025, the unemployment rate was 7.1%.
In October 2025, the unemployment rate was 6.9%.
In November 2025, the unemployment rate was 6.6%.
In December 2025, the unemployment rate was 6.8%.
In January 2026, the unemployment rate was 6.5%.
In February 2026, the unemployment rate was 6.7%.
In March 2026, the unemployment rate was 6.7%.
Source(s): Table 14-10-0287-01.
Women’s participation rate increases over time, while wage gap narrows
Since 1976, one of the most significant changes in Canada’s labour market has been the growing number of women entering the workforce, supported by progress such as paid maternity leave and stronger legal protections against discrimination. In 1976, just over half (52.3%) of core-aged (25 to 54 years) women were in the labour force, compared with 94.5% of men.
By 2025, 85.0% of core-aged women were in the labour force, compared with 91.9% of men, with most of the increase among women taking place from 1976 to 1991.
The wage gap has narrowed over time as well. Core-aged women earned 89 cents for every dollar earned by men in 2025, up from 81 cents in 1997.
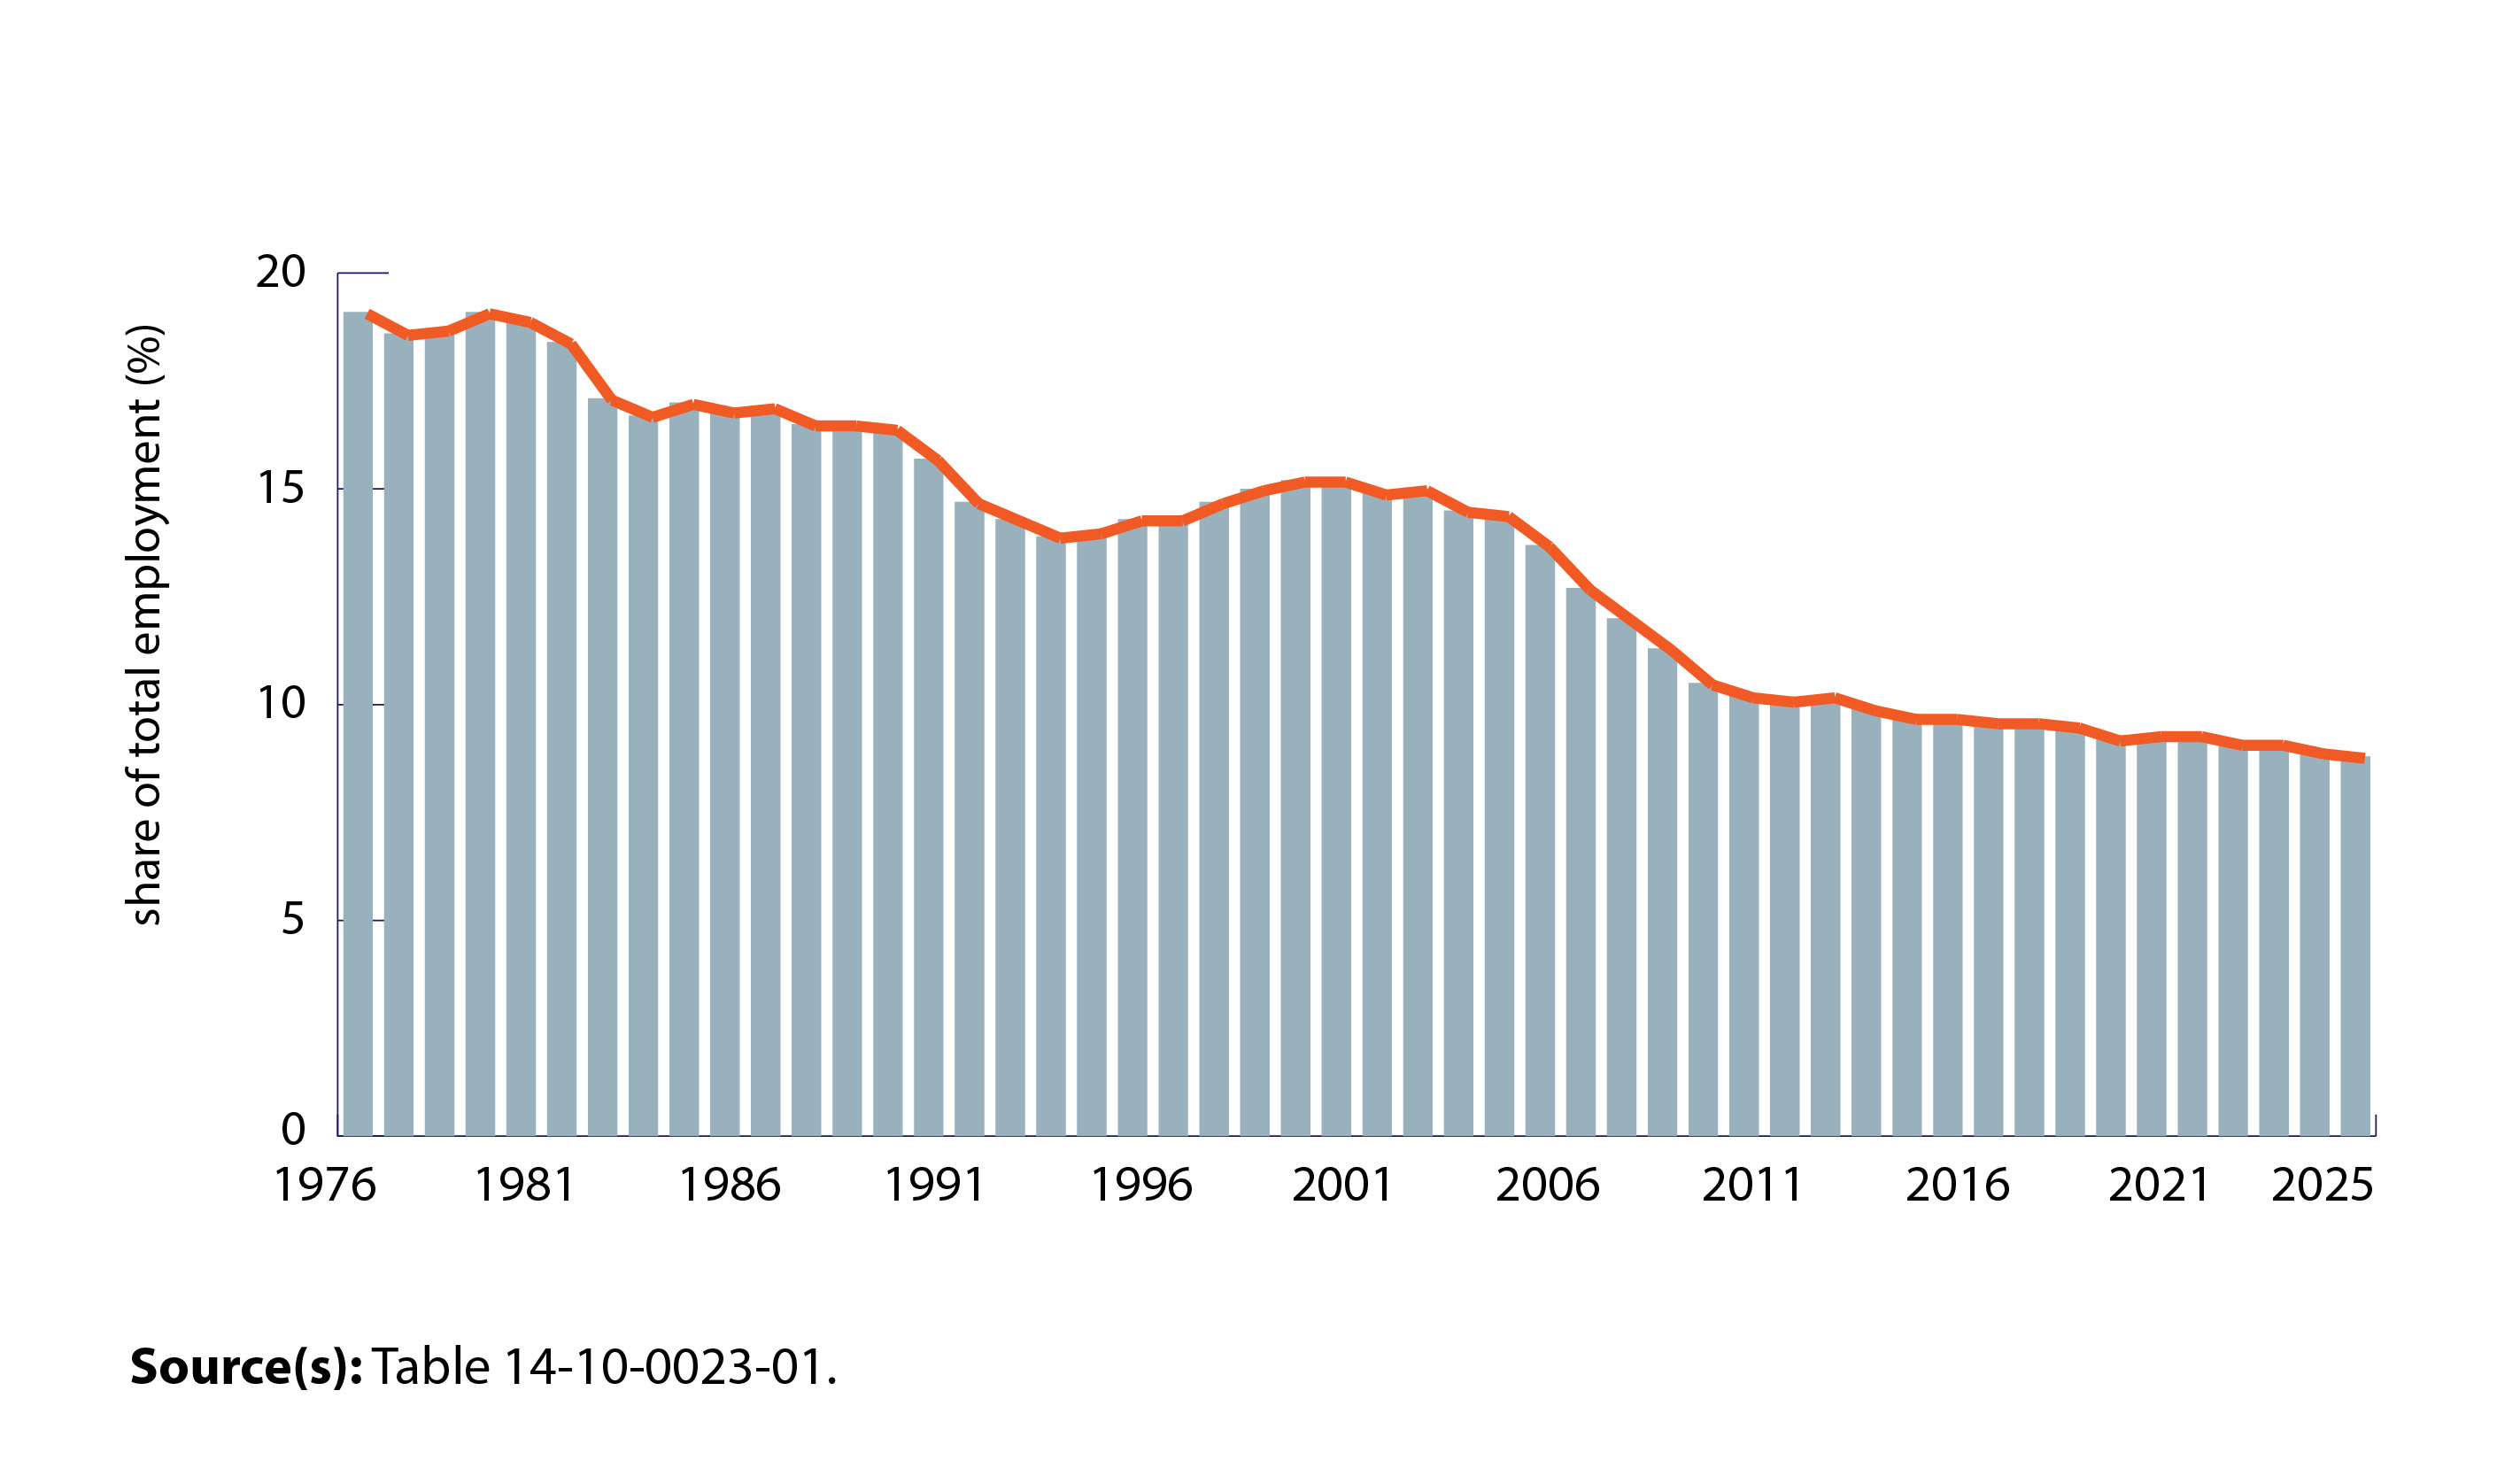
Changing nature of the workforce
In 1976, over one-third (34.6%) of all employment was in the goods-producing sector, and manufacturing was the most common industry for Canadians to work in, representing nearly one-fifth (19.1%) of all employment.
With increasing automation and a shift to a more service-oriented economy, one in five employed Canadians (20.0%) worked in the goods-producing sector in 2025. More Canadians worked in industries like healthcare and social assistance as well as professional, scientific, and technical services, while manufacturing’s share of total employment was 8.8%, down sharply from 1976.
Chart 2: Manufacturing as a share of total employment
Description - Chart 2: Manufacturing as a share of total employment
The title of this chart is ‘Manufacturing as a share of total employment.
This is a line chart.
The horizontal axis shows the years from 1976 to 2025 in chronological order.
The vertical axis represents manufacturing as a share of total employment.
The vertical axis goes from 0% to 20%, in increments of 5%.
In 1976, manufacturing represented 19.1% of total employment.
In 1977, manufacturing represented 18.6% of total employment.
In 1978, manufacturing represented 18.7% of total employment.
In 1979, manufacturing represented 19.1% of total employment.
In 1980, manufacturing represented 18.9% of total employment.
In 1981, manufacturing represented 18.4% of total employment.
In 1982, manufacturing represented 17.1% of total employment.
In 1983, manufacturing represented 16.7% of total employment.
In 1984, manufacturing represented 17.0% of total employment.
In 1985, manufacturing represented 16.8% of total employment.
In 1986, manufacturing represented 16.9% of total employment.
In 1987, manufacturing represented 16.5% of total employment.
In 1988, manufacturing represented 16.5% of total employment.
In 1989, manufacturing represented 16.4% of total employment.
In 1990, manufacturing represented 15.7% of total employment.
In 1991, manufacturing represented 14.7% of total employment.
In 1992, manufacturing represented 14.3% of total employment.
In 1993, manufacturing represented 13.9% of total employment.
In 1994, manufacturing represented 14.0% of total employment.
In 1995, manufacturing represented 14.3% of total employment.
In 1996, manufacturing represented 14.3% of total employment.
In 1997, manufacturing represented 14.7% of total employment.
In 1998, manufacturing represented 15.0% of total employment.
In 1999, manufacturing represented 15.2% of total employment.
In 2000, manufacturing represented 15.2% of total employment.
In 2001, manufacturing represented 14.9% of total employment.
In 2002, manufacturing represented 15.0% of total employment.
In 2003, manufacturing represented 14.5% of total employment.
In 2004, manufacturing represented 14.4% of total employment.
In 2005, manufacturing represented 13.7% of total employment.
In 2006, manufacturing represented 12.7% of total employment.
In 2007, manufacturing represented 12.0% of total employment.
In 2008, manufacturing represented 11.3% of total employment.
In 2009, manufacturing represented 10.5% of total employment.
In 2010, manufacturing represented 10.2% of total employment.
In 2011, manufacturing represented 10.1% of total employment.
In 2012, manufacturing represented 10.2% of total employment.
In 2013, manufacturing represented 9.9% of total employment.
In 2014, manufacturing represented 9.7% of total employment.
In 2015, manufacturing represented 9.7% of total employment.
In 2016, manufacturing represented 9.6% of total employment.
In 2017, manufacturing represented 9.6% of total employment.
In 2018, manufacturing represented 9.5% of total employment.
In 2019, manufacturing represented 9.2% of total employment.
In 2020, manufacturing represented 9.3% of total employment.
In 2021, manufacturing represented 9.3% of total employment.
In 2022, manufacturing represented 9.1% of total employment.
In 2023, manufacturing represented 9.1% of total employment.
In 2024, manufacturing represented 8.9% of total employment.
In 2025, manufacturing represented 8.8% of total employment.
Source(s): Table 14-10-0023-01.
Working students
For the past 50 years, students have often faced challenges finding summer employment. Amid a recession, the unemployment rate for returning students was 17.9% in the summer of 1983 (May to August average). It would take until 1989 before that rate gradually dropped to a historic low of 9.4%.
The trend reversed, and in the summer of 1997, almost one in five students (19.6%) were unemployed. This is the record high outside of summer 2020, during the pandemic, when almost one in three students (32.0%) were unemployed.
Two years later, against the backdrop of nearly 1 million job vacancies, the unemployment rate for returning students dropped to its second lowest on record, at 10.5% in the summer of 2022.
More recently, as vacancies dwindled amid a tighter labour market, the rate increased for the third year in a row, reaching 18.0% in the summer of 2025.

Contact information
For more information, contact the Statistical Information Service (toll-free 1-800-263-1136; 514-283-8300; infostats@statcan.gc.ca) or Media Relations (statcan.mediahotline-ligneinfomedias.statcan@statcan.gc.ca).