
Population

Archived Content
Information identified as archived is provided for reference, research or recordkeeping purposes. It is not subject to the Government of Canada Web Standards and has not been altered or updated since it was archived. Please "contact us" to request a format other than those available.
Tables
- Table 1 Population
- Table 2 Components of population growth
- Table 3 Population projection, by visible minority group
- Table 4 Population of census metropolitan areas
Charts
- Chart 1 Population growth
- Chart 2 Immigrants who landed from 2001 to 2006, by region of origin
- Chart 3 Visible minority population
- Chart 4 Population growth by Aboriginal identity, 1996 to 2006
View tables
| 1996 | 2006 | 2011p | |
|---|---|---|---|
| number | |||
| Canada | 29,610,218 | 32,576,074 | 34,482,779 |
| Newfoundland and Labrador | 559,698 | 510,313 | 510,578 |
| Prince Edward Island | 135,737 | 137,920 | 145,855 |
| Nova Scotia | 931,327 | 938,010 | 945,437 |
| New Brunswick | 752,268 | 745,674 | 755,455 |
| Quebec | 7,246,897 | 7,631,552 | 7,979,663 |
| Ontario | 11,082,903 | 12,665,346 | 13,372,996 |
| Manitoba | 1,134,196 | 1,184,031 | 1,250,574 |
| Saskatchewan | 1,018,945 | 992,122 | 1,057,884 |
| Alberta | 2,775,133 | 3,421,253 | 3,779,353 |
| British Columbia | 3,874,317 | 4,243,580 | 4,573,321 |
| Yukon | 31,387 | 32,276 | 34,666 |
| Northwest Territories | 41,741 | 43,198 | 43,675 |
| Nunavut | 25,669 | 30,799 | 33,322 |
| p preliminary | |||
| Note: Population estimates as of July 1. | |||
| Source: Statistics Canada, CANSIM table 051-0005. | |||
| 1990/1991 | 2000/2001 | 2010/2011p | |
|---|---|---|---|
| number | |||
| Births | 402,929 | 327,107 | 386,013 |
| Deaths | 192,439 | 219,114 | 252,561 |
| Immigrants | 221,382 | 252,527 | 258,906 |
| Emigrants | 43,692 | 47,766 | 52,456 |
| Returning emigrants | 15,208 | 17,910 | 25,364 |
| Net temporary emigrants | .. | 25,563 | 20,163 |
| Net non-permanent residents | -52,853 | 39,592 | 11,495 |
| p preliminary | |||
| .. not available for a specific reference period | |||
| Note: All figures are for the one-year period ending June 30. | |||
| Source: Statistics Canada, CANSIM table 051-0004. | |||
| 2006 | 20311 | |||
|---|---|---|---|---|
| thousands | % | thousands | % | |
| Total population | 32,522 | 100.0 | 42,078 | 100.0 |
| All visible minorities | 5,285 | 16.3 | 12,855 | 30.6 |
| Chinese | 1,269 | 3.9 | 2,714 | 6.4 |
| South Asian | 1,320 | 4.1 | 3,640 | 8.7 |
| Black | 815 | 2.5 | 1,809 | 4.3 |
| Filipino | 427 | 1.3 | 1,020 | 2.4 |
| Latin American | 317 | 1.0 | 733 | 1.7 |
| Southeast Asian | 250 | 0.8 | 449 | 1.1 |
| Arab | 276 | 0.8 | 930 | 2.2 |
| West Asian | 164 | 0.5 | 523 | 1.2 |
| Korean | 148 | 0.5 | 407 | 1.0 |
| Japanese | 85 | 0.3 | 142 | 0.3 |
| Other visible minorities | 213 | 0.7 | 489 | 1.2 |
| Rest of the population | 27,237 | 83.7 | 29,222 | 69.4 |
| 1. Reference scenario, based on current demographic trends. | ||||
| Source: Statistics Canada, Catalogue no. 91-551-X. | ||||
| 2000 | 2005 | 2010p | |
|---|---|---|---|
| number | |||
| St. John's | 181,006 | 183,263 | 192,326 |
| Halifax | 365,947 | 381,853 | 403,188 |
| Moncton | 121,662 | 128,324 | 137,346 |
| Saint John | 126,662 | 125,489 | 127,973 |
| Saguenay | 158,641 | 152,991 | 152,150 |
| Québec | 697,027 | 718,419 | 754,358 |
| Sherbrooke | 177,830 | 187,205 | 197,299 |
| Trois-Rivières | 141,481 | 141,765 | 146,516 |
| Montréal | 3,500,249 | 3,655,782 | 3,859,318 |
| Ottawa–Gatineau | 1,083,241 | 1,157,925 | 1,239,140 |
| Kingston | 151,303 | 157,913 | 162,543 |
| Peterborough | 113,813 | 119,918 | 121,054 |
| Oshawa | 304,414 | 337,747 | 364,193 |
| Toronto | 4,764,739 | 5,250,038 | 5,741,419 |
| Hamilton | 667,050 | 713,527 | 740,238 |
| St. Catharines–Niagara | 388,097 | 402,533 | 404,357 |
| Kitchener–Cambridge–Waterloo | 423,272 | 463,494 | 492,390 |
| Brantford | 127,037 | 134,370 | 139,124 |
| Guelph | 121,337 | 130,962 | 138,158 |
| London | 450,871 | 472,471 | 492,249 |
| Windsor | 312,410 | 335,395 | 330,856 |
| Barrie | 160,497 | 181,223 | 190,872 |
| Greater Sudbury | 162,091 | 162,997 | 164,680 |
| Thunder Bay | 130,115 | 128,283 | 126,683 |
| Winnipeg | 692,480 | 713,101 | 753,555 |
| Regina | 199,069 | 199,593 | 215,138 |
| Saskatoon | 232,597 | 238,640 | 265,259 |
| Calgary | 950,128 | 1,087,742 | 1,242,624 |
| Edmonton | 949,819 | 1,042,464 | 1,176,307 |
| Kelowna | 152,125 | 163,612 | 178,854 |
| Abbotsford–Mission | 151,662 | 161,824 | 174,300 |
| Vancouver | 2,040,832 | 2,160,228 | 2,391,252 |
| Victoria | 321,277 | 336,816 | 358,054 |
| p preliminary | |||
| Note: Population estimates as of July 1. | |||
| Source: Statistics Canada, CANSIM table 051-0046. | |||
View charts
Chart 1 Population growth
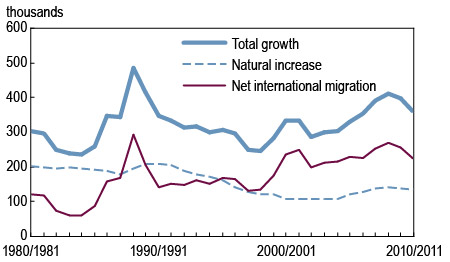
Source: Statistics Canada, CANSIM table 051-0004.
Chart 2 Immigrants who landed from 2001 to 2006, by region of origin
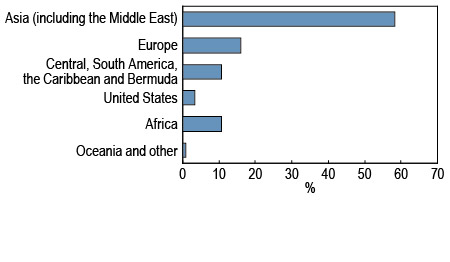
Notes: Includes immigrants who landed in Canada prior to Census Day, May 16, 2006.
'Other' includes Greenland, Saint Pierre and Miquelon, the category 'other country,' as well as
a small number of immigrants born in Canada.
Source: Statistics Canada, 2006 Census of Population.
Chart 3 Visible minority population
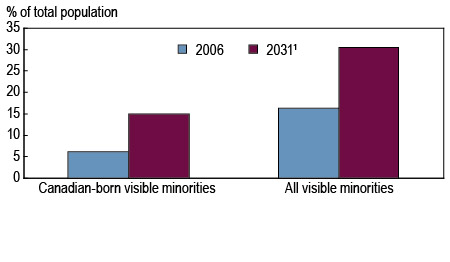
1. Reference scenario, based on current demographic trends.
Source: Statistics Canada, Catalogue no. 91-551-X.
Chart 4 Population growth by Aboriginal identity, 1996 to 2006
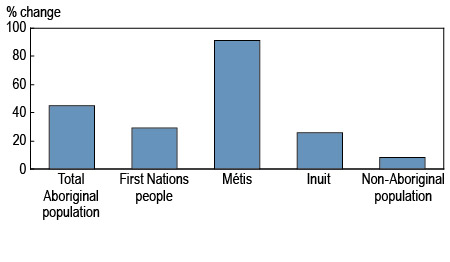
Source: Statistics Canada, Catalogue no. 89-645-X.
- Date modified: