
Publications
Income and Expenditure Accounts Technical Series
Purchasing Power Parities and Real Expenditures, United States and Canada, 2002 to 2009
Context

Archived Content
Information identified as archived is provided for reference, research or recordkeeping purposes. It is not subject to the Government of Canada Web Standards and has not been altered or updated since it was archived. Please "contact us" to request a format other than those available.
What are Purchasing Power Parities (PPPs)?
In its simplest form, a PPP is a ratio of the price of a good or service in one country in the national currency relative to the price of the same item in another country expressed in its currency. In other words, it represents a currency conversion rate that would equalize the purchasing power of the two currencies for the commodity in question. For example, a PPP of 0.90 signifies that 90 cents U.S. purchases the same quantity of the specified good or service as $1 Canadian; thus the U.S. dollar has greater purchasing power than its Canadian counterpart.
Purchasing power parity is said to exist between two countries if the ratio of prices in one country relative to the other equals the exchange rate. Where differences exist, theory suggests that it would be advantageous to exchange currencies and buy a commodity from the cheaper source. In practice, this theory is valid only for tradable goods and services.
Having precise specifications of a commodity is very important in ensuring that the same commodity is, in fact, priced in both countries. Comparing the price of a luxury automobile in one country with an economy car in another would reveal very little about the relative price levels for automobiles in the two countries. On the other hand, comparing prices of the exact same make and model with the same characteristics, such as engine size, with air conditioning, automatic transmission, CD player, etc., tells us much more.
Another important condition in deriving PPPs is that the commodities being priced should be representative of the goods and services actually bought and sold in the marketplace. In other words, enough units of the product should be sold so that its price is considered typical for that category of expenditure.
The detailed price ratios (or price relatives) are combined to produce more aggregated statistics by weighting each detailed component by the final expenditure on that item in a particular year. For example, a PPP for consumer purchases of vehicles is calculated by first taking an average of price relatives for many different automobiles models and combining that statistic with price relatives for both motorcycles and bicycles. A PPP for total expenditure on vehicles is obtained by weighting each of the PPPs for the three components (automobiles, motorcycles, bicycles) by their respective expenditures. In this way, price relationships are built up from a very detailed level to increasingly aggregated statistics, eventually arriving at PPPs for individual expenditure on transport, individual consumption expenditure of households and, ultimately, gross domestic product (GDP).1
The PPPs and related data are presented on two different bases: expenditure and consumption. This is because comparison of the usual expenditure-based aggregates can be misleading, insofar as there are varying levels of state involvement in financing consumption. Accordingly, data are also presented in terms of the consumer, rather than the purchaser. Estimates of actual individual consumption are obtained by adding government expenditure on goods and services to be consumed by individuals to purchases made by individuals. Health and education are prime examples of services where the government sector plays a bigger role in Canada than in the United States. Along with housing, recreation and culture and social protection, these are services often paid for by the government sector, but actually consumed by individuals. The remaining expenditure by the government sector represents collective consumption, which includes spending on defence, the environment, infrastructure maintenance, etc.
The PPP detail are presented in the data tables as components of GDP. They are indicators of relative prices but can also be used as income deflators. Real income represents the ability to purchase goods and services. Changes in real income thus lead to changes in real consumption. Other statistics in this report include ratios of real expenditure per capita, comparative price levels and the relative shares of various components of GDP in terms of real and current expenditure per capita. Comparative price levels are the ratios of PPPs to exchange rates, and are calculated for each final demand category and GDP itself. A value above/below 100 indicates a higher/lower price level for a country relative to a reference country.2
Why are PPPs important?
The fact that purchasing power differences exist makes PPPs increasingly relevant. Studies of countries' relative economic size in nominal terms, converted from one currency to another using the exchange rate, for instance, do not fully allow for differences in price levels between countries. For example, comparing the nominal per capita GDP of Canada with that of a developing nation would likely not be a valid comparison in that prices tend to be lower in developing countries. With a lower price level, demand for the same good can be satisfied by spending less. Consequently, an exchange rate-adjusted GDP does not provide an accurate indicator of the relative size of the two economies.
Even neighbouring countries sharing a similar economic structure, such as the United States and Canada, have price level differences that are not fully explained by the exchange rate. This is because the market exchange rate is based on more than prices of traded goods and services. International financial flows, for instance, play a major role in establishing a currency's level.
A PPP which differs from the market exchange rate therefore, does not mean one country's currency is over- or undervalued relative to another. Exchange rates can be volatile, and their use in converting output to a common currency can translate into unrealistic variations in that income or output.
For these reasons, PPPs are more appropriate for use in cross-country economic comparisons. By converting expenditure data to a common currency and a common set of prices, the resulting relative volumes of goods and services invested in or consumed can be more readily and reliably compared.3
Sources of data
Much of the price data used in this report are collected regularly by member countries as part of the Eurostat-OECDPPP Programme. Benchmark estimates are made every three years for this multilateral exercise. A list of over 3000 commodity specifications is established for which countries are asked to provide as much price information as possible. Many of the specifications are somewhat generic in nature, as exact matches can be difficult to find across all countries.
Whereas the Eurostat-OECDPPP Programme uses hourly compensation data for forty-six different types of government sector occupations to estimate prices for government goods and services, the U.S./Canada Bilateral PPP is based on more aggregated hourly compensation estimates for the health, education, and other components of the government sector from the national accounts of both countries. Both are input-cost approaches, due to the fact that government goods and services are not sold on the market.
Where data for certain spending categories are typically not available, PPP studies rely on "reference" pricing. For example, PPPs for individual expenditure on rents can be used as proxies for government expenditure on housing. Other cases of reference pricing are PPPs for net exports, inventory change, personal expenditure on games of chance and government expenditure on social protection. For example, the combined PPP for consumer goods and investment in machinery and equipment is used as a proxy for that of inventory change. Commodities for which prices are occasionally unavailable are estimated using the movements of an appropriate price index.
Annual data on current dollar expenditure from the Canadian System of National Accounts and the U.S. National Income and Product Accounts serve as weights to derive aggregate PPPs. Corresponding price information is used to extrapolate PPPs from benchmark years.
Data quality
As noted above, this study relies on much of the Canadian and U.S. data from the Eurostat-OECD multilateral programme but, as it involves only two countries, is more effective at using only prices relevant for North America. Goods and services which might be considered Euro-centric, such as diesel-powered automobiles are not included. Also, with only two countries on which to focus, more detailed confrontation between data made available to the OECD and those published by the two countries, as well as more detailed methodologies, are feasible.
Data on prices of commodities purchased by consumers tend to be of good quality as these are often taken from the Consumer Price Index databases in both countries, where coverage is broad and products are well-defined and easily understood. Rents, however, tend to be problematic, as ensuring that the quality of the product is the same in both countries is difficult to achieve.
While hourly compensation data derived for various components of the government sector are considered to be of good quality, they do not account for productivity changes and so do not always capture pure price change.
The weakest component of the PPP exercise is undoubtedly the pricing of capital goods. The wide range of machinery and construction projects makes it difficult to ensure that identical products are being priced. For example, the price of a new dwelling will depend to a large extent on its location, i.e., land value, which is not included in the price under national accounting principles. As well, because many construction projects are unique, an input-based method is often used to estimate relative prices. For example, instead of pricing a particular project, prices are obtained for its standard elements, such as masonry work, installing plumbing or electrical work.
Software prices are of good quality as they rely on readily available pre-packaged prices for off-the-shelf products and salary rates for computer-related occupations for own-account and custom work.
Where reference prices (or proxies) are used for commodities for which no prices are available, the resulting loss in quality is not considered to be serious in terms of total GDP. Proxies are drawn from items that are as similar as possible, with the implicit assumption that the price relationship is the same.
Along with various price statistics, Canadian and U.S. expenditure data used for this report come from the national accounts of both countries. The quality of these data, and hence the PPP-related estimates, tends to improve over time as more comprehensive source data become available.
Key changes
This section explains two key changes made to the methodology; the first relating to the benchmark PPP estimate, the second to the extrapolation of this estimate.
First, in the past, U.S./Canada bilateral PPP studies used the exchange rate as a proxy for the PPP for net exports. This approach assumed that exchange rate changes are immediately and fully reflected in market prices of traded goods and services, which is not supported by empirical evidence,4 among other concerns (see Why are PPPs important?). With the new methodology, a PPP aggregate for domestic consumption and investment (i.e., final domestic demand) is now used for the trade balance in benchmark years. This is because final domestic demand prices are more appropriate for use in estimating purchasing power over items bought with the income generated through trade. This is similar to the procedure used in country comparisons for the Penn World Tables5 and is consistent with the calculation of quarterly real gross domestic income (GDI) for Canada.6
Second, in the past, the aggregate PPP was extrapolated from the benchmark year using the relative movements in the GDP implicit price indexes. In using these indexes, terms-of-trade adjustments affecting the Canadian economy in the post-benchmark years were essentially treated as price changes and thus removed from the real income measure. Estimates of PPPs are now extrapolated from the benchmark year using relative movements in the prices of goods and services available for domestic consumption and investment (i.e., final domestic demand). The result is a total economy PPP consistent with the measure of purchasing power for the benchmark year, and one that will more accurately reflect the real income effects of changes in Canada's terms of trade through time. It will also help to minimize revisions of the estimates.7
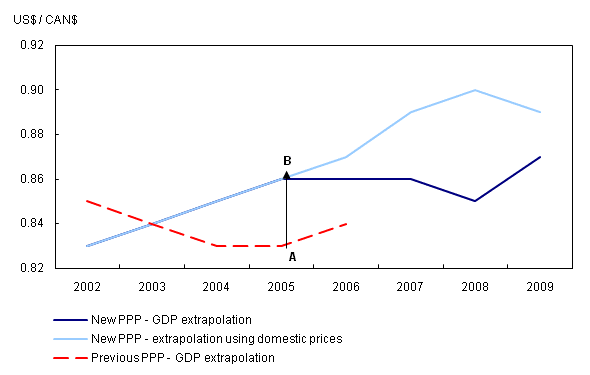
In Chart 1, below, the PPPs shown by the lower line containing point A were the result of an extrapolation from benchmark year 2002 using GDP deflators. It can be seen that the incorporation of benchmark data for 2005 resulted in a significant upward revision that shifted the overall PPP in that year from A to B. The use of GDP deflators to extrapolate from the most recent benchmark year (now 2005) would have resulted in a declining trend after 2006, with an upturn in 2009, as shown by the lower of the two lines emerging from point B. The use of final domestic demand prices to extrapolate, however, properly captures the terms-of-trade improvements in the Canadian economy through to 2008, and deterioration in 2009, as shown by the top line.
Chart 1
Alternative PPP extrapolations
Description for Chart 1
Notes
- The calculation of PPP estimates in a multilateral framework is more complicated than in a bilateral exercise. For instance, price relatives for products need to be derived for each country pairing. See OECD-Eurostat, Purchasing Power Parities and Real Expenditures, 2005 Benchmark Year, 2007, pp. 31-34 for a more complete discussion of these issues.
- Thechoice of a reference country is arbitrary, but it is usually one of the countries under study. In the present study, Canada is the reference country so data for Canada are in the denominator.
- The System of National Accounts 1993 recommends the publication of Geary-Khamis statistics which have the advantage of additivity. These would allow for structural analysis involving ratios and shares of components relative to aggregates. Their feasibility and suitability for use in the U.S./Canada Bilateral PPP Program will be examined in a future update. See System of National Accounts 1993, 16.78-16.104 for further discussion.
- Baldwin, J.R. and B. Yan. 2004. The Law of One Price: A Canada-U.S. Exploration. Review of Income and Wealth, 50, 1: 1-10.
- See Deaton, Angus and Heston, Allan. 2008. Understanding PPPs and PPP-Based National Accounts. Cambridge, MA; National Bureau of Economic Research, Working Paper 14499.
- CANSIM Table 380-0062.
- See Baldwin, John and Macdonald, Ryan, 2009. PPPs: Purchasing Power or Producing Power Parities? Statistics Canada Catalogue 11F0027. Economic Analysis (EA) Research Paper Series, no. 58. Ottawa: Statistics Canada.
- Date modified: