
Publications
Education Indicators in Canada: Fact Sheets
Career Decision-making Patterns of Canadian Youth and Associated Postsecondary Educational Outcomes
Education Indicators in Canada: Fact Sheet

Archived Content
Information identified as archived is provided for reference, research or recordkeeping purposes. It is not subject to the Government of Canada Web Standards and has not been altered or updated since it was archived. Please "contact us" to request a format other than those available.
Career Decision-making Patterns of Canadian Youth and Associated Postsecondary Educational Outcomes
January 2015
The skills youth acquire at the end of their formal education are partly a reflection of the career plans and accompanying program choices they have made throughout their education. Whether these choices best meet Canadian labour market requirements has been the subject of considerable discussion and policy development over the past decade. The ability to influence the career planning choices of youth requires an understanding of how these choices are made and what factors influence the decision-making process.
This fact sheet offers a brief examination of this topic. The analyses looked at the age at which Canadian youth begin to demonstrate consistency in their career decisions, and examined factors that may contribute to earlier or later consistency in career decision-making. It also compared the link between the educational outcomes of youth and the ages at which they demonstrated consistent career expectations between 15 and 25 years of age, to assess educational differences between those who showed consistency in their career decisions earlier, later, or not at all. While changes in the specific career expectations of youth are expected as they progress through adolescence, the concept of “consistency in expectations” can differentiate between individuals who are in the process of refining and progressing towards an identified career, compared to individuals who are reporting unrelated and varying career expectations.
This fact sheet is based on longitudinal data from cycles 1 through 6 (2000 to 2010) of Statistics Canada’s Youth in Transition Survey (YITS). The data were collected every two years, from the same respondents starting at age 15 (YITS Cohort A, cycle 1). These youth were asked, “What kind of job or occupation would you be interested in having when you are about 30 years old?” They were asked the same question at ages 17, 21, 23 and 25 (cycles 2, 4, 5 and 6, respectively). The question was not asked at age 19 (cycle 3).
Responses to the career expectations question were classified using the National Occupation Classification (NOC) 2001 codes at the two-digit level, and were regrouped according to their occupational group and educational requirement. Responses were then compared across cycles to determine at which age career decisions matched in occupational group and educational requirement with all later responses (see “Career expectations and consistency”).
Career expectations and consistency
Analytical categories were defined based on the ages at which young adults' career expectations began to be "consistent�; that is, their responses indicated the same occupational group and required level of education from one cycle to the next until end of the survey, when they were 25 years old. Thus the definition of "consistency� used for this analysis captures continuity of decision-making and does not capture individuals who may have had the same career expectations at different points, but changed their mind in between.
The "consistent from age 15� category groups together youth who demonstrated consistency in their career expectations across all five cycles of YITS in which the career expectations question was asked. "Consistent from age 17� includes those who demonstrated consistency across the last four of the five cycles for which responses are available. Following the same method, when consistency in occupational group and educational requirement was seen across the last three cycles, youth were considered "consistent from age 21�; and over the final two cycles, "consistent from age 23�.
If respondents did not demonstrate any such consistency before the age of 25, they were grouped based on whether they stated a new career decision at 25, or if they remained undecided in their career decision at 25. The "new decision at 25� reflects a response in cycle 6 that was inconsistent with the response in cycle 5 and was other than "undecided�. The remaining category, "undecided at age 25�, captures those youth who had not stated a career decision at the age of 25.
Career decision-making – early or late?
For the majority of young adults, the process of identifying and narrowing career expectations lasts beyond adolescence and well into adulthood.
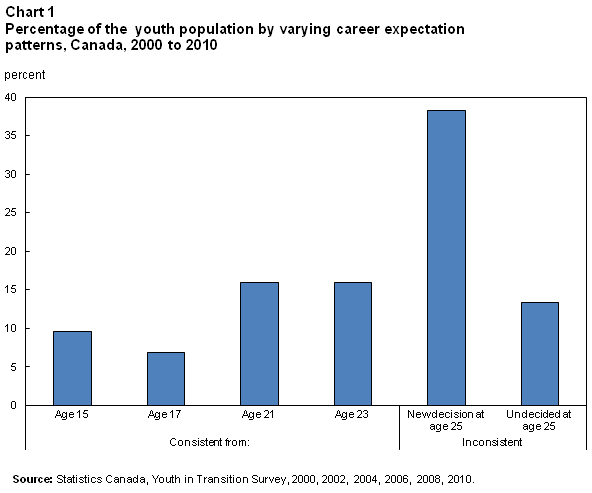
Comparing career expectation responses from age 15 indicated that about 1 in 10 (9.6%) of the same young adults who were followed across all of the YITS cycles indicated the same career choice in each cycle, revealing a decision at age 25 that still matched the one they had held at age 15 (Chart 1). An additional 6.9% of the YITS cohort demonstrated consistency in career expectations from age 17 on, when many students would still be exploring their career options. About the same proportion of youth demonstrated consistency in their career expectations from age 21 (15.9%) and from age 23 (16.0%). By contrast, the remaining youth were either undecided about a career at age 25 (13.3%), or had decided on a new career (38.3%).
Since YITS respondents aged as the survey progressed, there would have been fewer opportunities for their responses to be considered “inconsistent” because there were fewer data collection points to change their minds. At the same time, by their 20s, these young adults would likely have had some exposure to postsecondary studies and/or the labour market, contributing to more clarity in their career expectations.
Gender differences in career decision-making
Late demonstration of consistency in career decisions was typical for both males and females. However, females were slightly more inclined to demonstrate earlier consistency in their career choices than were their male counterparts. For example, 10.1% of young females were consistent in their career expectations from age 15, compared with 9.1% of their male counterparts (Chart 2).
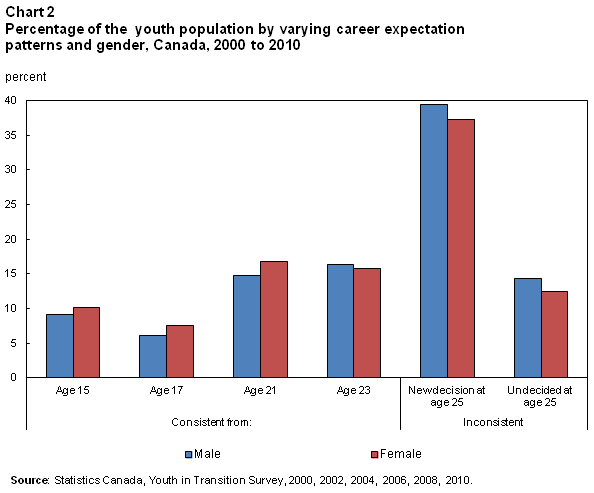
By contrast, males were more likely to make a new decision or be undecided at age 25.
The influence of parental attitudes regarding postsecondary education
The data revealed a relationship between stability in career decision-making and the value that respondent’s parents placed on their children obtaining postsecondary education (see “Parental valuation of a postsecondary education”). Youth were more likely to demonstrate consistency in their career expectations when their parents placed a high value on postsecondary education (Chart 3). Note that although this pattern was found at each age for which youth demonstrated consistency, it was only statistically significant at age 21. A significantly greater proportion of these youth (17.2%) showed consistency compared with those whose parents did not value postsecondary education highly or persistently (8.5%).
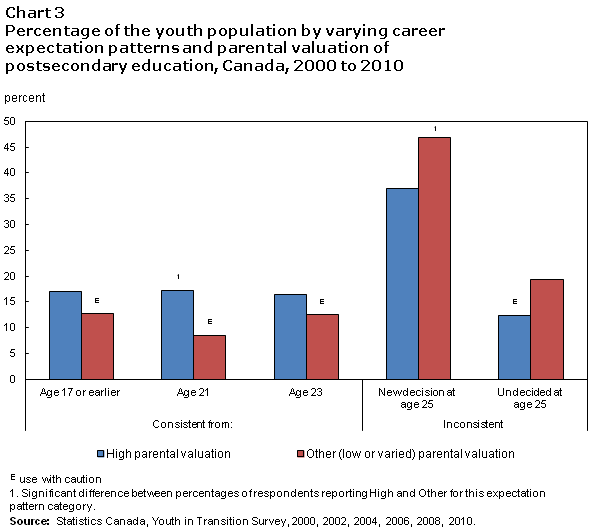
Among the young adults aged 25 whose parents placed a high value on postsecondary education, over one-third were making a new decision (36.9%) at age 25, and 12.4% were as yet undecided at that age. Although the overall figure is high (49.3%), it is significantly lower compared to those with parents whose attitudes towards postsecondary education were low or varied. Approximately two-thirds (66.2%) of these youth were either making new decisions (46.8%) or were undecided (19.4%) at age 25.
Parental valuation of a postsecondary education
At the ages of 15 and 17, YITS respondents were asked about the importance their parents placed on them pursuing a postsecondary education. Using the responses from cycles 1 and 2, a composite variable was derived that included two categories: (1) consistently high valuation (i.e., in both cycles, the respondent indicated that his or her parents gave “high” or “fairly high” importance to their child’s pursuit of a postsecondary education); (2) and all other combinations (including consistently low valuation, and varied responses).
Family socio-economic status and youth career decision-making
Overall, the data indicated that earlier demonstration of consistency in career expectations was associated with higher family socio-economic status (SES) and later demonstration of consistency in career expectations with lower SES (see “Family socio-economic status”).
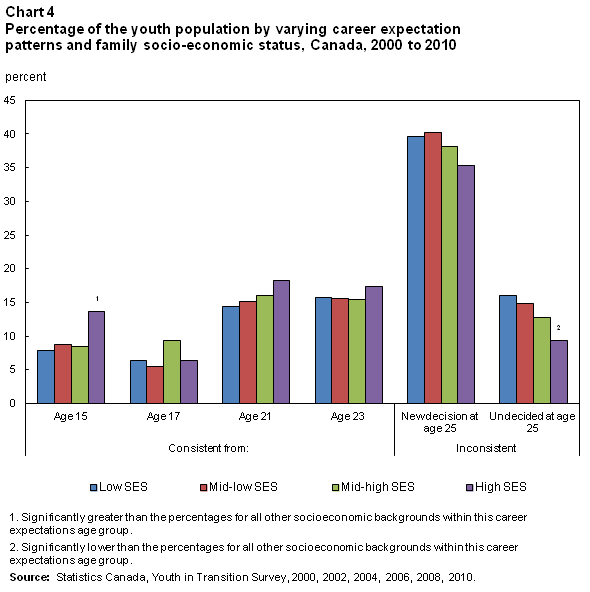
A significantly greater proportion of youth in families from the high SES category (13.6%) demonstrated consistency from age 15, compared with those from families in all other SES categories. The proportion showing consistency in career decision-making from age 15 ranged between 7.9% and 8.8% for all other SES groupings (Chart 4). Further, youth from high SES families were significantly less likely to be in the ”undecided at 25” group (9.3%) than those from families in the other SES backgrounds, ranging from 12.7% for mid-high SES to 16.0% for low SES.
However, the association between family SES and consistency in career expectations was less marked in the other ages.
Family socio-economic status
The indicator of family socio-economic status (SES) was derived from data describing parental education levels, parental occupations, and the material and cultural possessions in the home. The SES categories used in this analysis were delineated using the quartile scores on SES. Youth in families with scores in the lowest quartile were classified as “low SES”. Those in families with scores between the first quartile and the median were classified as “mid-low SES”; between the median and the third quartile as “mid-high SES”; and in the upper quartile as “high SES”.
Career decision-making and educational outcomes
An important question that can be answered using the YITS data is whether consistency in career decision-making behaviours is associated with educational behaviours such as length of time between secondary graduation and entry into postsecondary studies, and level of educational attainment at age 25 (see “Duration between secondary graduation and postsecondary enrolment”).
Career decision-making and time between secondary graduation and postsecondary enrollment
According to the YITS data, early demonstration of consistency in career expectations was associated with earlier entry into postsecondary studies. Among the young adults aged 25 who entered postsecondary studies within 15 months of completing their secondary education, a significantly higher proportion demonstrated consistency in their career plans from age 15 (11.8%) or age 17 (8.7%) than was found in the group who entered postsecondary 16 months or more after secondary school graduation (Chart 5).
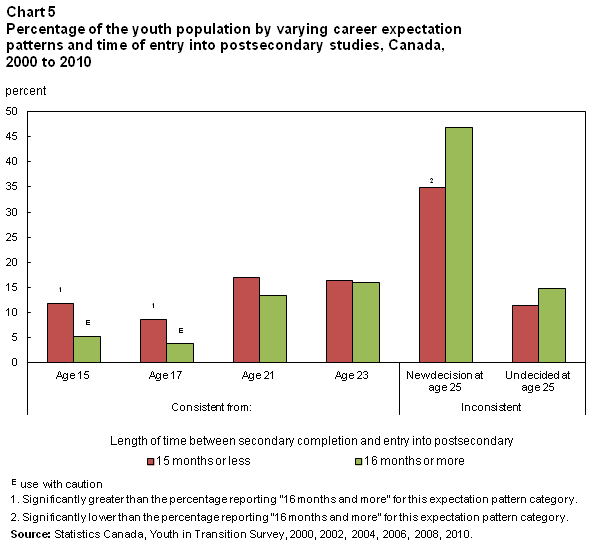
About one-third (34.8%) of those who had entered postsecondary education within 15 months of secondary completion were making a new career decision at age 25. In comparison, a significantly higher proportion of those who delayed entry into postsecondary education were making a new career decision at age 25 (46.9%).
Duration between secondary graduation and postsecondary enrolment
The analysis on duration between secondary graduation and postsecondary enrolment excluded records for the respondents who reported entry to postsecondary before graduation from secondary studies. Records for which the duration between secondary graduation and postsecondary enrolment was not reported were also excluded. The analysis includes youth who did not pursue postsecondary studies before 2010.
Career decision-making and postsecondary attainment
Early demonstration of consistency in career expectations was also associated with higher levels of educational attainment at age 25. Conversely, late demonstration of consistency in career expectations, and particularly career indecision at age 25, were associated with lower educational attainment at age 25. (This analysis excluded records for youth when the level of detail of their postsecondary attainment was insufficient for detailed classification, as well as records for those whose level of postsecondary attainment was not reported.)
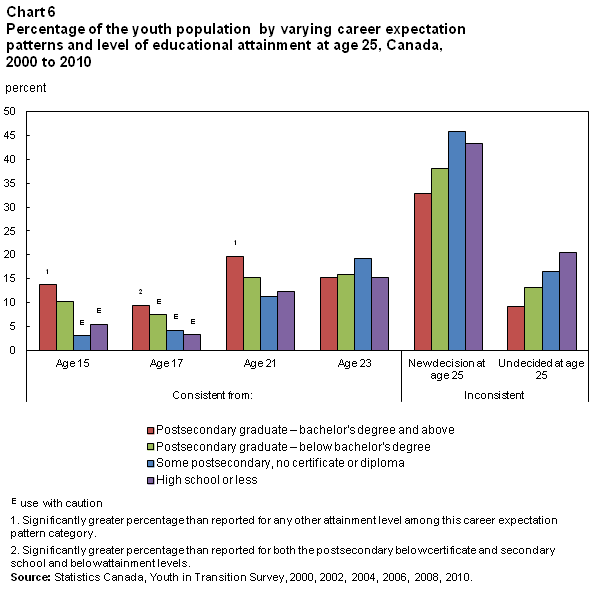
For instance, all young adults aged 25 who showed consistency in their career expectations at some point were more likely to complete postsecondary education at the Bachelor degree level or higher (13.7% of those consistent since age 15, 9.4% consistent since age 17, 19.6% consistent since age 21, and 15.2% consistent since age 23), compared with those yet undecided in terms of career path at age 25 (9.1%) (Chart 6).
Conclusion
This fact sheet has shown that career decision-making for the majority of Canadian youth is an on-going process, occurring throughout adolescence and typically lasting well into adulthood.
Nonetheless, earlier and later demonstration of consistency in career expectations was associated with several background factors: parental valuation of postsecondary studies and family socio-economic status. Earlier consistency in career expectations was related to high parental valuation of postsecondary studies, as well as high family socio-economic status. Conversely, later consistency in career expectations was linked to inconsistent or low parental valuation of postsecondary studies and lower family socio-economic status.
Another finding was that consistency of career decisions was associated with postsecondary educational outcomes. Specifically, consistency was associated with a greater likelihood of entry to postsecondary education within 15 months of graduating secondary studies, and a higher level of educational attainment at age 25.
- Date modified: