
Statistics Canada
www.statcan.gc.ca
Common menu bar links
Discussion

Archived Content
Information identified as archived is provided for reference, research or recordkeeping purposes. It is not subject to the Government of Canada Web Standards and has not been altered or updated since it was archived. Please "contact us" to request a format other than those available.
1.0 Introduction
2.0 Defining metropolitan areas: evolution of a concept, model and measurement
3.0 Delineating metropolitan areas: a comparison between Canada and the United States
1.0 Introduction
This paper is divided into two parts. The first part (section 2) is descriptive and gives background and context to the rationale behind the current methodology used to define metropolitan areas in Canada. The second part (section 3) of this paper compares the Canadian methodology for delineating metropolitan areas with the methodology used in the United States.
2.0 Defining metropolitan areas: evolution of a concept, model and measurement 1
2.1 Historic review
Statistics Canada defined metropolitan areas for the first time as part of the 1941 Census - called Greater Cities. They were defined as cities with a minimum population of 50,000 along with satellite communities that had a close economic relationship with the central city.
The term census metropolitan area (CMA) appears in the 1951 Census. As in 1941, a CMA is defined as a city with a minimum population of 50,000 along with parts of fringe municipalities with a close economic, social and geographic relationship with the central city. The CMA had a total population of at least 100,000.
For the 1956 Census, the CMA definition was unaltered except that the fringe was delineated using whole municipalities.
For the 1961 and 1966 Censuses, the criteria became more explicit for the delineation of a CMA. Specifically:
- A principal city (often the central and largest city) with a population of at least 50,000;
- Municipalities completely or partly in the urban core defined as the principal city and the adjacent fringe having a population density of 1,000 persons per square mile;
- Adjacent municipalities outside the urban core where at least 75% of the resident labour force worked in non-agricultural activities;
- A total population of 100,000 or more.
For the 1971 Census, the concept of the main labour market was introduced to define a CMA. The CMA was the territory where a significant number of workers were able to travel from their place of residence to a work place in the urban core on a daily basis. Although the data to support this approach were collected as part of the 1971 Census, they were not available for 1971 Census CMA delineation. So transition criteria were used. Previous census criteria were combined to define the urban core (i.e., the continuously built-up area) of a CMA - an area having a population density of 1,000 per square mile and a population of at least 100,000. In place of commuting data, whole municipalities were added if they were within 20 miles of the urban core limit if they met two criteria:
- The percentage of the resident labour force employed in primary activities was smaller than the national average.
- The population growth of the municipality over the period 1956 to 1966 exceeded the CMA growth rate.
- If only one of the above but not both were met, then a municipality was still included if connected to the urban core via a major highway.
For the 1976 Census, the urban core criteria were retained. However, with the availability of place of work/place of residence (often referred to as commuting data), the 20 mile approach was replaced and adjacent municipalities were added if:
- at least 40% of the resident employed labour force of a municipality worked in the urban core (forward commuting) or
- at least 25% of the employed labour force working in the municipality lived in the urban core (reverse commuting).
The methodology introduced for the 1976 Census has for the most part remained constant up to and including the 2006 Census with one exception. Starting with the 1986 Census, CMAs and census agglomerations (CAs)2 that were adjacent could be merged to form one CMA. In these instances, the two were merged to form a consolidated CMA if the total commuting exchange between the two entities was at least 35% of the resident employed labour force in the smaller of the two entities. For the 1996 Census, CMA with CMA merging was excluded and for the 2001 Census, the term consolidated CMA was dropped but the CA merging criterion has been retained in the delineation of a CMA.
Minor changes have been included for a variety of reasons over this period. For example, with metric conversion, the density criterion was changed from 1,000 persons per square mile to 400 persons per square kilometre for the 1981 Census. For the 1986 Census, the forward commuting threshold was increased from 40% to 50% to adjust for a change to the place of work coding. For the 2006 Census, the threshold criteria for CMA designation requires a total CMA population of at least 100,000 of which at least 50,000 reside in the urban core.
2.2 The concept
The concept of a CMA has been consistent from the onset, namely a central core area that is geographically, socially and economically integrated with adjacent areas because of linkages with the central core.
2.3 The model
Although the concept of a CMA has been consistent, the model has evolved in four distinct stages. Prior to the 1961 Census, the model is not explicitly stated but the implied model is that of an urban area using structural measures (form) as population and population density. During the sixties, a more explicit model embracing both form and function begins to emerge: a model that sees two components comprising a CMA - a core (form) and its hinterland (function). Specifically, a CMA is a very large urban area (known as the urban core) together with adjacent urban and rural areas that have a high degree of social, economic and geographic integration with the urban core. The third stage in the CMA model evolution occurs as part of the 1971 Census, where the functional part of the model specially adopts a labour market construct to define the hinterland: namely, a commuting field or a zone where a significant number of people are able to travel on a daily basis to work places in the main built-up area (i.e., the urban core). The fourth stage in the evolution of the CMA model appears with the 1986 Census and is still an active process of change in the effort to address peripheral CAs and their relationship to the CMA. This fourth stage also includes the question of modelling metropolitan regions where CMAs are adjacent and coalescence may be present.
2.4 Measurement
As the CMA model evolves, so does the measurement, specifically the measurement of the urban core and the hinterland. Essentially, the core is defined on the basis of morphology measures, whereas the hinterland is defined using relational measures.
In the absence of documentation on the criteria used, it is not clear exactly how the CMA was measured prior to 1961. However, since the final delineations are available and since the CMA prior to 1961 was essentially the urban core, it is possible to make a very good inference, especially since the urban criteria are documented. In this instance, the start point was an administrative measure: a city of at least 50,000 along with adjacent whole or part cities. Whether the adjacent area was determined by negotiation with the cities or whether a density measure was applied is not known. What is known is that the administrative/city approach was retained to define the core with a decision to include whole cities by 1956.
With the 1961 and 1966 Censuses, this urban measurement approach is explicit in the criteria to delineate the urban core: a city of 50,000 plus the adjacent fringe where a density of 1,000 per square mile is attained. By 1971, the administrative/city requirement has been dropped and a strict statistical measurement is being used, namely the urban area (an area with a minimum of 1,000 people and a density of 1,000 persons per square mile) where the urban area population is at least 100,000. The statistical approach has been maintained to the present census with minor changes to support metric conversion (now 400 persons per square kilometre) and a change in the unit of measure to define urban areas (from the census collection unit to the block).
As noted in section 2.1 Historic review, measurement of the hinterland started with the 1961 Census. From 1961 through to 1971, although the specifics differed slightly, measurement of the hinterland used stock data - municipal population growth rates and characteristics of the labour force. From the 1976 Census until now, the spatial relationship between municipality of residence and municipality of work has been used. As with the urban core, minor changes have occurred. For example, in 1986 the threshold for forward commuting increased from 40 to 50%. This change reflects a number of inputs: imputation for non-response to the place of work data, 50% approaches the national average for out commuting and 50% reflects a majority linkage.
2.5 Impact of the criteria
As noted in section 2.3, the CMA methodology in Canada is concerned with three elements: the core, the hinterland and mergers. The methodology is comprised of seven criteria (or rules). The first defines the core. The next three criteria (forward commuting, reverse commuting and spatial contiguity) are used to define the hinterland of the core. Criteria five and six (historic comparability and manual adjustments) are employed to handle peculiar situations that occur from time to time. The seventh criterion is concerned with the merger of an adjacent CA with a CMA (see Statistics Canada website for a more detailed description of the 2001 Census criteria).
This section assesses the impact of each of the CMA delineation criteria. The impact of each criterion is expressed in terms of the percentage of the CMA population accounted for by the criterion3. By stepping through the methodology in this manner, the intent is to help facilitate the making of international comparisons and the subsequent discussion with reference to the development of guiding principles.
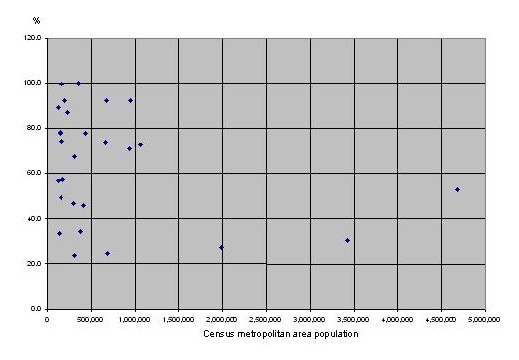
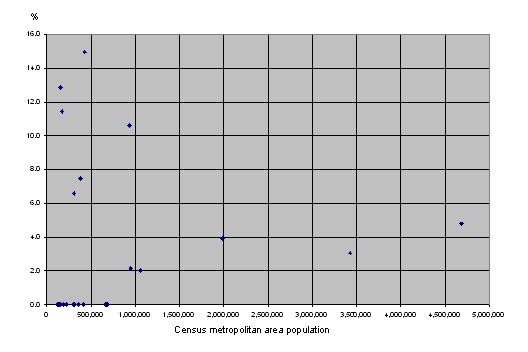
To begin with, although metropolitan areas are centred upon a major city, in Canada the governance structure for these central municipalities (more often than not also the largest) does not always align well with the CMA (see Figure 2.5.1). For example, nationally the central cities of a CMA represent only 54% of the CMA population with a range from 23% to 100% for individual CMAs.
Figure 2.5.1
Census metropolitan area population — Percentage central city
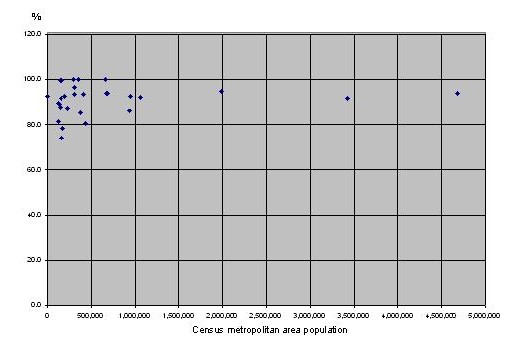
On the other hand, the urban core, which includes the central city and the parts of adjacent municipalities meeting the density of 400 persons per square kilometre, accounts for 90% of the CMA population at the national level (see Figure 2.5.2). Nationally, the percentage increases marginally to 92% with the first criterion for CMA core delineation where all municipalities that are completely or partly within the urban core become part of the CMA (see Figure 2.5.3).
Figure 2.5.2
Census metropolitan area population — Percentage urban core
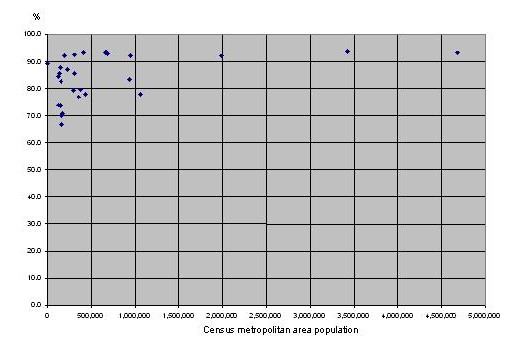
Figure 2.5.3
Census metropolitan area population — Percentage urban core, rule 1
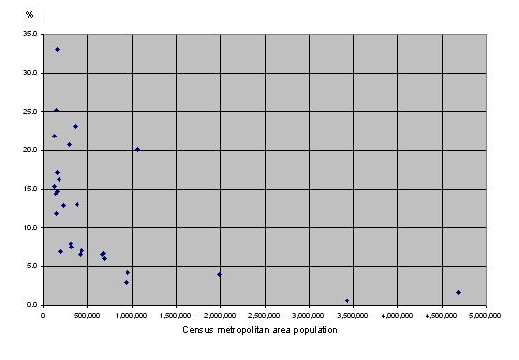
Nationally, the hinterland (measured using the place of residence/place of work relationship) accounts for about 3% of the CMA population. Forward commuting is more significant than reverse: about 2.5% with reverse accounting for 0.5%. However, because under the urban core rule whole municipalities are included, the result is to discount the effect of commuting. Were a much smaller building block used in place of the municipality, the CMA portion attributed to the commuting measure would be greater. An alternative assessment would be to attribute the difference between the urban core and the CMA after commuting is accounted for as a measure of the hinterland (see Figure 2.5.4). In this case, the hinterland measurement accounts for 6% nationally, but for CMAs smaller than 750,000, the hinterland component is more significant, ranging from about 6% to a high of nearly 35%.
Figure 2.5.4
Census metropolitan area population — Percentage adjusted commuting
Nationally, at 4%, the impact of the merger criterion is on par with the hinterland defining criteria (see Figure 2.5.5). Mergers are not a common aspect of all CMA delineations, affecting 11 of the 27 CMAs defined for the 2001 Census. However, where mergers are present, they often have a greater impact than the forward and reverse commuting criteria. Currently, associating multiple CMAs to form metropolitan regions is not part of the Canadian methodology.
Figure 2.5.5
Census metropolitan area population — Percentage mergers
2.6 Measurement questions
2.6.1 The urban area
The urban area is the start point. For a metropolitan area to be delineated, there must be an urban area. In Canada, urban areas are currently defined based on population and density criteria calculated for a mix of geographic building blocks over censuses since 1976.
Although there have been questions raised about whether population is the best measure, this has not been the focus of discussions since there is a general acceptance of this measure. This is based on the assessment that if an alternative measure like dwelling counts, employment or a combination were used there would not be significant difference in the end results. However, there are some urban area measurement questions that can have an impact on CMA identification.
With the introduction of the block4 at a national level during the 2001 Census, urban area precision differences are evident between existing delineations and block based delineations. A complete reworking of the urban area delineations using the block would result in the splitting of some existing urban areas and could result in the splitting of some CMAs.
As well, as urban areas have expanded over the years, some have grown into one another. Historical delineations have been retained, but there are questions about whether or not these are still appropriate for delineating the urban area and if commuting data should also not be used to validate urban area delineation.
2.6.2 The urban core - CMA threshold
How large should an urban area be before it can become an urban core for a CMA? Prior to the 2006 Census, an urban area of at least 100,000 was required for CMA creation. This was changed to an urban core of at least 50,000 and a total population of at least 100,000.
This change was made following input from our users advocating a lower threshold. Prior to the change, a review of metropolitan functionality was made. An index was generated based on the goods and services provided. As expected, the scores were high for CMAs with urban cores of 100,000 or greater and low for CAs with urban cores of 50,000 or less. The group of CAs in between, with cores between 50,000 and 100,000, had more mixed results, but those with total populations of 100,000 or more generally reflected an index value consistent with CMAs, supporting the change requested by the user community. It should be noted that this functionality assessment identified CMAs with low scores and small CAs with high scores. They were contrary to the general findings but reflect region and location circumstances (Statistics Canada 2003).
2.6.3 Commuting data and defining the hinterland
As noted in section 2.2, the concept for a metropolitan area sees an urban core that has an influence on surrounding urban and rural areas: its hinterland. The model also limits the extent of the hinterland to the physical space in which people move and interact with the urban core. It is a hinterland characterized by the effect of the friction of physical movement over distance and where the hinterlands of urban cores are discrete and geographically integrated and contiguous. This is an important element of the model since it both defines the nature of the metropolitan hinterland being defined and establishes in broad terms the nature of the data required to delineate the hinterland. Spatial data with definitive origins and destinations with frequent personal movement over space are appropriate given this model. Given the above conditions, the use of commuting data is a good choice.
There are other measures (shopping trips, social contacts, recreational trips, retail service areas for delivery of goods and services), but they are not as simple as the commuting data since there is a hierarchy to these measures. This hierarchy can affect frequency of contact and distance travelled, which adds more complexity to the calibration. Nor are these other options as practical as the use of commuting data collected by the national census in terms of national coverage, public availability, consistency (concept, measurement and regularity over time), cost and analytical flexibility (given the census infrastructure in terms of geography and data profiling). Adoption of commuting data in Canada also means that the metropolitan areas specifically adopted a labour market construct to define the hinterland: namely, a commuting field or a zone where a significant number of people are able to travel on a daily basis to work places in the main built-up area (i.e., the urban core).
This model of a metropolitan area remains relevant today and does reflect the social, economic and geographic integration of metropolitan areas as a space with direct contact and physical movement. But there is also recognition of interaction in our digital and increasingly frictionless geographic space that may not be reflected in this model and may even run counter to the statement that all things are related but near things more so as reflected in the distance decay model. It is a space where physical contact or movement of goods is not required and measured perhaps by patterns of telephone contacts, information exchanges or financial transactions. It is a space where an adjacent geographic and discrete hinterland is not necessarily the case.
2.6.4 Thresholds for commuting data
The commuting thresholds required for forward (40%) and reverse commuting (25%) were originally selected so that the CMA delineated in 1976 closely approximated those delineated previously based on stock data that characterized metropolitan areas. A minor adjustment followed to account for changes to the place of work data processing procedures: the forward threshold was increased to 50%. Part of the rationale supporting the 50% threshold was its intuitiveness and clarity as an indicator of linkage with the urban core. Subsequent investigations have also noted that this is close to the national average for workers who work outside of their municipality of residence (the national average is 47%).
An aspect not directly assessed although implied is the question of using a single measure to define the hinterland in the first instance and the selection of thresholds in the second instance. The ideal would be to have multiple measures besides the commuting data to examine their degree of correlation in the first instance and to select a commuting threshold in the second that reflects the totality. Alternatively, if these alternative measures were available and met the pragmatic requirements to support a national statistical programme, then some combined measure could be considered.
2.6.5 Non-metropolitan differentiation
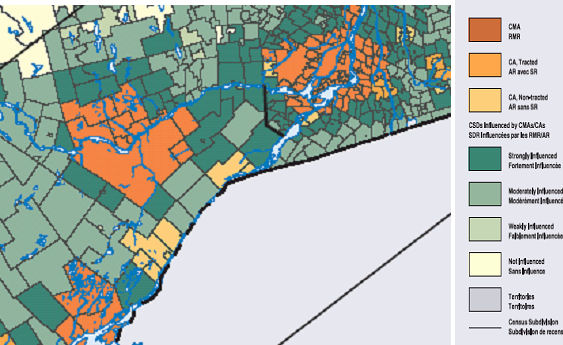
Although the assessment of the threshold value is an ongoing effort, there is a recognition that we are dealing with a continuum where selection of a threshold value has an arbitrariness when used to classify metro from non-metro. For this reason, the census metropolitan area and census agglomeration influenced zone (MIZ) was introduced as part of the 2001 Census. MIZ is a concept that geographically differentiates the area of Canada outside census metropolitan areas (CMAs) and census agglomerations (CAs). Municipalities (census subdivisions - CSDs) outside CMAs and CAs are assigned to one of four categories according to the degree of influence (strong, moderate, weak or no influence) that the CMAs and/or CAs have on them.
Municipalities are assigned to a MIZ category based on the percentage of their resident employed labour force that has a place of work in the urban core(s) of CMAs or CAs. CSDs with the same degree of influence tend to be clustered. They form zones around CMAs and CAs that progress through the categories from 'strong' to 'no' influence as distance from the CMAs and CAs increases reflecting the continuum of the distance decay model (see Figure 2.6.5.1). Together, CMA, CA and MIZ form the Statistical Area Classification (SAC).
Categories:- Strong MIZ: more than 30% of the municipality's residents commute to work in any CMA or CA.
- Moderate MIZ: from 5% to 30% of the municipality's residents commute to work in any CMA or CA.
- Weak MIZ: from 0% to 5% of the municipality's residents commute to work in any CMA or CA.
- No MIZ: fewer than 40 or none of the municipality's residents commute to work in any CMA or CA.
Figure 2.6.5.1
Southwestern Quebec and Eastern Ontario: showing clusters of census metropolitan area and census agglomeration influenced zone (MIZ) census subdivisions and census metropolitan areas and census agglomerations
2.6.6 The geographic building block
Of all the questions associated with measurement, this is probably the most problematic in Canada. The attributes for evaluating geographic building blocks are well cited in the literature. These include: consistency, stability, scale and relevance.
- Consistency means the geographic building block does not vary greatly in size, shape and compactness.
- Stability means consistency over time; i.e., the limits of the geographic building block remain constant.
- Scale means the size of the geographic building block is appropriate to the measurement of the entity. When scaled properly for metropolitan delineation, over and under bounding should be minimal and longitudinal comparisons should not see sudden abrupt changes evident with the entry (or exit) of geographic building blocks when the building block is too large. Associated with the attribute of scale are operational considerations such as data reliability, confidentiality and geographic complexity and aspects of contiguity and geographic integrity.
- Relevance means the building block has inherent meaning and utility. Possession of this attribute is generally associated with administrative areas, which are in most instances understood and recognized and for which data from a variety of sources are available.
In Canada, there is no one geographic building block that satisfies all four of the above attributes. Currently, the geographic building block is the municipality. This geography is definitely relevant but it is not consistent or stable and scale could be better. As a consequence, both longitudinal and cross-sectional comparability can be compromised from time to time. Currently, work is in progress examining the potential of using dissemination areas (introduced as part of the 2001 Census) as the geographic building block. On the surface this would appear to be a better choice in terms of consistency, stability and scale but falls far short of the mark with respect to relevance (see Table 2.6.6.1).

Comparison of geographic areas available as census metropolitan area building blocks
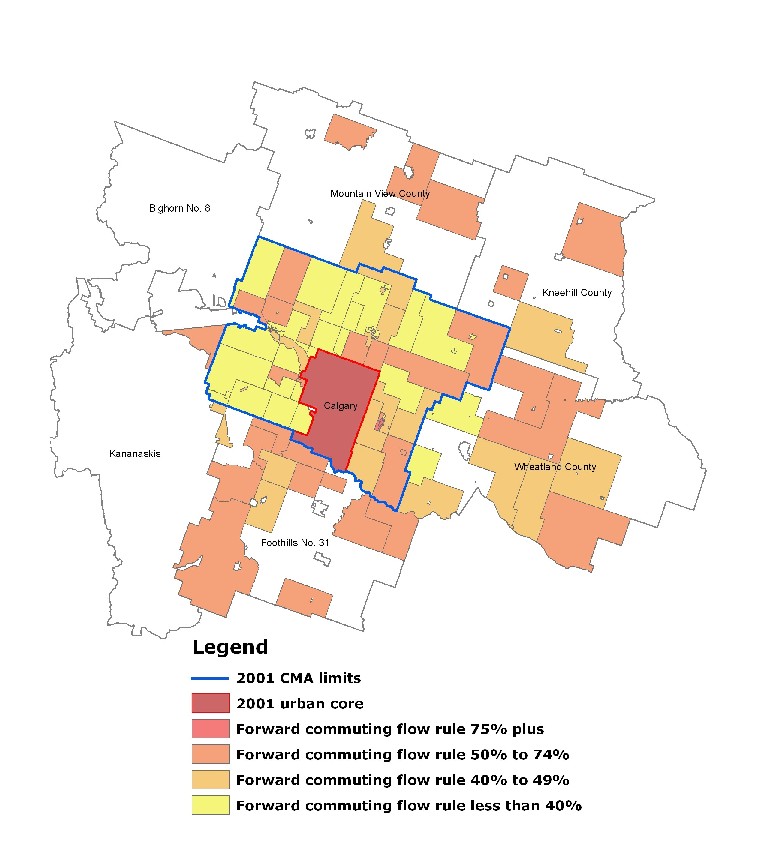
However, the complexity of geographic association with the urban core may also increase as the building block decreases in size. The maps below present some initial research investigating the potential of using the dissemination area (DA) as the building block. In the two examples below, the land area and population with the CMAs of Québec and Calgary decreased by 32.7% / 2.54% and 12.7% / 2.7%, respectively (see Figure 2.6.6.1 and Figure 2.6.6.2). Québec is the prototypical case where use of the DA as the building block results in a contraction of the limit decreasing the over bounding associated with use of the CSD as the building block. The Calgary example, however, is quite different, with discontinuity and over and under bounding when assessed using the DA. This illustrates the added complexity that can be associated with smaller geographic building blocks.
Figure 2.6.6.1
Québec census metropolitan area using the dissemination area as a building block
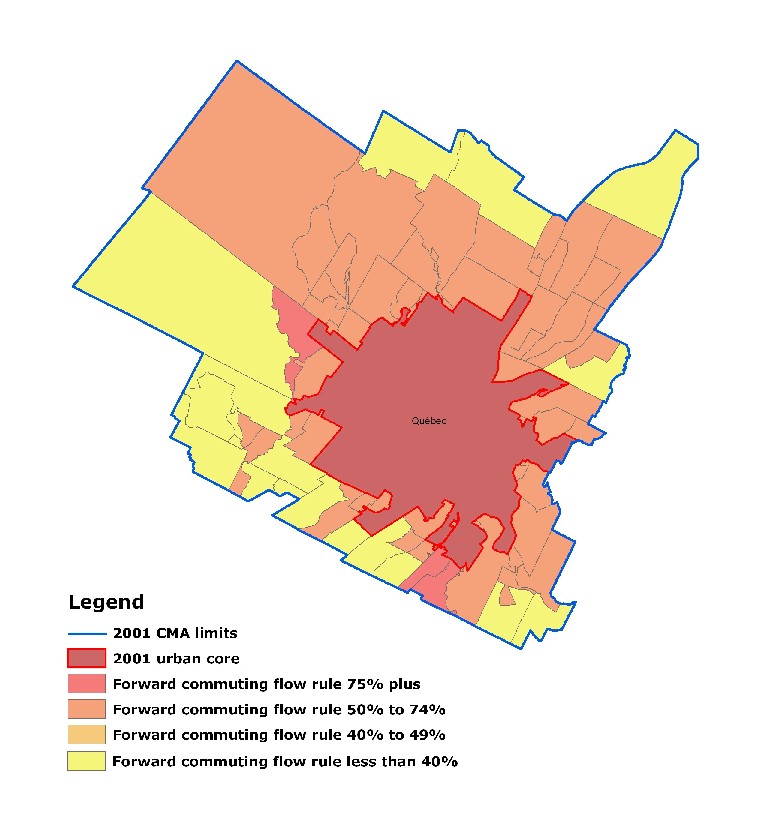
Figure 2.6.6.2
Calgary census metropolitan area using the dissemination area as a building block
2.6.7 Updates
The Statistical Area Classification (SAC) is recompiled every ten years following the decennial census and applied to the mid-decade census. Updates to limits are done following the mid-decade census to reflect changes to CSDs and new entrants also are supported following each census with the delineation and calculation of urban core and total CA populations. Given the scale of the building block, this is a sufficient update cycle since too few CSDs would cross the threshold values to warrant more frequent updates. This may not be the case if a DA building block were used.
3.0 Delineating metropolitan areas: a comparison between Canada and the United States 5
| General elements | United States | Canada |
|---|---|---|
| Concept | The general concept of a metropolitan area is that of an area containing a large population nucleus and adjacent communities that have a high degree of integration with that nucleus. | Same |
The concept in both countries focuses on the delineation of individual metropolitan areas with a core and a hinterland. Both are silent with respect to the explicit conceptualization of large metropolitan areas with multiple cores and metropolitan area integration to form metropolitan regions, although the United States and Canada to a lesser extent have incorporated criteria based on commuting data measures to define these links.
| General elements | United States | Canada |
|---|---|---|
| Application | To provide a nationally consistent definition for collecting, tabulating and disseminating Federal statistics to measure economic and social conditions and thereby inform the nation. Warn users that these areas are not designed to serve nonstatistical applications. |
Same purpose but not a federal standard in Canada. It is a standard applied by Statistics Canada. |
| Review process | Formal review process conducted every 10 years under the Office of Management and Budget. |
Review process every five years in association with the national census of population and housing; however, the review of the metropolitan area methodology is not as focused as in the United States. |
In the United States, the review process is open, visible and focused with documentation via the Federal Registry. In Canada, the process is open and documented via Statistics Canada reports but is not as visible or focused.
3.1 Model
| General elements | United States | Canada |
|---|---|---|
| Components | Form (physical) and function (hinterland). | Same |
The large population nucleus, the form component, is modelled as the continuously urbanized or built-up area. Both countries use the delineations from their most recent census to define.
The integration of associated communities is the functional component modelled as a daily urban system using the relationship between place of residence and place of work (often termed commuting data).
| General elements | United States | Canada |
|---|---|---|
| Structure/ scope |
Part of a broader hierarchy to reflect settlement and activity patterns.
|
Very similar.
|
In the United States, there is no explicit modelling to reflect the urban-rural continuum within the standard. However, research is in progress and there are classifications in use such as the county-based United States Department of Agriculture Economic Research Service’s urban influence codes.
In the United States, intra-metropolitan differentiation is part of the standard with criteria to define 'metropolitan divisions'. Also, metropolitan areas can be combined to form what I see as 'metropolitan regions'. No similar criteria are included in Canada.
| General elements | United States | Canada |
|---|---|---|
| Geographic building blocks | Counties, an administrative area and the primary division of most states, is used as the building block to form metropolitan areas and has consistently been the geography of choice for delineating metropolitan areas. (A municipal based standard is also defined for the New England states). |
Census subdivisions, an administrative area and the third level of government representing incorporated cities, towns, villages and rural municipalities, is used as the building block to form metropolitan areas and has consistently been the geography of choice for delineating metropolitan areas. |
As described above in section 2.6.6, this is probably the most problematic element in the measurement of metropolitan areas in Canada. From the discussion in the reports released in the Federal Registry, it is apparent that the selection of an appropriate geographic building block is also of concern in the United States.
It is of concern, and consequently an element repeatedly subject to review, because in both countries there is no single geographic area that can satisfy the attributes of the ideal geographic building block. These include: consistency, stability, scale and relevance. As a consequence, in both countries the unit selected represents a trade-off and in both countries the attribute of relevance reflecting a widely known administrative area with available data and historic inertia has greatly influenced the decision. It is also the element that contributes to the most difference in the delineation of metropolitan limits when comparing the delineations of individual metropolitan areas between the United States and Canada.
In terms of consistency, both the county and the CSD as an administrative area are not designed within their respective states and provinces to be nationally consistent in terms of geographic attributes.
From the perspective of stability, change can and does occur to limits from time to time. However, in relative terms the county in the United States is far more stable than the CSD is in Canada, where typically changes to 20% of the CSD limits can be expected between censuses, although some of these changes are small. Historically, major municipal restructuring moves have also occurred within provinces with a direct impact on stability of metropolitan delineations in Canada, which is a problem not encountered in the United States.
With more than 900 metropolitan and micropolitan areas being delineated by counties, the ratio is about 3.5 to 1 (use of the geographically equivalent area in Canada, the census division, would have a ratio of about 2 to 1). In Canada, with just over 140 CMAs and CAs, the ratio is 40 to 1 using CSDs. However, because spatial contiguity is required when delineating CMAs and CAs, in practice the building block is the holding CSD (usually the rural municipality) or a ratio of about 17 to 1.
In terms of area, the average CSD in Canada is about half the size of a county in the United States. A county in Canada is about ten times the size of a county in the United States.
As a result, one can speculate that the over / under bounding is less pronounced in Canada than in the United States. Nonetheless, the entry or exit of a CSD in a CMA and CA can result in data jumps in longitudinal studies.
Recognition of the problem associated with the geographic building block used in both countries is fuelling the research into alternatives, such as the use of census tracts in the United States and dissemination areas in Canada (see section 2.6.6).
3.2 Criteria and measurement
| General elements | United States | Canada |
|---|---|---|
| Population nucleus or core | The large population nucleus (or core) is defined according to the criteria used by the U.S. Bureau of the Census to define urban areas. The criteria used delineate cores with a population density of 1,000 people per square mile (ppsm) and includes more-or-less contiguous territory with a density of at least 500 ppsm with a total population of at least 2,500. The building block is the block or groups of blocks called block groups. Urban areas of at least 50,000 are called urbanized areas and urban areas with populations of at least 2,500 to 49,999 are called urban clusters. |
Largely the same approach.
The urban core is defined according to the criteria used by Statistics Canada to define urban areas. After accounting for metric measurement, the same density threshold is used in Canada but a total population of 1,000 is required. Urban areas from the previous census are retained and contiguous blocks that meet the density threshold are added. |
The approaches to define urban areas are very similar in many respects but there are also significant procedural differences. The impact of these differences has not been quantified but in my opinion these differences would have a minimal impact on the delineation of metropolitan areas between the two countries with one possible exception. In the United States there are criteria that determine when an urbanized area should be split. In Canada, large urban areas (50,000 or more) retain their historic limits at the point of contact (in a sense they are split by default) and consequently continue to be urban cores for individual CMAs. Given the limited extent of urbanization in Canada relative to that in the United States at the moment, this is not necessarily a source of great difference in the delineation of metropolitan areas between the two countries. However, if the American urban area criteria were applied in Canada there is the potential that the urban areas supporting the CMAs of Hamilton, Toronto and Oshawa could merge into one urban area and as result support one CMA.
| General elements | United States | Canada |
|---|---|---|
| Population thresholds | Metropolitan area - an urbanized area (a population of at least 50,000).
Micropolitan area - an urban cluster with a population of at least 10,000 but less than 50,000. |
Census metropolitan area - an urban area with a population of at least 50,000 but a total population of at least 100,000. Census agglomeration - an urban area with a population of at least 10,000 but less than the CMA thresholds. |
Comparison of the population thresholds is interesting. Prior to the 2006 Census, an urban core of at least 100,000 was required for a CMA in Canada. For the 2006 Census, this was changed as described above and is consistent with the threshold required previously in the United States for urbanized areas. As well, during the last formal review of the standard in the United States, one option presented was to raise the minimum population for a metropolitan area to 100,000.
As noted above in section 2.6.2, the revision to the CMA population thresholds was based on a review of functionality within CMAs and CAs. This study took as its inspiration an article by Calvin Beale, entitled 'Poughkeepsie's Complaint or Defining Metropolitan Areas', published in January 1984 in American Demographics.
For the 2006 Census, the number of CMAs has increased from 27 (2001 Census) to 33. Two of the six would have been added had the threshold remained at 100,000. So the impact of change has been to increase the number of CMAs for 2006 by four. If the threshold was an urban core of 50,000 as in the United States, then an additional 16 CAs would become classified as CMAs. Based on the 2001 Census, CMAs accounted for about 64% of Canada's population. With the change to the threshold, this increases to about 67% and would increase to almost 70% with a 50,000 threshold compared to the 83% in the United States (Canada/United States Comparison, Marc J. Perry, U.S. Census Bureau presentation at the Annual Meeting of the Association of American Geographers, Chicago, Illinois, March 11, 2006).
| General elements | United States | Canada |
|---|---|---|
| Target core | Counties with at least 50% of their population in urban areas (urbanized core or urban cluster of at least 10,000) or within their boundaries have a population of at least 5,000 residents in a single urban area (urbanized core or urban cluster of at least 10,000) become central counties. The central county or counties become the target for measuring commuting to define the hinterland of the metropolitan area. |
Any municipality (CSD) with a part in the urban core is included in the CMA. However, for subsequent measurement of commuting to define the hinterland extent, only those CSDs with 75% or more of their population resident in the urban core are included. |
The general approach used in the United States and Canada is again very similar. A noticeable difference is that in the United States the central county (counties) is explicitly identified and visible whereas in Canada it is not.
Application of this criterion causes the impact of actual differences in the urban area delineations between the United States and Canada to be reduced when delineating metropolitan areas. Instead, metropolitan area delineation differences are focused at the population thresholds of 50% and 75% and the building blocks. It is not possible to describe the impact at this time. In Canada, 64% of the CSDs included in CMA are a consequence of this criterion.
| General elements | United States | Canada |
|---|---|---|
| Hinterland/ commuting data |
Place of work and place of residence data are used to delineate the hinterland in terms of the forward commuting (to the core) and reverse commuting (from the core). | Same |
In both countries, there has been discussion concerning data requirements to measure and delineate the extent of the hinterland. Despite the discussion, in both instances the conclusion has been that place of work and place of residence data (commuting data) is the single best measure: straightforward, consistent and national coverage via the census and public access.
| General elements | United States | Canada |
|---|---|---|
| Thresholds | Forward commuting - at least 25% of the employed residents of the county work in the central county (counties) of the CBSA. Reverse commuting - at least 25% of the employment in the county is accounted for by workers residing in the central county (counties) of the CBSA. |
Forward commuting - at least 50%. Reverse commuting - at least 25% |
In the United States, the 25% threshold reflects the national average of workers whose county of work is different than their county of residence. Likewise in Canada, the forward commuting threshold reflects the national average and a clear intuitive threshold at 50%. The reverse threshold reflects the calibration made in 1976 relative to the 1971 CMAs and has been retained, given the lesser prominence of reverse commuting as a determining factor. Recent trends indicate however that reverse commuting is becoming more of a factor in the delineation of the hinterland and may warrant a revisit (percentage of CSDs linked to urban core increased from 1.5% in 2001 to 4.9% for 2006).
The difference in commuting thresholds used is related to the difference in the size of the geographic building blocks. On the surface, it would seem that the forward commuting thresholds selected are equivalent, relative to the geographic building blocks used. In Canada, forward commuting accounts for linking about 20% of the CSDs. However, a direct comparison of commuting percentage thresholds is complicated by the fact that the place of work question is different between the two countries. Essentially, with a no fixed place of work option in the Canadian question, percentages calculated are on average 7.5% lower than would be the case if the question were structured as in the United States. This could in turn increase the average out-commuting and require a reassessment of the percentage threshold.
In both countries, spatial contiguity is a requirement when delineating the hinterland. As well, the absolute magnitude of the commuting exchange is used to decide linkage in the event of an association with more than one urban area.
| General elements | United States | Canada |
|---|---|---|
| Mergers | Two adjacent CBSAs are merged if the central county (counties) of one CBSA meet the commuting requirements to the central county (counties) of the other CBSA. | A CA is merged with a CMA if the total forward commuting interchange between the CA and CMA is equal to at least 35% of the employed labour force living in the CA. CA with CA merging and CMA with CMA merging are not supported. CA identity is not retained except for identifying the urban core as a secondary urban core within the CMA. |
The procedures used in the United States to determine when merging of CBSAs should take place are consistent with metropolitan area hinterland rules and the rules for combining metropolitan areas. The criteria used are the most appropriate, since merging results in the creation of a single CBSA.
In Canada, the current criteria reflect a process that is in transition to define an increasingly more complex urban structure as evident by the changes in the methodology governing mergers and consolidation of metropolitan areas since the 1986 Census. Application of the American merger criteria to the CAs in the Toronto CMA would not result in mergers using the 50% forward commuting threshold, although some would be merged using a 25% threshold.
| General elements | United States | Canada |
|---|---|---|
| Metropolitan divisions | Metropolitan divisions are created to recognize the existence of multiple distinct employment and settlement centres in large urbanized areas (2.5 million or more population). A county becomes a main county of a metropolitan division if:
After all main counties and secondary counties have been identified, each additional county in the metropolitan area is associated with a main/secondary county to which it has the highest employment interchange and the county is contiguous with the main/secondary county. |
No comparable methodology in Canada. |
Application of the American criteria in the Toronto CMA would identify Mississauga as a secondary sub-centre (51% of resident employed labour force works in the municipality; would be 58% if we assume those with no fixed work place were working in the CSD), it has a ratio of 1.06 employment to resident employed labour force.
| General elements | United States | Canada |
|---|---|---|
| Consolidation/ metro regions |
Two adjacent CBSAs are combined if the employment interchange between the two areas is at least 25%. The employment interchange is the sum of the forward commuting percentage from the smaller CBSA to the larger and the reverse commuting percentage from the larger to the smaller. If the interchange is at least 15% and less than 25%, combining of the CBSAs will occur if supported locally. The combined CBSAs retain individual recognition. |
Currently, no comparable methodology in Canada. A similar approach was initiated as part of the 1986 Census, but has been modified since to the merger criterion which applies only to the merger of CAs with CMAs. |
The merging, metropolitan division and consolidation criteria in use in the United States reflect a scale of urbanization not generally present in Canada with the possible exception of the areas around Montreal, Toronto and Vancouver. Consequently, the rules in the United States clearly differentiate between mergers, sub-centres within large metropolitan areas (metropolitan divisions) and consolidation (combining) of metropolitan areas reflective of metropolitan regions.
In Canada, the merger methodology is a blend of the merger and combination criteria applied in the United States. Again using the Toronto CMA as a test case, application of the American combination criteria could result in the consolidation (combining) of the CMAs of Oshawa and Hamilton with the Toronto CMA. With an employment interchange of 60%, Oshawa would be combined without local consultation. With an employment interchange of 21%, Hamilton would be combined if supported locally.
| General elements | United States | Canada |
|---|---|---|
| Grandfathering | No | Yes. Accounts for about 10% of the CSDs included in CMAs. |
| Updating | Until 2009, a new CBSA is designated if a city that is outside of a CBSA has a Census Bureau population estimate of 10,000 or more for two consecutive years or a Census Bureau special census count of 10,000 or more. Until 2009, a new CBSA is designated if a Census Bureau special survey results in the delineation of a new urban area of 10,000 or more outside of an existing CBSA. For these new CBSAs, hinterland delineation will be made using 2000 Census commuting data until 2007. The geographic extent of all CBSAs is to be assessed in 2008, using commuting data from the Census Bureau's American Community Survey. These data will be used to define hinterlands for new 2008 and 2009 CBSAs. CBSAs are not reclassified between decennial censuses. |
Recognition of new CMAs and CAs and adjustment for CSD boundary changes takes place every five years prior to next census based on data from the previous census. Calibration of hinterland limits occurs every 10 years for the mid-decade census using commuting data from the decennial census. |
| Naming criteria | The United States will include up to three names in the CBSA, metropolitan divisions or combined CBSA. The approach is similar for all three entities and will include the names of principal cities in decreasing order of population size. Combined CBSAs will also include state names, will be unique and may use a regional name if appropriate. Local opinion is sought for naming combined CBSAs. There are four criteria for defining principal cities. The first criterion essentially ensures that a CBSA will be named relative to the largest incorporated place or designated place within the CBSA. The other three criteria establish conditions for the second and third name and ensure that the names of additional places are significant places in terms of population size or as employment centres. |
In Canada, the name of the urban area is used to name CMAs and CAs. In general, this is also the name of the historic central CSD which, in most instances is also the most populous of the component CSDs. This convention has been used since the 1971 Census; however, a number of names that do not follow this convention have been grandfathered. |
Statistics Canada is carefully reassessing its approach to naming CMAs and CAs and is considering adopting criteria similar to the United States practice. Use of the single name was favoured by Statistics Canada in the past because of its simplicity and stability over time (no change as component CSD populations changed or component CSD structure was modified). The downside of this approach has been confusion of the CMA and CA with the central CSD and the subsequent association of CMA and CA data to the central CSD and ignoring the other component CSDs. Statistics Canada would like to minimize this confusion and is therefore considering a change to the naming convention as one way to improve upon the existing situation.
3.3 General comments and observations
- The differences in the methodologies for delineating metropolitan areas between the United States and Canada can be assessed from two perspectives: impact at the national level and impact at the level of an individual area.
- Urban areas are the start point in both countries for metropolitan area delineation. The methodologies employed are similar to the extent that they would for the most part identify the same urban areas if methodologies were exchanged discounting the minimum population requirements. Therefore, at a national level of comparison the urban area delineation differences do not in my view contribute to major differences with respect to the delineation of metropolitan areas.
The extent of the urban areas delineated however may differ given the methodologies used. For the delineation of individual metropolitan areas, this difference may have an impact. In Canada, historic urban areas are retained. This in effect splits urban areas that could be joined in the United States. With the relatively smaller degree of urbanization in Canada, the impact of this difference is cushioned and is probably restricted to the area around Toronto. - The urban area thresholds for defining micropolitan and census agglomerations are the same (10,000). Therefore, taken together there is no impact on the comparability of national statistics. However, the thresholds for metropolitan area creation are different and as a consequence comparability of data for the individual categories is affected. This difference is easily adjusted to support comparability at the national level.
- Target core criteria are very similar. They are defined to support the calculation of forward and reverse commuting used to define the hinterland of metropolitan areas. These criteria also dampen the impact of urban area extent differences on metropolitan area delineation between the two countries where the differences in urban area extent may influence the timing of when a community becomes part of the target core. Overall impact at the national level is limited but for individual metropolitan areas it may contribute to a more pronounced difference.
- The commuting data and threshold percentages used in both countries have more-or-less been calibrated similarly and reflect differences in the geographic building block. In short, the apparent differences probably in and of themselves do not contribute to differences at the national or individual level of comparison.
- Differences in the geographic building block may have a cumulative impact on the comparability at the national level and for individual metropolitan areas. This is based on collaborative work undertaken in 1990 between Statistics Canada and the United States Bureau of the Census to quantify the differences in metropolitan areas as a result of differences in the methodologies between the two countries6. Although limited with respect to the number of metropolitan areas investigated, the work indicates that metropolitan areas delineated in the United States using counties are larger than they would be if a municipal level building block were used. However, the results also indicate that under bounding takes place where parts of counties would be included in a metropolitan area if a smaller more precise building block like municipalities were used. Conversely, in Canada large counties, particularly in the west, were excluded when using the county as the building block. However, the criteria used in the United States have been changed since 1990 and no longer use density criteria in combination with commuting data to delineate the hinterland. In short, the cumulative effect is difficult to assess without empirical data to measure the impact of these differences.
- Merger criteria differ and as a result have an impact on national and individual comparisons. As noted above in the Toronto example, CA merger would not take place using the American criteria. There are eleven other CMAs in Canada where CA merger takes place. Nationally this adds over 700,000 persons to CMAs or about 4%.
- Sub-centers (metropolitan divisions) are not defined in Canada. This does not directly impact either national data comparability or individual metropolitan area comparability between the two countries, but it does hide metropolitan complexity in Canada and does restrict this level of comparability.
- Consolidation or combining of metropolitan areas is in part reflected in the merger criteria used in Canada. As a result, although CAs would not be included in individual CMAs using the American criteria, they would in many instances be included under the combining criteria. The interplay of these two aspects of the methodologies means that in Canada individual CMAs would be smaller if the American methodology were adopted but would be reflected in part using the combining criteria which begins to delineate metropolitan regions. However, the exclusion of CMA to CMA mergers of consolidation in Canada means there is currently no direct off-the-shelf comparability for these delineations between Canada and the United States.
- There are three groups of best comparisons of Canadian CMAs with United States metropolitan statistical areas (see Table 3.3.1). Despite the measurement questions, the first group can be compared one for one. The second group has CA mergers. Whether or not these would be mergers when applying United States criteria has not been verified but, based on assessment of the Toronto CMA, likely not. Therefore the best comparison is with combined statistical areas. The third group is like the second except that in this group, CMA with CMA linking could be a possibility. These CMAs need to be carefully assessed in order to generate an appropriate comparison.
Comparison of Canadian census metropolitan areas with United States metropolitan statistical areas
Notes:
1. Additional details on the material presented in this section can be obtained from the following: Census metropolitan area/census agglomeration program: a review, 1941-1981, Grafton Ross, Geography Working Paper No. 8, 1984, 99-978; 2001 Census Dictionary, Statistics Canada, 2002, 92-378-XPE.
2. A census agglomeration (CA) is a smaller version of the CMA. A CA has an urban core of at least 10,000 but does not meet the CMA threshold criteria. Delineation methodology is the same as that for CMA since the 1981 Census.
3. Use of population counts for this comparison is overly simplistic since the impact on the characteristics of the population or economic implications of areas added are not taken into account.
4. A block is an area formed by the intersection of roads and the boundaries of geographic areas used to disseminate census data.
5.In preparing this comparison, I relied almost exclusively on the documentation provided by the Federal Registry concerning the 2000 review of the standard for defining metropolitan areas for the content and rules for the United States.
6. Paper presented at the Population Association of America Conference held May 3-5, 1990 in Toronto, Ontario, Canada – Metropolitan Area Delineation: A Canadian - U.S. Comparison, by Richard A. Nadwodny and Henry A. Puderer (Statistics Canada) and Richard L. Forstall (U.S. Bureau of the Census).