Investment in non-residential building construction

Archived Content
Information identified as archived is provided for reference, research or recordkeeping purposes. It is not subject to the Government of Canada Web Standards and has not been altered or updated since it was archived. Please "contact us" to request a format other than those available.
Related subjects
-
[an error occurred while processing this directive]
Investment in non-residential building construction in the fourth quarter was down 0.6% from the previous quarter, to $11.0 billion. This was the second consecutive quarterly decline and largely reflected lower spending in the construction of institutional buildings in seven provinces.
Investment in non-residential building construction
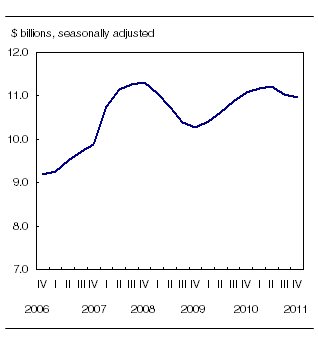
Chart description: Investment in non-residential building construction
Investment fell in four provinces in the fourth quarter. The largest decreases occurred in Ontario and British Columbia. Investment in Ontario fell in all three components, while British Columbia's investment was down in commercial and institutional components.
The largest increases occurred in Alberta, Saskatchewan and Quebec. Increases in commercial investment led the gains in Alberta and Quebec. All three components rose in Saskatchewan.
Investment was down in 18 of the 34 census metropolitan areas. The largest declines occurred in Vancouver and Kitchener–Cambridge–Waterloo, where all three components were down in both census metropolitan areas. Lower commercial investments contributed most to the decline in each.
Note to readers
Unless otherwise stated, this release presents seasonally adjusted data expressed in current dollars, which facilitates comparisons by removing the effects of seasonal variations.
Investments in non-residential building construction exclude engineering construction. This series is based on the Building Permits Survey of municipalities, which collects information on construction intentions.
Work put-in-place patterns are assigned to each type of structure (industrial, commercial and institutional). These work patterns are used to distribute the value of building permits according to project length. Work put-in-place patterns differ according to the value of the construction project; a project worth several million dollars will usually take longer to complete than will a project of a few hundred thousand dollars.
Additional data from the Capital and Repair Expenditures Survey are used to create this investment series. Investments in non-residential building data are benchmarked to Statistics Canada's System of National Accounts of non-residential building investment series.
For the purpose of this release, the census metropolitan area of Ottawa–Gatineau (Ontario/Quebec) is divided into two areas: the Ottawa part and the Gatineau part.
The largest increases were in Montréal, London and Calgary. The increases in Montréal and Calgary were mostly the result of rising commercial investment. In London, the increase resulted from higher institutional investments.
Institutional component
Spending in the institutional component fell 3.7% to $3.2 billion, its seventh consecutive quarterly decline.
Institutional investment fell in seven provinces, with the largest declines in Alberta and British Columbia. The largest contributing factor in both provinces was lower investment in educational buildings.
In Alberta, institutional investment fell 16.4% to $331 million. Spending was down for the seventh consecutive quarter and declined in all institutional categories.
In British Columbia, institutional investment declined 8.8% to $392 million.
The largest increase was in Saskatchewan, where investment rose 12.4% to $117 million, following three consecutive quarters of decline. The largest contibutor to the increase was investment in government buildings.
Commercial, institutional and industrial components
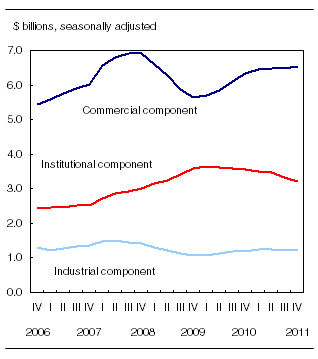
Chart description: Commercial, institutional and industrial components
Commercial component
Investors put $6.5 billion into commercial projects in the fourth quarter, up 0.8% from the previous quarter. In the five provinces posting increases, gains were spread among several commercial construction buildings categories.
The largest contributions in the commercial component came from Alberta, where investment rose 7.5% to $1.6 billion. This was the third consecutive quarterly gain and came mainly from higher spending for construction of office buildings and warehouse and storage facilities. In Quebec, investment increased 4.8% to $1.2 billion, with gains mostly in the construction of retail and wholesale outlets.
Ontario and British Columbia posted the largest declines. Ontario saw commercial investment decline 2.6% to $2.4 billion, mostly from lower construction of recreational buildings and retail and wholesale outlets. In British Columbia, commercial investment declined 7.7% to $705 million, mostly because of lower spending on recreational buildings.
Industrial component
Investment in industrial projects totalled $1.2 billion in the fourth quarter, unchanged from the previous quarter as gains in sixth provinces were offset by declines in the others.
The largest increase was in Alberta, where investment rose 14.0% to $284 million, following a decline in the previous quarter. This increase mostly came from higher investments in maintenance and manufacturing facilities.
The largest declines were in Ontario and Quebec. In Ontario, industrial investment declined 5.5% to $449 million, largely as a result of lower investments in utility buildings and maintenance facilities. In Quebec, spending fell 6.2% to $246 million, mostly the result of lower investment in manufacturing facilities.
Available on CANSIM: table 026-0016.
Definitions, data sources and methods: survey number 5014.
More detailed data on investment in non-residential building construction are also available in free tables online. From the Key resource module of our website, choose Summary tables.
For more information, or to enquire about the concepts, methods or data quality of this release, contact Don Overton (613-951-1239; bdp_information@statcan.gc.ca), Investment and Capital Stock Division.
- Date modified: