Payroll employment, earnings and hours, March 2012 (preliminary data)

Archived Content
Information identified as archived is provided for reference, research or recordkeeping purposes. It is not subject to the Government of Canada Web Standards and has not been altered or updated since it was archived. Please "contact us" to request a format other than those available.
Related subjects
-
[an error occurred while processing this directive]
In March, average weekly earnings of non-farm payroll employees were $888.34, up 0.8% from the previous month. On a year-over-year basis, earnings rose 2.1%.
Year-over-year change in average weekly hours and average weekly earnings
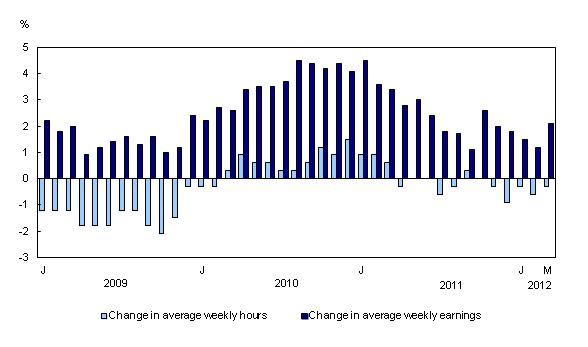
Chart description: Year-over-year change in average weekly hours and average weekly earnings
The 2.1% increase in earnings during the 12 months to March reflects a number of factors, including wage growth and changes in the composition of employment by industry, occupation and level of job experience.
Average hours worked per week can also contribute to changes in earnings. In March, the year-over-year growth in weekly earnings was tempered by a decline in hours worked. March was the fifth consecutive month of year-over-year declines in hours worked.
Non-farm payroll employees worked 32.9 hours per week on average in March, down from 33.0 hours a year earlier, but up from 32.8 hours in February.
Average weekly earnings by sector
Year-over-year growth in average weekly earnings outpaced the national average of 2.1% in four of Canada's largest industrial sectors: professional, scientific and technical services; construction; public administration; and retail trade. Earnings growth in accommodation and food services was on par with the national average.
Year-over-year change in average weekly earnings in the 10 largest sectors, March 2011 to March 2012
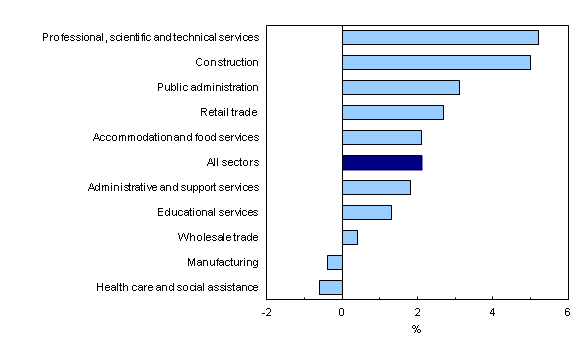
Average weekly earnings in professional, scientific and technical services increased 5.2% to $1,249.39, with the highest growth in management, scientific and technical consulting; accounting, tax preparation, bookkeeping and payroll; and architectural, engineering and related services.
In construction, weekly earnings increased 5.0% to $1,151.79 in the 12 months to March. Growth was widespread across industries in this sector and particularly strong among employees in residential and non-residential building construction.
In public administration, weekly earnings increased 3.1% to $1,136.02, with notable growth in municipal, local and regional public administration as well as provincial-territorial public administration.
In retail trade, one of the lowest-paid sectors on average, weekly earnings were up 2.7% to $526.26. There were notable gains among clothing and clothing accessories stores, as well as electronic and appliance stores.
Earnings for payroll employees in accommodation and food services rose 2.1% to $363.83. This sector remained the lowest paid of all sectors on average.
Average weekly earnings in manufacturing declined 0.4% to $981.46 in March compared with 12 months earlier. There were notable declines in earnings in manufacturing of machinery; furniture and related products; and miscellaneous products such as medical equipment, sporting goods and office supplies.
Weekly earnings of payroll employees in health care and social assistance fell 0.6% to $806.36, as earnings gains in ambulatory services, and nursing and residential care facilities were more than offset by declines in social assistance and hospitals.
Average weekly earnings up in every province
Average weekly earnings increased in every province in the 12 months to March. Growth was above the national average in every province except Ontario and Nova Scotia. Earnings growth was highest in Saskatchewan and Newfoundland and Labrador.
Year-over-year growth in average weekly earnings by province, March 2011 to March 2012
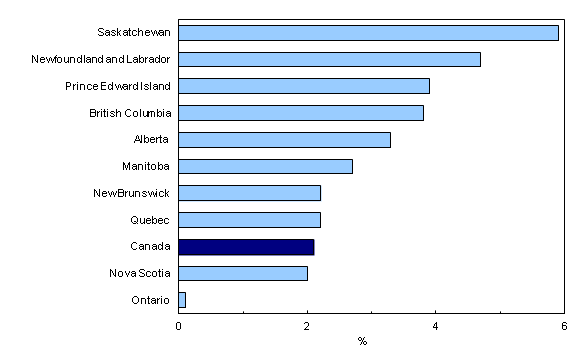
In Saskatchewan, average weekly earnings were $918.15 in March, up 5.9% from 12 months earlier. Earnings in the province have exceeded the national average since August 2011.
Average weekly earnings in Newfoundland and Labrador increased 4.7% from March 2011 to $923.58. Year-over-year growth in earnings in Newfoundland and Labrador has been above the national rate of growth since December 2010, and the earnings level in the province has been higher than the national average since September 2011.
In Prince Edward Island, average weekly earnings rose 3.9% to $754.18, and in British Columbia, earnings were up 3.8% to $864.52.
In Alberta, average weekly earnings in the 12 months to March grew 3.3% to $1,056.87, the highest level in the country.
The lowest year-over-year growth was in Ontario, where average weekly earnings rose 0.1% to $896.61. Growth in the province has been lower than the national average since October 2010.
Non-farm payroll employment by sector
Total non-farm payroll employment increased 49,000 in March. Most sectors showed gains, with the largest in information and culture, manufacturing, construction, education, and retail trade. The only notable job decline was in professional, scientific and technical services.
From March 2011 to March 2012, the total number of non-farm payroll employees rose 1.5% (+219,900). Among all sectors, mining, quarrying and oil and gas extraction posted the highest growth rate, at 4.1%, followed by construction, at 3.8%.
Note to readers
The Survey of Employment, Payrolls and Hours (SEPH) is a business census of non-farm payroll employees. Its key objective is to provide a monthly portrait of the level of earnings, the number of jobs and hours worked by detailed industry at the national, provincial and territorial level.
Statistics Canada also produces employment estimates from its monthly Labour Force Survey (LFS). The LFS is a household survey whose main objective is to divide the working-age population into three mutually exclusive groups: the employed (including the self-employed), unemployed and not in the labour force. This survey is the official source for the unemployment rate and collects data on the socio-demographic characteristics of all those in the labour market.
As a result of conceptual and methodological differences, estimates of changes from SEPH and LFS do differ from time to time. However, the trends in the data are quite similar.
Unless otherwise stated, this release presents seasonally adjusted data, which facilitates comparisons by removing the effects of seasonal variations.
Non-farm payroll employment data are for all hourly and salaried employees, as well as the "other employees" category, which includes piece-rate and commission-only employees.
Average weekly hours data are for hourly and salaried employees only and exclude businesses that could not be classified to a North American Industry Classification System (NAICS) code.
All earnings data include overtime pay and exclude businesses that could not be classified to a NAICS code. Earnings data are based on gross taxable payroll before source deductions.
Average weekly earnings are derived by dividing total weekly earnings by the number of employees.
Available without charge in CANSIM: tables CANSIM table281-0023 to 281-0039 and CANSIM table281-0041 to 281-0049.
Definitions, data sources and methods: survey number survey number2612.
A data table is available from the Key resource module of our website under Summary tables.
Detailed industry data, data by size of enterprise based on employment, and other labour market indicators are available in the monthly publication Employment, Earnings and Hours, Vol. 90, no. 3 (Catalogue number72-002-X, free), now available from the Key resource module of our website, under Publications.
Data on payroll employment, earnings and hours for April will be released on June 28.
For more information, contact Statistics Canada's National Contact Centre (toll-free 1-800-263-1136; 613-951-8116; infostats@statcan.gc.ca).
To enquire about the concepts, methods or data quality of this release, contact Lahouaria Yssaad (613-951-0627), Labour Statistics Division.
- Date modified: