
Chart 3
Direct investment position
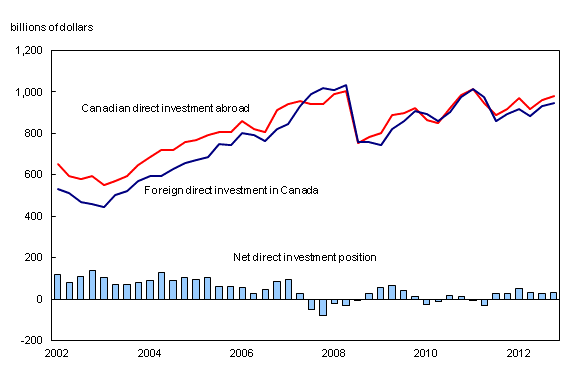
Chart description
The title of the graph is "Direct investment position."
This is a combined line chart.
There are in total 44 categories in the horizontal axis. The vertical axis starts at -200 and ends at 1,200 with ticks every 200 points.
There are 3 series in this graph.
The vertical axis is "billions of dollars."
The units of the horizontal axis are quarters by year from first quarter 2002 to fourth quarter 2012.
The title of series 1 is "Net direct investment."
This series is a column clustered chart.
The minimum value is -80.7 occurring in fourth quarter 2007.
The maximum value is 137.1 occurring in fourth quarter 2002.
The title of series 2 is "Canadian direct investment abroad."
This series is a line chart.
The minimum value is 548.8 occurring in first quarter 2003.
The maximum value is 1,013.5 occurring in first quarter 2011.
The title of series 3 is "Foreign direct investment in Canada."
This series is a line chart.
The minimum value is 443.1 occurring in first quarter 2003.
The maximum value is 1,032.1 occurring in second quarter 2008.
| Net direct investment | Canadian direct investment abroad | Foreign direct investment in Canada | |
|---|---|---|---|
| first quarter 2002 | 117.5 | 650.3 | 532.8 |
| second quarter 2002 | 82.3 | 593.8 | 511.5 |
| third quarter 2002 | 110.9 | 577.9 | 467.1 |
| fourth quarter 2002 | 137.1 | 595.9 | 458.8 |
| first quarter 2003 | 105.7 | 548.8 | 443.1 |
| second quarter 2003 | 70.4 | 572.4 | 501.9 |
| third quarter 2003 | 71.2 | 595.7 | 524.5 |
| fourth quarter 2003 | 80.9 | 649.4 | 568.6 |
| first quarter 2004 | 89.4 | 684.7 | 595.3 |
| second quarter 2004 | 126.4 | 722.4 | 596.0 |
| third quarter 2004 | 91.2 | 719.0 | 627.9 |
| fourth quarter 2004 | 104.5 | 759.4 | 654.9 |
| first quarter 2005 | 94.2 | 766.6 | 672.4 |
| second quarter 2005 | 106.6 | 792.2 | 685.6 |
| third quarter 2005 | 60.1 | 807.5 | 747.4 |
| fourth quarter 2005 | 62.5 | 806.2 | 743.7 |
| first quarter 2006 | 56.6 | 858.5 | 801.9 |
| second quarter 2006 | 27.4 | 820.6 | 793.2 |
| third quarter 2006 | 45.5 | 808.4 | 762.9 |
| fourth quarter 2006 | 87.5 | 911.2 | 823.8 |
| first quarter 2007 | 96.5 | 943.9 | 847.4 |
| second quarter 2007 | 25.1 | 956.7 | 931.6 |
| third quarter 2007 | -51.8 | 939.7 | 991.5 |
| fourth quarter 2007 | -80.7 | 940.0 | 1,020.7 |
| first quarter 2008 | -19.5 | 988.8 | 1,008.3 |
| second quarter 2008 | -28.2 | 1,003.9 | 1,032.1 |
| third quarter 2008 | -1.8 | 755.2 | 757.1 |
| fourth quarter 2008 | 25.2 | 784.7 | 759.5 |
| first quarter 2009 | 58.7 | 801.3 | 742.6 |
| second quarter 2009 | 65.3 | 889.0 | 823.6 |
| third quarter 2009 | 41.8 | 899.8 | 858.0 |
| fourth quarter 2009 | 14.3 | 921.3 | 907.0 |
| first quarter 2010 | -26.8 | 867.0 | 893.8 |
| second quarter 2010 | -9.4 | 849.8 | 859.2 |
| third quarter 2010 | 16.5 | 922.3 | 905.7 |
| fourth quarter 2010 | 10.7 | 985.6 | 975.0 |
| first quarter 2011 | -2.4 | 1,013.5 | 1,015.9 |
| second quarter 2011 | -30.0 | 945.4 | 975.4 |
| third quarter 2011 | 25.0 | 886.9 | 861.9 |
| fourth quarter 2011 | 26.6 | 918.2 | 891.6 |
| first quarter 2012 | 52.4 | 972.4 | 919.9 |
| second quarter 2012 | 30.1 | 915.7 | 885.6 |
| third quarter 2012 | 28.1 | 959.1 | 931.0 |
| fourth quarter 2012 | 32.1 | 980 | 947.9 |
- Date modified: