
Smooth new lines
You might have noticed that some of StatCan's key economic charts contain new information.
The new line that is appearing in certain charts in The Daily is called the trend-cycle, and it looks like this:
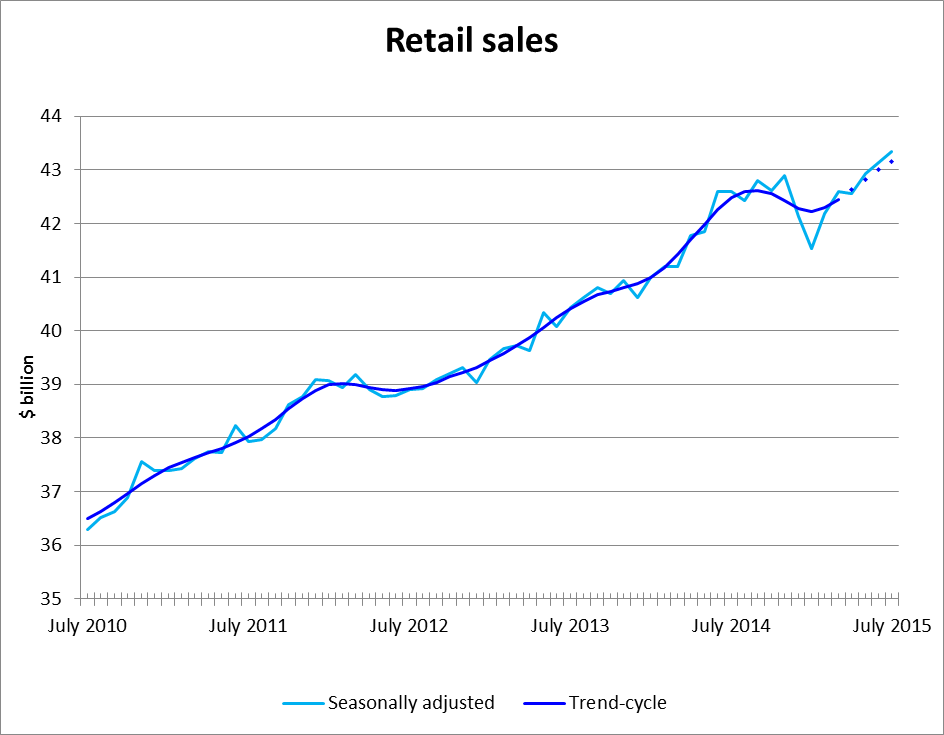
Description for Figure 1
| $ billion | ||
|---|---|---|
| Seasonally adjusted | Trend-cycle | |
| *preliminary estimate | ||
| July 2010 | 36.295 | 36.51 |
| August 2010 | 36.515 | 36.64 |
| September 2010 | 36.633 | 36.79 |
| October 2010 | 36.880 | 36.97 |
| November 2010 | 37.568 | 37.15 |
| December 2010 | 37.393 | 37.30 |
| January 2011 | 37.392 | 37.45 |
| February 2011 | 37.438 | 37.55 |
| March 2011 | 37.617 | 37.64 |
| April 2011 | 37.755 | 37.73 |
| May 2011 | 37.724 | 37.81 |
| June 2011 | 38.228 | 37.92 |
| July 2011 | 37.926 | 38.03 |
| August 2011 | 37.977 | 38.18 |
| September 2011 | 38.182 | 38.34 |
| October 2011 | 38.624 | 38.54 |
| November 2011 | 38.780 | 38.74 |
| December 2011 | 39.088 | 38.89 |
| January 2012 | 39.069 | 38.99 |
| February 2012 | 38.942 | 39.02 |
| March 2012 | 39.179 | 39.00 |
| April 2012 | 38.906 | 38.94 |
| May 2012 | 38.774 | 38.90 |
| June 2012 | 38.798 | 38.89 |
| July 2012 | 38.901 | 38.91 |
| August 2012 | 38.918 | 38.96 |
| September 2012 | 39.083 | 39.04 |
| October 2012 | 39.203 | 39.14 |
| November 2012 | 39.314 | 39.22 |
| December 2012 | 39.041 | 39.31 |
| January 2013 | 39.467 | 39.44 |
| February 2013 | 39.673 | 39.56 |
| March 2013 | 39.731 | 39.72 |
| April 2013 | 39.624 | 39.88 |
| May 2013 | 40.337 | 40.06 |
| June 2013 | 40.078 | 40.25 |
| July 2013 | 40.428 | 40.41 |
| August 2013 | 40.612 | 40.54 |
| September 2013 | 40.802 | 40.67 |
| October 2013 | 40.689 | 40.73 |
| November 2013 | 40.929 | 40.80 |
| December 2013 | 40.627 | 40.88 |
| January 2014 | 40.987 | 41.00 |
| February 2014 | 41.196 | 41.19 |
| March 2014 | 41.196 | 41.41 |
| April 2014 | 41.766 | 41.70 |
| May 2014 | 41.840 | 41.98 |
| June 2014 | 42.591 | 42.27 |
| July 2014 | 42.585 | 42.48 |
| August 2014 | 42.419 | 42.59 |
| September 2014 | 42.799 | 42.61 |
| October 2014 | 42.619 | 42.55 |
| November 2014 | 42.886 | 42.43 |
| December 2014 | 42.124 | 42.28 |
| January 2015 | 41.523 | 42.22 |
| February 2015 | 42.184 | 42.30 |
| March 2015 | 42.585 | 42.45 |
| April 2015 | 42.564 | 42.63* |
| May 2015 | 42.937 | 42.82* |
| June 2015 | 43.129 | 43.00* |
| July 2015 | 43.345 | 43.16* |
Information on the trend-cycle helps users to get a better sense of longer-term movements in the economic data. It removes the impact of short-term, irregular fluctuations in economic activity that can affect seasonally adjusted data—the official estimates that are reported in many economic releases. With trend-cycle data, the minor twists and turns in the road are not as apparent. Trend-cycle estimates can make it easier to analyze the underlying behaviour of a data series over time.
Seeing the big picture
Does this mean that Statistics Canada wants users to think big picture? In some cases, yes. For instance, analysts working on the Labour Force Survey have long advised users to look at long-term patterns in the employment data, rather than focusing solely on recent month-to-month movements. Looking at the trend-cycle line can provide a better guide to the substantive movements in the series, and may prove useful for business-planning decisions and policy advice.
"It is a tool that certainly can aid in the analysis and interpretation of recent movements in the data. Trend-cycles are designed to help users identify longer-term patterns in many of these data series," says Guy Gellatly, who collaborated with Susie Fortier, chief of the Time Series Research and Analysis Centre, to help launch the trend-cycle project.
Trend-cycle lines will now be presented alongside the official seasonally adjusted data for several key monthly indicators: employment from the Labour Force Survey, manufacturing sales, retail and wholesale sales, building permits, and sales at food services and drinking places. In the future, trend-cycle estimates from other surveys may be added.
Introducing trend-cycles
There were a few important considerations along the way to introducing trend-cycle lines and ensuring an up-to-date methodology.
After checking out the international trend-cycle scene (Australia's and New Zealand's national statistics agencies are big proponents), and consulting with frequent users and Daily readers, the trend-cycle project team turned to the question of how best to serve Canadian users.
For one, it was necessary to keep the seasonally adjusted data front and centre—the seasonally adjusted data reported and discussed in The Daily are still the official economic estimates. Seasonal adjustment is used to remove the effect of seasonal and calendar-based events from the economic data StatCan publishes—events that occur at about the same time, and in about the same magnitude, every year (like Christmas). Seasonally adjusted data contain information on both the trend-cycle and what economists call the irregular factors in the data—movements caused by unanticipated or extraordinary events, such as strikes, disruptions or unusual weather patterns.
Statistics Canada routinely makes both seasonally adjusted data and unadjusted data available to the public.
Now, information on the trend-cycle is also being made available. This information will appear graphically in certain charts in The Daily. As well, the formula for calculating the trend-cycle is available on Statistics Canada's website, for users who want to calculate trend-cycle data on their own.
"Information on the trend-cycle really complements the seasonally adjusted and unadjusted data that are currently available," Ms. Fortier says. "It extends what analysts are able to do with the economic data."
A second consideration when working on the development of the trend-cycle data was the potential impact of revisions. Statistical data are often revised as a normal part of the statistical process. To ensure that readers are aware of the possible impact of revisions, trend-cycle data for recent months are reported using a dotted line, to indicate that these data may be affected more by revisions than the data from previous periods.
A further concern was that the trend-cycle might be mistakenly taken as a projection. It is a natural human tendency to assume that the future will be like the past. Ms. Fortier reinforces that this is not the role of trend-cycle data: "These data are not a forecasting tool, and do not incorporate projections about future movements in the data."
Communicating these subtleties is crucial. "A real challenge for us is to make sure that the communications that we put out on this are clear and accessible to users so we do not create any confusion," she adds. For users who would like more technical information, an in-depth explanation of trend-cycle data, which includes information on how to calculate these estimates, is available in the Behind the Data module on the Statistics Canada website. Enthusiasts can recreate trend-cycle lines and delve more deeply into how smoothing the data can help make the big picture clearer.
Login/register to post comments.
Recent posts
-
 1904 people recommended this
 -
 2551 people recommended this
 -
 2925 people recommended this