
Statistics Canada
www.statcan.gc.ca
Common menu bar links
(Note: Content area on this page may be wider than usual.)
Canadian Health Measures Survey (CHMS)
Data User Guide: Cycle 1
April 2011
Acknowledgements
Statistics Canada relies heavily on the cooperation and good will of survey participants who donate their time. That is why the team of the Canadian Health Measures Survey (CHMS) is extremely grateful to participants for helping it collect key information relevant to the health of Canadians. This information will contribute to decision-making that will guide future health care policies and public health programs that will affect Canadians for years to come.
Statistics Canada and the team of the CHMS would also like to thank their partners, Health Canada and the Public Health Agency of Canada, for their support, cooperation and guidance.
On behalf of everyone working on the CHMS, Statistics Canada would like to extend its sincere appreciation for the time, effort and expertise that the CHMS advisory committee members have contributed in the development of this unique and ground breaking survey.
We would also like to thank all those who contributed to the preparation of this document.
Table of contents
1. Introduction
2. Canadian Health Measures Survey (CHMS) background and objectives
2.1 CHMS background
2.2 CHMS objectives
3. Survey approval
3.1 Authority
3.2 Ethical protocols and privacy standards
4. Survey content
5. Sample design
5.1 Target population
5.2 Sample size and allocation
5.3 Sampling frames and sampling strategy
5.3.1 Sampling of collection sites
5.3.2 Dwelling sampling
5.3.2.1 Fasted sub-sampling
5.3.2.2 Polybrominated diphenyl ether (PBDE) / Polychlorinated biphenyls (PCB) sub-sampling
5.3.2.3 Inorganic mercury sub-sampling
5.3.2.4 Perfluorinated sub-sampling
5.3.2.5 Phthalates sub-sampling
5.3.3 Respondent sampling
5.3.3.1 Activity monitor sub-sampling
5.3.3.2 Tobacco sub-sampling
6. Data collection
6.1 Preparation for collection
6.1.1 The Canadian Health Measures Survey (CHMS) team
6.1.1.1 Field team
6.1.1.2 Mobile examination centre (MEC) team
6.1.1.3 Head office staff
6.1.2 The mobile examination centre (MEC)
6.1.3 Informatics environment
6.1.4 Questionnaire design
6.1.4.1 Household questionnaire
6.1.4.2 Clinic questionnaire
6.1.4.3 Pre-test
6.2 Collection
6.2.1 Collection – Household interview
6.2.2 Collection – Mobile examination centre (MEC)
6.2.3 Collection – Home visit
6.3 Minimizing non-response
6.3.1 Minimizing non-response – Household interview
6.3.1.1 Introductory letters and brochures
6.3.1.2 Initiating contact
6.3.1.3 Refusal procedures – Household interview
6.3.1.4 Language barriers – Household interview
6.3.1.5 Youth respondents – Household interview
6.3.1.6 Proxy interviews
6.3.2 Minimizing non-response – Mobile examination centre (MEC)
6.3.2.1 Non-response follow-up
6.3.2.2 Flexible MEC hours
6.3.2.3 Refusal procedures - MEC
6.3.2.4 Language barriers - MEC
6.3.2.5 Youth respondents - MEC
6.4 Clinic measures protocols
6.4.1 Anthropometry
6.4.1.1 Standing height
6.4.1.2 Sitting height
6.4.1.3 Weight
6.4.1.4 Waist circumference
6.4.1.5 Hip circumference
6.4.1.6 Skinfolds
6.4.2 Heart rate and blood pressure
6.4.3 Spirometry
6.4.4 Musculoskeletal fitness
6.4.4.1 Grip strength component
6.4.4.2 Sit and reach component
6.4.4.3 Partial curl-up component
6.4.5 Modified Canadian Aerobic Fitness Test (mCAFT) component
6.4.6 Oral health component
6.4.7 Physical activity monitor
6.5 Laboratory measures protocols
6.5.1 Sample collection
6.5.1.1 Blood collection
6.5.1.2 Urine collection
6.5.2 Analysis of CBC performed at the mobile examination centre (MEC)
6.5.3 Processing and storage of the blood and urine samples
6.5.4 Shipping
7. Data processing
7.1 Verification
7.2 Mark-all-that-apply questions
7.3 Coding
7.4 Editing
7.5 Creation of derived variables
7.6 Limit of detection
7.7 Reference ranges
8. Data file structure
8.1 Description of data files
8.1.1 Wave 1: Master file
8.1.2 Wave 2: Master file
8.1.3 Wave 2: Fasted sub-sample file
8.1.4 Wave 3: Master file
8.1.5 Wave 3: Sub-sample files
8.1.6 Wave 4: Master file
8.1.7 Wave 4: Activity Monitor sub-sample file
8.1.8 Supplementary Data release: Master file
8.1.9 Supplementary Data release: Medication File
8.1.10 Supplementary Data release: Sub-sample files
8.2 Key variables for linking data files
8.3 Key variables and definitions
9. Weighting
9.1 Selection weights for collection sites
9.2 Selection weights for dwellings
9.3 Removal of out-of-scope units
9.4 Household non-response
9.5 Creation of the person weight
9.6 Non-response at the questionnaire level
9.7 Non-response at the MEC level
9.8 Winsorization
9.9 Calibration
9.10 Fasted sub-sample
9.11 Polybrominated diphenyl ether (PBDE) / Polychlorinated biphenyls (PCB) sub-sample
9.12 Inorganic mercury sub-sample
9.13 Perfluorinated compounds sub-sample
9.14 Activity monitor sub-sample
9.15 Phthalates sub-sample
9.16 Tobacco sub-sample
10. Data quality
10.1 Response rate
10.1.1 Blood draw and Urine response rate
10.1.2 Fasted sub-sample response rate
10.1.3 Polybrominated diphenyl ether (PBDE) / Polychlorinated biphenyls (PCB) sub-sample response rates
10.1.4 Inorganic mercury sub-sample response rates
10.1.5 Perfluorinated compounds sub-sample response rates
10.1.6 Activity monitor sub-sample response rates
10.1.7 Phthalates sub-sample response rates
10.1.8 Tobacco sub-sample response rate
10.2 Errors in surveys
10.2.1 Non-sampling errors
10.2.2 Sampling errors
10.3 Quality assurance and control
10.3.1 Training of household interview and mobile examination centre (MEC) Staff
10.3.1.1 Initial training
10.3.1.2 Dress rehearsal
10.3.1.3 Ongoing training – Dry run day
10.3.1.4 Annual retraining
10.3.2 Household component
10.3.2.1 Monitoring – Household interview
10.3.2.2 Household questionnaire response rates.
10.3.2.3 Validation of questionnaire responses.
10.3.3 Mobile examination centre (MEC) component
10.3.3.1 Equipment selection
10.3.3.2 Protocols and procedures
10.3.3.3 Mobile examination centre (MEC) environment
10.3.3.4 Adherence to pre-testing guidelines
10.3.3.5 Equipment monitoring
10.3.3.6 Data entry verification
10.3.3.7 Spirometry data review
10.3.3.8 Data validation
10.3.3.9 Mobile examination centre (MEC) laboratory
10.3.3.10 Replicate Testing
10.3.3.11 Proficiency Testing
10.3.3.12 Processing and storage of the blood and urine samples
10.3.3.13 Shipping
10.3.3.14 Field Blanks
10.3.3.15 Activity Monitor Data Review
10.3.4 Head Office
10.3.4.1 Correcting for bias
11. Guidelines for tabulation, analysis and release
11.1 Rounding guidelines
11.2 Sample weighting guidelines for tabulation
11.3 Precise variances or coefficients of variation
11.4 Some Recommendations for doing analysis with data from Cycle 1 of CHMS
12. File Usage
12.1 Use of weight variable
12.2 Environment Canada Climate and Air Quality File
12.3 Variable naming convention
12.3.1 Positions 1 to 3: Module section name
12.3.2 Position 4: Place Holder or Variable Type
12.3.3 Positions 6 to 8: Question reference
12.4 Access to Master file data
12.5 Variable Concordance
12.6 Special notes
13. References and end notes
Appendix 1 Pre-testing Guidelines
Appendix 2 Exclusion Criteria
Appendix 3 PAR-Q
Appendix 4 Canadian Health Measure Survey cycle 1 protocols
Appendix 5 Derived variable documentation
Appendix 6 Questionnaires
Appendix 7 Record layout
Appendix 8 Concordance table
Appendix 9 Response rates
1. Introduction
The Canadian Health Measures Survey (CHMS) is a new, comprehensive, direct health measures survey, developed to address important data gaps and limitations in existing health information. It is being conducted by Statistics Canada in partnership with Health Canada and the Public Health Agency of Canada. The results will provide comprehensive health information to advance health surveillance and research in Canada.
For cycle 1 of the CHMS directly measured indicators of health and wellness were collected on a representative sample of approximately 5,600 Canadians aged 6 to 79 years. The survey consisted of an in-home general health interview followed by a visit to a mobile examination centre (MEC). Reference laboratories and the MEC laboratory analyzed biological specimens for indicators of general health, chronic disease, infectious disease, nutritional status and environmental biomarkers.
This document will provide information to data users about the complexity of the data and any limitations that could affect their use. It will explain the methods and concepts used to collect the data at the household, as well as the MEC. Subsequent sections of the document contain information about data processing and the creation of derived variables. Content regarding sampling and weighting methodology, and guidelines for the creation of tabulations have also been included to assist the data user. Quality assurance and quality control information is provided to describe characteristics of the data which might limit their usefulness or interpretation. The document concludes with a series of appendices which provide supporting information that will be helpful to users of the CHMS data files.
All references and end notes will be found in section 13.
For additional information about the Canadian Health Measures Survey:
Toll-free number: 1-888-253-1087
E-mail: chms-ecms@statcan.gc.ca
Telecommunication device for the hearing impaired: 1-866-753-7083
Statistics Canada website: www.statcan.gc.ca/chms
2. Canadian Health Measures Survey (CHMS) background and objectives
2.1 CHMS background
Policy makers, provincial health departments, researchers and health professionals from many fields have expressed a need for a national, comprehensive source of accurate health measures to assist them in addressing the health needs of all Canadians.
In 2003, Health Canada and the Public Health Agency of Canada supported Statistics Canada in obtaining funding for a 'direct measures' health survey to address longstanding limitations within Canada's health information system. This support was announced in the 2003 federal budget as part of an extension of the Health Information Roadmap Initiative, and permanent funding was secured in the 2008 Federal Budget.
The information collected will create national baseline data on the extent of such major health concerns as obesity, hypertension, cardiovascular disease, exposure to infectious diseases, and exposure to environmental contaminants. In addition, the survey will provide clues about illness and the extent to which many diseases may be undiagnosed among Canadians. The CHMS will enable us to determine relationships between health status and disease risk factors, and to explore emerging public health issues.
2.2 CHMS objectives
Some of the objectives of the CHMS are to:
- estimate the numbers of people with selected health conditions, characteristics and environmental exposures based on direct health measures;
- ascertain relationships among risk factors, health promotion and protection behaviours, and health status; and
- establish a biobank of biospecimens (urine, blood, DNA (Deoxyribonucleic acid)) from a representative sample of Canadians to be used for future research and surveillance.
3. Survey approval
3.1 Authority
The 2003 federal budget funded a national 'direct measures' health survey to be conducted by Statistics Canada in partnership with Health Canada and the Public Health Agency of Canada.
The Canadian Health Measure Survey (CHMS) is a statistical research collection under the federal Statistics Act. Statistics Canada may only collect health information for this purpose and may not use or disclose individual participant information for any other purpose without the written consent of participants.
3.2 Ethical protocols and privacy standards
The cycle 1 of the CHMS was conducted in cooperation with provincial and municipal officials, with the support of health professional associations, and with the highest regard to Canadians' health and safety.
All processes of cycle 1 of the CHMS were reviewed and approved by the Health Canada Research Ethics Board to ensure that internationally recognized ethical standards for human research were met and maintained. In addition, protocols were developed through extensive consultation with recognized experts and were performed in conformance with universal precautions by accredited health professionals.
Participation in this survey was voluntary. The voluntary nature of the survey was stated in the introductory letter, brochure, video, Information and Consent Booklet, and on the CHMS Questions & Answers section on the Statistics Canada website. The documents also emphasized the safety and standards used in all tests. CHMS staff answered any questions respondents may have had regarding the risks of participating in the tests and the use of their data in a nine-point interactive consent process throughout the household health interview and the visit to the mobile examination centre.
Several meetings were also held with the Office of the Privacy Commissioner of Canada and with provincial privacy commissioners regarding CHMS protocols to ensure that participants' privacy rights were protected. A full Privacy Impact Assessment was completed for the CHMS and reviewed through the Office of the Privacy Commissioner of Canada—the authority that continues to provide oversight to the CHMS as well as a complaint route and redress mechanism to CHMS participants.
4. Survey content
Consultation has been an integral part of the planning of the Canadian Health Measures Survey (CHMS). Statistics Canada has undertaken extensive workshops and discussions with many programs, groups, individuals and agencies since March 2000 to gather input on proposed content, data requirements and operational considerations. Some of the groups that have been most instrumental in the content development include Health Canada, the Public Health Agency of Canada, National Health and Nutrition Examination Survey (NHANES), the CHMS Expert Advisory Committee, the CHMS Physician Advisory Committee, the CHMS Laboratory Advisory Committee, the CHMS Quality Assurance and Quality Control Advisory Committee, the CHMS Steering Committee and Statistics Canada's Policy Committee.
The cycle 1 of the CHMS was made up of a household interview and a visit to a mobile examination centre (MEC). The household interview included general demographic information and an in depth health questionnaire. The MEC visit included not only physical measure tests but also the collection of blood and urine samples from respondents. Some samples were analyzed in a laboratory at the MEC, such as the complete blood count (CBC), which includes platelets, red blood count and white blood count. The remaining samples were analyzed at three external reference laboratories. Finally, respondents were asked to wear an activity monitor for the seven days following their visit to the MEC.
The following tables provide detailed lists of household, clinic and laboratory content for the data releases for cycle 1 of the survey. The tables are organized alphabetically by similar themes and subjects to emphasize the relationships and analytical possibilities between the household, clinic and laboratory content. Further information regarding the staggered release of CHMS data can be found in Chapter 8 of this document.
| Theme | Subject | CHMS Age | *Source (Statistics Canada surveys) |
|---|---|---|---|
| Alcohol | Alcohol use | 12 to 79 | CCHS 3.1 |
| NPHS cycle 6 | |||
| Anthropometry | Height and weight | 6 to 79 | CCHS 3.1 |
| NPHS cycle 6 | |||
| Weight change | 18 to 79 | ||
| Chronic conditions | Chronic conditions | 6 to 79 | CCHS 3.1 |
| Phlegm | 6 to 79 | ||
| Drug/Medication use | Illicit drug use | 14 to 79 | CCHS 3.1 |
| Medication use | 6 to 79 | ||
| Environmental exposure | Grooming product use | 6 to 79 | |
| Hobbies | 6 to 79 | ||
| Housing characteristics | 6 to 79 | ||
| Family medical history | Family medical history | 6 to 79 | |
| General health | General health | 6 to 79 | CCHS 3.1 |
| NPHS cycle 6 | |||
| Health utility index | 6 to 79 | CCHS 3.1 |
|
| NPHS cycle 6 | |||
| NLSCY cycle 6 | |||
| Strengths and difficulties | 6 to 17 | ||
| Infection markers | Hepatitis | 6 to 79 | |
| Nutrition | Dietary fat consumption | 6 to 79 | |
| Grains, fruits and vegetables consumption | 6 to 79 | ||
| Meat and fish consumption | 6 to 79 | ||
| Milk and dairy product consumption | 6 to 79 | ||
| Salt consumption | 6 to 79 | ||
| Water and soft drink consumption | 6 to 79 | NPHS cycle 6 | |
| Oral health | Oral health | 6 to 79 | |
| Physical activity | Children's physical activity | 6 to 11 | CCHS 2.2 |
| Physical activities | 12 to 79 | CCHS 3.1 | |
| NPHS cycle 6 | |||
| Sedentary activities | 12 to 79 | CCHS 3.1 | |
| Pregnancy/Birth | Birth information | 6 to 11 | NLSCY cycle 6 |
| Breastfeeding information | 6 to 11 | CCHS 3.1 | |
| NLSCY cycle 6 | |||
| Maternal breastfeeding | 14 to 79 (F only) | CCHS 3.1 | |
| Pregnancy | 14 to 59 (F only) | NPHS cycle 6 | |
| Pregnancy information | 6 to 11 | NLSCY cycle 6 | |
| Sexual health | Sexual behaviour | 14 to 79 | CCHS 3.1 |
| Sleep | Sleep | 6 to 79 | CCHS 3.1 |
| NPHS cycle 6 | |||
| Smoking | Exposure to second-hand smoke | 6 to 79 | CCHS 3.1, |
| CTUMS cycle 1 | |||
| Smoking | 12 to 79 | CCHS 2.2 | |
| CCHS 3.1 | |||
| NPHS cycle 1, CTUMS cycle 1 | |||
| Socio-demographic characteristics | Education | 15 to 79 | CCHS 3.1 |
| NPHS cycle 6 | |||
| Income | 6 to 79 | CCHS 3.1 | |
| NPHS cycle 6 | |||
| Labour force activity | 15 to 75 | CCHS 3.1 | |
| NPHS cycle 6 | |||
| Socio-demographic characteristics | 6 to 79 | CCHS 3.1 | |
| Sun exposure | Sun exposure | 6 to 79 | CCHS 3.1 |
| * Where no survey name is listed, the CHMS is the only survey at Statistics Canada to collect this information. Otherwise, the CHMS has used content directly from, or similar to, the surveys listed in the table. CCHS = Canadian Community Health Survey NPHS = National Population Health Survey NLSCY = The National Longitudinal Survey of Children and Youth CTUMS = Canadian Tobacco Use Monitoring Survey |
|||
| Theme | Subject | CHMS Age |
|---|---|---|
| Anthropometry | Hip circumference | 6 to 79 |
| Sitting height | 6 to 79 | |
| Skinfolds | 6 to 79 | |
| Standing height | 6 to 79 | |
| Waist circumference | 6 to 79 | |
| Weight | 6 to 79 | |
| Cardiovascular health and fitness | Blood pressure | 6 to 79 |
| Heart rate (resting) | 6 to 79 | |
| Modified Canadian Aerobic Fitness Test (mCaft step test) | 6 to 69 | |
| Lung function | Spirometry | 6 to 79 |
| Musculoskeletal fitness | Hand grip strength | 6 to 79 |
| Partial curl-ups | 6 to 69 | |
| Sit and reach | 6 to 69 | |
| Oral health | Oral health examination | 6 to 79 |
| Physical activity | Accelerometry (activity monitor) | 6 to 79 |
| Specimen collection | ||
| Blood collection | 6 to 79 | |
| Storage of blood and urine | 6 to 79 | |
| Urine collection | 6 to 79 |
| Theme | Subject | CHMS Age |
|---|---|---|
| General screening | Adherence to guidelines | 6 to 79 |
| Physical and health conditions | 6 to 79 | |
| Physical activity readiness (PAR) | 6 to 79 | |
| Other substance confirmation | 14 to 79 | |
| Lung function | Spirometry questions | 6 to 79 |
| Spirometry restriction | 6 to 79 | |
| Oral health | Oral Health questions | 6 to 79 |
| Oral health restriction | 6 to 79 | |
| Specimen collection | Blood collection questions | 6 to 79 |
| Theme | Subject | Blood/Urine | CHMS Age | Reference Laboratory |
|---|---|---|---|---|
| Cardiovascular health | Apolipoprotein A1 | B | 6 to 79 (s) (fasting) | HC |
| Apolipoprotein B | B | 6 to 79 (s) (fasting) | HC | |
| C-reactive protein (high sensitivity) | B | 6 to 79 | HC | |
| Fibrinogen | B | 12 to 79 | HC | |
| High density lipoproteins (HDL) | B | 6 to 79 | HC | |
| Homocysteine | B | 6 to 79 | HC | |
| Low density lipoproteins (LDL) | B | 6 to 79 (s) (fasting) | HC | |
| Total cholesterol | B | 6 to 79 | HC | |
| Total cholesterol/HDL ratio | B | 6 to 79 | HC | |
| Triglycerides | B | 6 to 79 (s) (fasting) | HC | |
| Chemistry panel | Alanine aminotransferase (ALT) | B | 6 to 79 | HC |
| Albumin | B | 6 to 79 | HC | |
| Alkaline phosphatase (ALP) | B | 6 to 79 | HC | |
| Aspartate aminotransferase (AST) | B | 6 to 79 | HC | |
| Bicarbonate (HCO3) | B | 6 to 79 | HC | |
| Calcium | B | 6 to 79 | HC | |
| Chloride | B | 6 to 79 | HC | |
| Creatinine (see Kidney health theme) | ||||
| Gamma glutamyltransaminase (GGT | B | 6 to 79 | HC | |
| Glucose (see Diabetes theme) | ||||
| Lactate dehydrogenase (LD) | B | 6 to 79 | HC | |
| Phosphorus | B | 6 to 79 | HC | |
| Potassium | B | 6 to 79 | HC | |
| Sodium | B | 6 to 79 | HC | |
| Total bilirubin | B | 6 to 79 | HC | |
| Total protein | B | 6 to 79 | HC | |
| Urea (see Kidney health theme) | ||||
| Uric acid | B | 6 to 79 | HC | |
| Diabetes | Glucose | B | 6 to 79 | HC |
| Glycated hemoglobin (HbA1c) | B | 6 to 79 | HC | |
| Insulin | B | 6 to 79 (s) (fasting) | HC | |
| Environmental Exposure | Bisphenol A | U | 6 to 79 (s) | INSPQ |
| Cotinine - Free | U | 6 to 79 | INSPQ | |
| Metals: | ||||
| Antimony | U | 6 to 79 | INSPQ | |
| Arsenic (total) | B&U | 6 to 79 | INSPQ | |
| Cadmium | B&U | 6 to 79 | INSPQ | |
| Copper | B&U | 6 to 79 | INSPQ | |
| Lead | B&U | 6 to 79 | INSPQ | |
| Manganese | B&U | 6 to 79 | INSPQ | |
| Mercury (total) | B | 6 to 79 | INSPQ | |
| Mercury Inorganic | B | 6 to 79 (s) | INSPQ | |
| Mercury Inorganic | U | 6 to 79 | INSPQ | |
| Molybdenum | B&U | 6 to 79 | INSPQ | |
| Nickel | B&U | 6 to 79 | INSPQ | |
| Selenium | B&U | 6 to 79 | INSPQ | |
| Uranium | B&U | 6 to 79 | INSPQ | |
| Vanadium | U | 6 to 79 | INSPQ | |
| Zinc | B&U | 6 to 79 | INSPQ | |
| Organochlorine pesticides | B | 20 to 79 (s) (fasting) | INSPQ | |
| Organophosphate pesticides | U | 6 to 79 (s) | INSPQ | |
| Perfluorinated compounds (PFHxS, PFOS, PFOA) | B | 20-79 (s) | INSPQ | |
| Phenoxy herbicides (2,4-D, 2,4 DCP) | U | 6 to 79 (s) | INSPQ | |
| Polychlorinated biphenyls (PCBs) | B | 20 to 79 (s) (fasting) | INSPQ | |
| Polybrominated biphenyls (PBBs) | B | 20 to 79 (s) (fasting) | INSPQ | |
| Polybrominated diphenyl ethers (PBDEs) | B | 20 to 79 (s) (fasting) | INSPQ | |
| Phthalate metabolites | U | 6 to 49 | INSPQ | |
| Pyrethroid pesticides | U | 6 to 79 | INSPQ | |
| General | Complete blood count (CBC): | |||
| Platelets | B | 6 to 79 | MEC | |
| Red blood count: | B | 6 to 79 | MEC | |
| Haematocrit | B | 6 to 79 | MEC | |
| Haemoglobin | B | 6 to 79 | MEC | |
| Mean corpuscular haemoglobin (MCH) | B | 6 to 79 | MEC | |
| Mean corpuscular haemoglobin concentration (MCHC) | B | 6 to 79 | MEC | |
| Mean corpuscular volume (MCV) | B | 6 to 79 | MEC | |
| Red cell distribution width (RDW) | B | 6 to 79 | MEC | |
| White blood count: | B | 6 to 79 | MEC | |
| Basophils | B | 6 to 79 | MEC | |
| Eosinophils | B | 6 to 79 | MEC | |
| Lymphocytes | B | 6 to 79 | MEC | |
| Monocytes | B | 6 to 79 | MEC | |
| Neutrophils | B | 6 to 79 | MEC | |
| Infection markers | Hepatitis A (anti HAV) | B | 14 to 79 | NML |
| Hepatitis B (anti HBs and anti HBc) | B | 14 to 79 | NML | |
| Hepatitis B (HBsAg; positive anti HBc only) | B | 14 to 79 (s) | NML | |
| Hepatitis C (anti HCV) | B | 14 to 79 | NML | |
| Kidney health | Creatinine | B&U | 6 to 79 | HC (on blood-chemistry panel)/INSPQ on urine |
| Microalbumin | 6 to 79 | HC | ||
| Microalbumin/creatinine ratio | 6 to 79 | HC | ||
| Urea | B | 6 to 79 | HC | |
| Nutritional status | Red blood cell folate | B | 6 to 79 | HC |
| Iodine | U | 6 to 79 | HC | |
| Iodine/creatinine ratio | U | 6 to 79 | HC | |
| Vitamin B12 | B | 6 to 79 | HC | |
| Vitamin D | B | 6 to 79 | HC | |
| (s) = subgroup (some laboratory tests are only done on a random subgroup of the age range indicated) HC = Health Canada INSPQ = Institut national de santé publique du Québec MEC = Mobile examination centre NML = National Microbiology Laboratory, Public Health Agency of Canada |
||||
5. Sample design
5.1 Target population
The Canadian Health Measures Survey (CHMS) targets the population aged 6 to 79 living at home and residing in the 10 provinces and three territories. Excluded from the scope of the survey are persons living on reserves or in other Aboriginal settlements in the provinces, institutional residents, and full-time members of the Canadian Forces. Persons living in certain remote areas and persons living in areas with a low population density are also excluded. The CHMS covers approximately 96.3% of the Canadian population aged 6 to 79.
5.2 Sample size and allocation
To produce reliable estimates at the national level by age group and sex, it was determined that this survey must be carried out on a sample of at least 5,000 persons over a two-year period: a minimum size of 500 is necessary for each sex from the following five age groups: ages 6 to 11, 12 to 19, 20 to 39, 40 to 59 and 60 to 79.
5.3 Sampling frames and sampling strategy
To meet the requirements of the CHMS, a multistage sampling strategy was used.
5.3.1 Sampling of collection sites
Because the CHMS requires that participants report to a mobile examination centre (MEC), they should be able to travel to that clinic within a reasonable period of time. To accommodate these requirements, the Labour Force Survey (LFS) sampling frame was used to create the collection sites and control their size. Using the LFS frame clusters, 257 collection sites were created. The clusters are small geographic units that contain approximately 200 dwellings. A collection site is a geographic area with a population of at least 10,000 and a maximum respondent travel distance of 50 kilometres in urban areas and 100 kilometres in rural areas. Areas not meeting these criteria were excluded. The sites cover 96.3% of the Canadian population aged 6 to 79.
Although only national estimates were required, the collection sites were stratified into five regions to ensure that the allocation of the sample was representative of the national population. The regions identified, based on Statistics Canada's standard regional boundaries, were British Columbia, the Prairies (Alberta, Manitoba and Saskatchewan), Ontario, Quebec and the Atlantic provinces (Newfoundland and Labrador, Prince Edward Island, Nova Scotia and New Brunswick).
A large number of collection sites with few respondents is recommended because it helps optimize the precision of the estimates. However, the logistical and cost constraints associated with the use of MEC restricted the number of collection sites to 15. The 15 collection sites were allocated to the regions in proportion to the size of the population (Table 5.1).
| Region | Estimated target population, ages 6 to 79, 2001 Census | Number of sites in region | Number of sites allocated |
|---|---|---|---|
| Atlantic | 2,061,425 | 36 | 1 |
| Quebec | 6,560,375 | 50 | 4 |
| Ontario | 10,248,545 | 61 | 6 |
| Prairies (including Yellowknife) | 4,538,970 | 77 | 2 |
| British Columbia (including Whitehorse) |
3,540,000 | 33 | 2 |
| Total | 26,949,315 | 257 | 15 |
Within each region, the collection sites were sorted according to whether they belonged to a census metropolitan area (CMA), and then by the size of the population before the selection took place. A CMA is an area consisting of one or more adjacent municipalities centering on a large urban area (known as an urban core). The urban core must have a population of at least 100,000 to form a CMA. The collection sites were then sampled systematically with a probability of selection proportional to the size of their population. This selection method, combined with the sorting of sites by CMA and non-CMA and by population size, ensured that the sites selected would be allocated among CMA and non-CMA areas and among areas with larger and smaller populations. While not every province/territory would have a collection site, the CHMS sites were chosen to represent the Canadian population, east to west, with larger and smaller population densities.
Data collection at the 15 sites was carried out sequentially over two years. The sites were classified to take account of seasonality and the temporal effect, subject to operational and logistical constraints. The temporal effect was corrected by distributing uniformly the number of sites per region between the first year and the second (except for the Atlantic region, where there is only one site).
5.3.2 Dwelling sampling
Several options were examined to determine how best to obtain the required number of participants by age group. The option chosen uses the 2006 Census as a sampling frame. The household composition of dwellings as of May 2006 was available and could be used to develop a design to meet the sample requirements in each age group.
Within each collection site, dwellings with known household composition at the time of the 2006 Census were stratified by the occupants' age at the time of the survey. Five age-group strata were created, corresponding to the five CHMS age groups (6 to 11, 12 to 19, 20 to 39, 40 to 59 and 60 to 79 years). Age was determined based on the starting date of data collection at each site.
- 6 to 11 stratum: dwellings where at least one 6-to-11-year-old is present, else,
- 12 to 19 stratum: dwellings where at least one 12-to-19-year-old is present, else,
- 60 to 79 stratum: dwellings where at least one 60-to-79-year-old is present, else,
- 20 to 39 stratum: dwellings where at least one 20-to-39-year-old is present, else,
- 40 to 59 stratum: dwellings where at least one 40-to-59-year-old is present, else,
- “Other” stratum: dwellings not included in the above-mentioned strata, such as vacant dwellings at the time of the 2006 Census or dwellings with people outside the CHMS age range based on household composition at the time of the 2006 Census.
Each stratum had a high probability of having dwellings inhabited by persons in the desired age groups, whether they were the same occupants or were replaced by a similar household. Within each site, a simple random sample of dwellings was selected in each stratum. The sample size was allocated in each stratum so that, combined with the strategy for sampling participants in the survey, an equal number of respondents by age group was obtained. Each selected dwelling is contacted to draw up a current list of the members of the household, and this list was then used to select survey respondents. To cover new dwellings constructed since the 2006 Census or dwellings missed in the 2006 Census and to reduce undercoverage, dwellings from the Address Register were sampled as well.
Table 5.2 shows the distribution of the number of dwellings selected per site. In all, 9,349 dwellings were selected, with an average of 623 dwellings per site.
| Site | Number of dwellings |
|---|---|
| 1 | 590 |
| 2 | 610 |
| 3 | 611 |
| 4 | 536 |
| 5 | 580 |
| 6 | 626 |
| 7 | 655 |
| 8 | 664 |
| 9 | 656 |
| 10 | 659 |
| 11 | 659 |
| 12 | 654 |
| 13 | 611 |
| 14 | 616 |
| 15 | 622 |
| TOTAL | 9,349 |
Each sampled dwelling was randomly flagged to indicate whether a respondent should be offered a clinic appointment in the morning or in the afternoon. A morning appointment required that respondents fast overnight, whereas shorter eating restrictions were imposed on those with afternoon appointments. This random allocation reduced the potential for bias, which could occur if respondents were permitted to choose their appointment times. During collection, the sampling fractions were adjusted to obtain approximately half of the sample where respondents were selected to be fasted and were actually fasted.
5.3.2.2 Polybrominated diphenyl ether (PBDE) / Polychlorinated biphenyls (PCB) sub-sampling
This sub-sample was actually a subset of the fasted sub-sample. Only respondents aged 20 to 79 (at the time of the household interview) had this measure performed.
5.3.2.3 Inorganic mercury sub-sampling
Each sampled dwelling was randomly flagged to indicate whether a respondent should have the inorganic mercury measure performed. During collection, the sampling fractions were adjusted to be able to obtain 500 males and 500 females aged 6 to 79 (at the time of the household interview). In households where two persons were selected, that is one aged 6 to 11 and one aged 12 to 79, the algorithm was designed to select only one person per household.
5.3.2.4 Perfluorinated compounds sub-sampling
Each sampled dwelling was randomly flagged to indicate whether a respondent should have the perfluorinated compounds measure performed. The original goal was to obtain 250 respondents by sex for the three older age groups (20 to 39, 40 to 59 and 60 to 79) for a total of 1,500 respondents. Starting with site six, the requirements were changed to include all respondents aged 20 to 79 (at the time of the household interview). It was not possible however to go back and to have this component analyzed on leftover blood for the rest of the persons not selected for the first five sites. Therefore, weighting was necessary to take into account the sub-sample of the first five sites.
5.3.2.5 Phthalates sub-sampling
Each sampled dwelling was randomly flagged to indicate whether a respondent would have the phthalates sub-sample performed. All youths 6 to 19 (at the time of the household interview) were to be selected for this measure. Adults 20 to 49 years old were to be selected if they were in households with only one person selected (no 6 to 11 year old in the household). The total number of respondents desired was around 3,000. Note that adults 50 years old and older were excluded for this measure.
5.3.3 Respondent sampling
Different selection probabilities by age group within each stratum were used to ensure that the sampling targets were attained (see Table 5.3). The dwellings selected were contacted to obtain a list of current household members. In each dwelling, one or two people were selected, depending on the household composition. Because children have to be accompanied to the mobile examination centre, two people were selected from households with children aged 6 to 11: one child randomly selected among those aged 6 to 11, and a second person aged 12 to 79. If no 6-to-11-year-olds were living in the household, only one person was selected among the household members aged 12 to 79. The weight vector for the selection of people aged 12 to 79 was designed to avoid large person sampling weights. Since some age groups have a weight that is up to five times higher than that of other age groups, it is possible that a selected person would have a very high sampling weight when there are many household members in a dwelling. Hence, when a specified minimum number of people aged 12 to 79 are living in a household, the weight for each person is reset to 1. In such cases, each household member has an equal chance of being selected. A careful balance of the parameters required for each of the measures put in place was obtained through studies and simulations.
| Stratum1 | Age Group | ||||
|---|---|---|---|---|---|
| 6 to 11 | 12 to 192 | 20 to 39 | 40 to 59 | 60 to 79 | |
6 to 11 stratum |
1 | 5 | 1 | 1 | 1 |
12 to 19 stratum |
1 | 5 | 1 | 1 | 1 |
60 to 79 stratum |
1 | 1 | 1 | 1 | 2 |
20 to 39 stratum |
1 | 1 | 2 | 1 | 1 |
40 to 59 stratum |
1 | 1 | 1 | 2 | 1 |
“Other” stratum |
1 | 5 | 1 | 1 | 1 |
5.3.3.1 Activity monitor sub-sampling
A sub-sample of respondents aged 6 to 79 who had valid data on their activity monitor for 4 days or more was created.
5.3.3.2 Tobacco sub-sampling
A sub-sample of 2,500 clinic participants aged 12 to 79 was randomly selected for the nicotine, NNAL and metabolites sub-sample. The sample was allocated by age group (12 to 19, 20 to 39, 40 to 59 and 60 to 79) and by smoker status derived from the respondents' answers to the household questionnaire (smoker, non-smoker exposed to smoke and non-smoker non-exposed to smoke). The sample was selected among persons who provided urine and consented to storage of their urine sample for future health studies.
6. Data collection
6.1 Preparation for collection
6.1.1 The Canadian Health Measures Survey (CHMS) team
The CHMS team is a diverse well-trained, experienced group of individuals. The group can be subdivided into three sub-teams: field team, mobile examination centre (MEC) team, and head office staff. Each of these three sub-teams was responsible for specific portions of the survey.
6.1.1.1 Field teamThe CHMS field team was comprised of Statistics Canada household interviewers and an interviewer manager. The household interviewers were primarily responsible for contacting selected households, conducting the household interview, explaining the clinic portion of the survey to respondents and attempting to secure their participation at the MEC. The CHMS interviewers were supervised by an interviewer manager who was responsible for conducting data quality assurance activities for the household component, overseeing the non-response follow-up and monitoring the household collection rates.
6.1.1.2 Mobile examination centre (MEC) teamThe CHMS MEC team consisted of health professionals responsible for various components of the physical measures testing and a site manager who oversaw the day-to-day operation of the MEC. The health measures specialists were responsible for performing the majority of physical measures tests on respondents (e.g., blood pressure, anthropometry, fitness testing, spirometry). The laboratory technologists/phlebotomists conducted the specimen collection (blood and urine), performed the complete blood count analysis and processed the biological samples for storage and shipment to the reference labs. A licensed dentist conducted the oral health component. In addition to the health professionals, the MEC team also consisted of administrative staff who worked at the reception desk, the appointment booking desk and as dental recorders during the oral health component, as well as a site logistics officer who took care of the maintenance of the trailers.
6.1.1.3 Head office staffThe CHMS staff at head office monitored data collection response rates and data quality, and through periodic site visits, staff performance. These staff members provided human resource support, processed data, and assessed the output from the reference labs. In addition, head office staff prepared and mailed the respondent's report of selectedlaboratory tests, and provided information about the survey to respondents, the public and the media. Finally, a medical advisor followed-up with respondents about critical or sensitive results.
6.1.2 The mobile examination centre (MEC)
Two sets of trailers were acquired in order to conduct the physical measures and laboratory components of the CHMS. Each MEC was comprised of two trailers, the administrative trailer and the clinic trailer. The trailers had several different rooms, including a reception area, restrooms, an administrative office, fitness testing area, a screening area, an oral health room, anthropometry and phlebotomy areas and a laboratory.
Using MECs provided several benefits over a fixed clinic site (e.g., a clinic set up in an office building or hospital). They provided a standardized collection environment (equipment set up, room size, etc.) that was designed to meet Statistics Canada security and confidentiality policies and the flexibility of locating the MEC near the selected respondents' homes. The MEC also allowed for comparability with the National Health and Nutrition Examination Survey (NHANES) in the United States which also uses MECs.
6.1.3 Informatics environment
Computer assisted interviewing (CAI) was used to capture the responses for the household, physical measure and laboratory components of the CHMS. CAI allowed for custom interviews for every respondent based on their individual characteristics and survey responses. This included:
- Questions that were not applicable to the respondent were skipped automatically.
- Edits to check for inconsistent answers or out-of-range responses were applied automatically and on-screen prompts were shown when an invalid entry was recorded. Immediate feedback was given to the respondent and the interviewer was able to correct any inconsistencies.
- Question text, including reference periods and pronouns, was customised automatically based on factors such as the age and sex of the respondent, the date of the interview and answers to previous questions.
In order to perform computerized data capture within the MEC, a unique data capture architecture had to be developed as there was a requirement for multiple users in different MEC rooms to access a single respondent's case file. This required the development of a complex, fully customized data capture application that used components of the computer assisted telephone interview (CATI) environment.
To reduce data entry errors, increase efficiency of data collection and reduce the need for double entry and data entry verification, the CHMS MEC data capture system was developed to accept direct input from other electronic testing equipment. This included communication (both one and two-way) between the application and the measurement devices (e.g., automated blood pressure cuff, weigh scale). In cases where the direct input was not functioning and manual entry was required, the data were entered in twice.
In order to support the electronic capture of physical measures data and to support the operational and administrative needs, the MEC was equipped with its own computer server. After each session at the MEC, encrypted data were transmitted from the trailer server via a dedicated out-going phone line to Statistics Canada headquarters. Encryption software was used to ensure the confidentiality of the data during transmissions between the MEC and headquarters.
6.1.4 Questionnaire design
6.1.4.1 Household questionnaireThe household questionnaire content was developed with input from stakeholders (Health Canada and the Public Health Agency) and from external experts, who participated as members of various advisory committees. In addition to new questions, existing health questions were taken from other surveys (e.g., Canadian Community Health Survey (CCHS)) to build the CHMS questionnaire. Focus groups and one-on-one interviews were conducted to look at specific questionnaire content under consideration. Improvements were made to questionnaire wording and instructions and to the flow of questions as a result of this testing. Throughout the questionnaire testing process, internal and external experts and stakeholders were consulted before content changes were finalized.
6.1.4.2 Clinic questionnaireDevelopment of the MEC component of the survey proceeded in much the same way as that of the household questionnaire. A determination was made as to the content and multiple iterations of the collection application were generated. Each iteration was assessed to determine the best flow within the MEC for the respondent and the MEC staff, and the quality and quantity of data collected. As with the household questionnaire, experts were frequently consulted to ensure that the clinic component achieved the goal of collecting high quality results.
6.1.4.3 Pre-testThe final test was a large scale pre-test, which tested modules on general health, sleep, height and weight, chronic conditions, nutrition and physical and sedentary activity. The testing provided the first opportunity to examine the potential household and clinic questionnaire content in conjunction with physical measure tests. The flow of physical measures tests in the mobile examination centre, as well as accompanying screening and administration questions, were also tested.
6.2 Collection
Data for cycle 1 of the CHMS were collected between March 19, 2007 and February 25, 2009 from 15 collection sites spread across Canada from Moncton to Vancouver. While one set of trailers was being used for collection, the second set would be moved to the next location and began the rigorous set of procedures required in order to prepare for collection.
6.2.1 Collection – Household interview
One to two weeks prior to the start of household interviews at each collection site, a letter and brochure were mailed to the dwellings selected for the survey, informing them that they would be contacted to participate in the survey. Interviewers called or drove to each dwelling to book an interview. Once contact was made with the household, the interviewer introduced the survey by outlining the basic steps of the survey and informing the person that participation was voluntary and that any information provided would be kept confidential under the authority of the Statistics Act.
Based on the demographic information collected, one or two persons in the household were selected to participate in the survey using different probabilities of selection by age group. The selection algorithm was designed to try and reach an equal distribution of people among the different age groups. If two persons were selected in a household, one person was always 6 to 11 years old and the other 12 to 79 years old.
Prior to commencing the interview, the respondent was informed about the survey and was shown a brief (four-minute) introductory video. For respondents between the ages of 6 and 11, an adult was present during the interview to answer questions with assistance from the child. All respondents aged 12 to 79 years who were able to answer questions on their own were asked to do so.
At the end of the interview, the interviewer provided the respondent with an information package, explaining the clinic portion of the survey, information about the tests performed at the mobile examination centre (MEC) and general information about the survey. The interviewer briefly reviewed the material in the information package and answered any questions. At that time the interviewer informed the respondent that he/she had been assigned to a morning or afternoon/evening appointment at the MEC. The morning session required the respondent to fast for 12 hours for measurement of fasting glucose, blood lipids and insulin levels, among other tests. See appendix 1 for a list of the pre-testing guidelines provided to respondents during the household interview.
If the respondent was 14 years or older, the interviewer then asked the respondent to set up an appointment at the MEC. Parents were asked to set up the appointment for their 6- to 13-year-old child. At the end of each day, the interviewers transmitted all completed cases back to Statistics Canada using encryption software to ensure the confidentiality of the data during the transmission.
6.2.2 Collection – Mobile examination centre (MEC)
Upon arrival at the MEC, the respondent's information was logged into the database at the reception desk. The MEC staff verified that the respondent's name, sex, date of birth and official language (collected during the household interview) were correct. Adherence to the pre-testing guidelines was verified and documented within the clinic capture application.
Prior to beginning the physical measures tests, the respondent must have given consent to participate in the clinic portion of the survey. Parents or guardians gave consent on behalf of children aged 6 to 13 while the child provided his/her assent to participate.
After the consent module, the respondent (or parent/guardian of younger respondents) was asked some screening questions using the PAR-Q (appendix 3). Although the PAR-Q was intended for people aged 15 to 69, it was used on all respondents. Parents or guardians completed the screening questions on behalf of children aged 6 to 13. Depending on the fasting status, the age of the respondent and the responses to the screening questions some respondents were excluded from certain measures or laboratory tests (see appendix 2 – Exclusion Criteria and appendix 3 – PAR-Q).
The respondent then proceeded with the visit at the MEC, performing all measures or laboratory tests for which he/she was eligible. The respondent could, at any time, refuse to participate in any measure or test. The order of the measures and blood tests was set in such a way that the effects of a certain measure (e.g., increased blood pressure from mCAFT) did not affect the results of another measure (e.g., resting blood pressure). For detailed information describing the protocols followed for all measures see appendix 4.
The blood and urine samples collected from survey respondents were processed, analyzed for the complete blood count (CBC) and temporarily stored in fridges and freezers within the MEC laboratory. Stored samples were sent weekly to reference laboratories in Ottawa, Quebec City and Winnipeg for additional analyses related to general health, diabetes, kidney disease, cardiovascular disease, environmental contaminants and infectious diseases and for storage in the CHMS biobank. Deoxyribonucleic acid (DNA) samples were sent twice weekly to Winnipeg for processing since DNA integrity is time sensitive.
Prior to leaving the MEC, the respondent received a report of their measurements, and possibly one or more letters for their health care provider if required (some blood pressure, and oral health results may have been deemed as requiring follow-up). A few months after the visit to the MEC, a report of laboratory tests containing most of the respondent's blood and urine test results was sent out. At the end of cycle 1 a spirometry report was also sent out to respondents. Respondents 14 years of age or older received their laboratory and spirometry reports, while parents of respondents 6 to 13 years old received their child's reports.
6.2.3 Collection – Home visit
In order to maximize response rates to the CHMS, respondents who were unwilling or unable to attend the mobile examination centre (MEC), but were willing to have a selected number of measures done in their home were offered the option of a home visit. There were 22 home visits during the entire cycle 1 collection period.
The home visit was conducted by a minimum of two CHMS staff members (most often a health measures specialist and laboratory technologist) using paper questionnaires for data recording. There were no differences in the procedures used to conduct the measurements in the home, however, there were minor differences in the equipment used (e.g., scale, stadiometer) because all home visit equipment needed to be portable. As with the visit to the MEC, the respondent could, at any time, refuse to participate in any measure or laboratory test. The home visit took less time because the mCAFT, sit and reach and partial curl-up components were not performed at the home. The oral health component was performed only if a dentist was available at the time of the home visit. Once back at the MEC, the health measures specialist entered the data from the home visit into the application and coded it as a home visit. The senior health measures specialist then verified the data entry. A report of measurements was mailed to the respondent within a few days of completion of the home visit. Respondents received a report of laboratory tests a few months later and a report of their spirometry results at the end of cycle 1.
6.3 Minimizing non-response
6.3.1 Minimizing non-response – Household interview
To ensure the best possible response rate at the household, many practices were used to minimise non-response.
6.3.1.1 Introductory letters and brochuresBefore the start of each collection period, introductory letters and brochures were sent to the sampled households, explaining the different steps of the survey and emphasizing the importance of the survey by providing examples of how CHMS data would be used.
6.3.1.2 Initiating contactInterviewers were instructed to make all reasonable attempts to obtain interviews. When the timing of the interviewer's visit was inconvenient, an appointment was made to come back at a more convenient time. If no one was home on first visit, a notice that a CHMS interviewer had stopped by their home was left at the door. Numerous personal visits were made at different times on different days until potential respondents were home and available to do the interview. If interviewers were unable to make contact with anyone at the household, they tried to obtain a name and telephone number for the dwelling using directory listings, neighbours, superintendents, and management/rental offices in order to call the dwelling later to arrange for a personal visit.
6.3.1.3 Refusal procedures – Household interviewThe interviewer tried to convince the respondent of the importance and potential benefits of participating in the survey. If the individuals refused to participate in the survey, they were then contacted a second time by another interviewer who, again, stressed the importance of the survey and the household's participation.
6.3.1.4 Language barriers – Household interviewThe introductory letter and the CHMS brochure were available in English, French, Punjabi and Chinese. Respondents were interviewed in the official language of their choice (English or French). To remove language as a barrier to conducting interviews, where possible, the CHMS team recruited interviewers with some language competencies other than the two official languages. When necessary, cases were transferred to an interviewer or external interpreter with the language competency so that questions/instructions could be translated for the respondent in order to complete the interview. If no one with a certain language competency could be found, it was also acceptable for a household member who was willing and able to translate for the respondent to do so. Note that this was not considered a proxy interview. The household member was simply translating the questions and the respondent's answers directly to the interviewer, not answering for the respondent.
6.3.1.5 Youth respondents – Household interviewInterviewers were obliged to obtain verbal permission from parents/guardians to interview youths between the ages of 12 and 17 who were selected for the survey. Several measures were taken to alleviate potential parental concerns and to ensure a completed interview. Interviewers provided the parent or guardian with a copy of the "Note to parents / guardians about interviewing youths for the Canadian Health Measures Survey". This document explained the purpose of collecting information from youth, listed the subjects to be covered in the survey and explained the need to respect a child's right to privacy and confidentiality.
When interviewing respondents 12 to 17 years of age, interviewers ensured that the parent was in the home but that the interview took place outside of parents/siblings earshot, unless permission was obtained from the youth for a parent to be present. If the interviewer was not able to obtain privacy to interview the selected youth the interviewer read the questions out loud with the parent in the room and had the youth enter his/her answers directly on the computer. If privacy and confidentiality could not be respected, the case was coded as a refusal with a permanent note indicating that privacy/confidentiality could not be respected.
If parents asked to know more about the type of questions asked in the survey, interviewers first directed them to the topics listed in the Note to Parents. If they asked to see the actual questions interviewers showed them the content section of the Interviewer's Manual. For those parents who requested a copy of the questions, a copy was available through the Data Collection Manager, as well as at Statistics Canada's head office in Ottawa.
6.3.1.6 Proxy interviewsIn the CHMS, parents/guardians answered questions about their children aged 6 to 11. This included all household modules that were applicable to children. Children assisted in responding to some questions for which the parents may not have known the answers (e.g., participation in activity during school hours).
In cases where the selected respondent 12 years of age or over was, for reasons of physical or mental limitations, incapable of completing an interview at the household, another knowledgeable member of the household supplied information about the selected respondent. While these proxy respondents were able to provide accurate answers to most of the survey questions, the more sensitive or personal questions were beyond their scope of knowledge. This resulted in some questions from the proxy interview being unanswered. Every effort was taken to keep proxy interviews to a minimum. The variable "PROXY" on the data set indicates whether a household interview was completed by proxy.
In cycle 1, 20% of the interviews were proxy. Of the proxy interviews, 97% of the respondents were under 12 years of age and 3% of the respondents were 12 years of age or older.
6.3.2 Minimizing non-response – Mobile examination centre(MEC)
Approximately 85% of respondents who completed a household interview in cycle 1 agreed to go to the MEC. Many practices were used to obtain this high level of participation, including:
6.3.2.1 Non-response follow-upMEC staff were responsible for following up with any respondents who did not book an appointment at the end of their household interview and did not call the MEC booking desk to set up an appointment within a few days after their household interview. The staff members followed similar refusal procedures as household interviewers.
6.3.2.2 Flexible MEC hoursStrategies specific to the MEC included the creation of MEC opening hours and appointment times that provided maximum flexibility to the respondent. The MEC staff tried to accommodate as many respondents as possible at each site. In addition, home visits were offered to respondents unwilling or unable to go to the MEC.
6.3.2.3 Refusal procedures - MECTo minimize the non-response to the CHMS, the MEC staff were instructed to make all reasonable attempts to convince respondents who participated in the household interview to attend the MEC. The appointment booking desk staff, who had received specific training in handling refusal conversions, followed-up with respondents who refused to participate in the clinic portion of the survey. If they were unsuccessful in booking an appointment, the MEC site manager would call one final time to attempt to book an appointment. Respondents who could not be contacted (e.g., no answer at the home phone number) were sent a "No-contact Letter" asking them to phone the MEC to book an appointment.
6.3.2.4 Language barriers - MECMobile examination centre (MEC) staff handled language barriers in the same way as household interviewers. CHMS staff, external interpreters or family members with knowledge of the third language were used to help the respondent understand instructions and forms in order to complete the visit at the MEC. The consent forms and screening questions were also available in Chinese and Punjabi to try to accommodate respondents from these ethnic minority groups since a high percentage of these groups were known to be living within some of the cycle 1 sample collection areas.
6.3.2.5 Youth respondents - MECAs with the household interview, parents/guardians answered all questions about their children aged 6 to 11. The questions asked at the MEC pertained to screening, lung health and oral health. Since the age of consent for the clinic portion of the CHMS was 14 years of age, parents/guardians also answered these questions for their 12 and 13 year old youths, though the youths usually assisted. Youths aged 14 and over were responsible for signing their own consent form and answering all questions, though parents/guardians were in some cases present during their visit at the MEC and able to assist on difficult questions as required. To maximize efficiency at the MEC, the selected child or youth usually did the physical measure tests with one CHMS staff member while their selected parent was doing tests with another CHMS staff member.
In cases where the selected respondent 14 years of age or over was, for reasons of physical or mental limitations, incapable of answering questions and completing the consent form at the MEC, the parent/guardian assisted.
6.4 Clinic measures protocols
For detailed information describing the protocols see appendix 4. For detailed information on test exclusion criteria see appendix 2.
6.4.1 Anthropometry
The Anthropometric Component consisted of height (which included standing and sitting height) and weight measurement, measurement of circumferences (including waist and hip circumferences) and skinfold measurement. The six anthropometric measures were taken on all eligible respondents aged 6 to 79 years old. Acute or chronic conditions specifically affecting one or more of the anthropometry measures were reasons why a respondent would not have been eligible for any of the following measures.
6.4.1.1 Standing heightStanding height is an assessment of maximum vertical size. This measure was taken of all the respondents who were able to stand unassisted. Standing height was measured with a fixed stadiometer with a vertical backboard and a moveable headboard using a procedure based on the 3rd edition of the Canadian Physical Activity, Fitness and Lifestyle Approach (CPAFLA) 3rd Edition3. A self-reported height was captured for respondents who were not eligible because of an acute or chronic condition (e.g., in a wheelchair) or who refused to have their height measured.
6.4.1.2 Sitting heightSitting height is an assessment of maximum vertical size when the respondent is sitting. It was measured on respondents who were able to sit unassisted. Sitting height was measured with a fixed stadiometer with a vertical backboard and a moveable headboard. The respondent's sitting height was measured, following the International Society for the Advancement of Kinanthropometry (ISAK) protocol4.
6.4.1.3 WeightThe respondent's weight was taken on a Mettler Toledo digital scale. The respondent's weight was measured, following the CPAFLA protocol (3rd Edition) 3.
6.4.1.4 Waist circumferenceWaist circumference provides an indicator of abdominal fat distribution. The respondent's waist circumference was measured, following the CPAFLA protocol (3rd Edition)3. This protocol was modified by the Canadian Society for Exercise Physiology in the fall of 2008. Note that the CHMScontinued using the previous protocol throughout cycle 1 and a cross over study is being performed to allow the comparison between cycle 1 and cycle 2 data.
6.4.1.5 Hip circumferenceHip circumference is the maximal circumference measured at the hips or buttocks region (whichever is larger). It is used to calculate the waist-to-hip ratio (waist circumference divided by hip circumference) and is a simple method of determining body fat pattern. The protocol for hip circumference was based on the Canadian Standard Test of Fitness 3rd Edition5.
6.4.1.6 SkinfoldsSkinfold measurement is used to estimate the amount of body fat and the distribution of subcutaneous adipose tissue. The principle behind this technique is that the amount of subcutaneous fat (fat that lies directly beneath the skin) is proportional to the total amount of body fat. The respondent's skinfolds were measured following the five site method of the CPAFLA protocol3. Skinfold mesurements were not done on respondents with a body mass index (BMI) equal to or greater than 30 kg/m2.
6.4.2 Heart rate and blood pressure
The respondent's resting heart rate and blood pressure (BP) were measured, following a new protocol created by the CHMS and inspired by the report entitled "Hypertension Surveillance in Canada: Minimum Standards For Assessing Blood Pressure In Surveys" report6. This report was published by an expert committee consisting of members of the Canadian Hypertension Society, the Canadian Coalition for High Blood Pressure Prevention and Control and the Heart and Stroke Foundation of Canada.
Heart rate and blood pressure measurements were taken on all eligible respondents aged 6 to 79 years old using an oscillometric blood pressure measurement device. A series of BP and heart rate measurements were taken at one minutes intervals following a five minute rest period and the last five measurements were used in the determination of average resting heart rate and blood pressure.
6.4.3 Spirometry
Spirometry measurements were taken on all eligible respondents aged 6 to 79 years old, following the 1994 Update of the Standardization of Spirometry article, published by the American Thoracic Society7. Heart attacks, chest or abdomen surgeries within 3 months, eye surgery within 6 weeks, tuberculosis medication, pregnancy >27 weeks and acute or chronic conditions were some reasons for exclusion.
6.4.4 Musculoskeletal fitness
Fitness tests were done on all eligible respondents aged 6 to 69, except for the grip strength component which was done on all eligible respondents aged 6 to 79 years old. Medication use, acute and chronic conditions, pregnancy, and failure to adhere to pre-testing guidelines (appendix 1) were some reasons why a respondent would not have been eligible for any of the measures. Respondents aged 70-79 were excluded from the sit and reach, partial curl-ups and aerobic fitness tests.
6.4.4.1 Grip strength componentMuscular strength refers to the maximum force that can be generated by a specific muscle or muscle group. The most common method of measuring muscular strength in the field is isometric grip strength. Isometric grip strength is measured using a handgrip dynamometer.
The protocol for the Grip Strength Component was based on the Canadian Physical Activity, Fitness and Lifestyle Approach 3rd Edition (CPAFLA)3.
6.4.4.2 Sit and reach componentThe sit and reach test is a commonly used field test to assess low back and hip-joint flexibility. The protocol for the Sit and Reach Component was based on the Canadian Physical Activity, Fitness and Lifestyle Approach (CPAFLA)3.
6.4.4.3 Partial curl-up componentThe partial curl-up test evaluates the endurance of the abdominal muscles. The protocol for the Partial Curl-up Component is based on the Canadian Physical Activity, Fitness and Lifestyle Approach (CPAFLA)3.
6.4.5 Modified Canadian Aerobic Fitness Test (mCAFT) component
Aerobic fitness is a measure of the combined efficiency of the lungs, heart, vasculature, and exercising muscles. The eligible age group for the mCAFT was 6 to 69 years of age. The protocol for the modified Canadian Aerobic Fitness Test (mCAFT) Component is based on the Canadian Physical Activity, Fitness and Lifestyle Approach (CPAFLA) 3rd Edition for adults 15-69 years of age3, but was applied to all age groups.
6.4.6 Oral health component
For the oral health component a dentist assessed the oral health status of respondents based on criteria from the World Health Organization and was done on all eligible respondents aged 6 to 69 years old. The results of the oral exam were directly entered into a computer, with the help of a dental recorder. The World Dental Federation (FDI) numbering system was used.
6.4.7 Physical activity monitor
Activity monitors were administered to all eligible respondents aged 6 to 79 years old. Respondents in wheelchairs were excluded. An Actical activity monitor was given to respondents, along with an adjustable belt, an XPRESSPOST envelope, and an information sheet. Respondents were to wear the monitor for seven days and then return it in the envelope provided.
6.5 Laboratory measures protocols
6.5.1 Sample collection
Blood and urine were collected to obtain laboratory results that provided prevalence estimates of disease, risk factors for certain diseases, and baseline information on health, nutritional status of the population and environmental contaminants.
6.5.1.1 Blood collectionThe blood was collected by the phlebotomist using a standardized venipuncture technique. The amount of blood taken from respondents depended on their age:
- 6 to 11 years: < 28 ml
- 12 to 13 years: < 38 ml
- 14 to 19 years: < 50 ml
- 20 to 79 years: < 80 ml
An increasing amount of blood was taken by age because more tests were done for older respondents. For example, 6 to 11 year olds had less than half the number of tests done as compared to 20 to 79 year olds.
The blood test selected for the CHMS were ranked in order of priority and so it should be noted that a deviation from the standard order of blood draw was made to accommodate the priority of the test(s) being measured. The order of vacutainer collected was dependent upon the priority of the test versus the anticoagulant used.
6.5.1.2 Urine collectionThe urine was collected using mid stream collection and the respondent was asked to provide approximately 60 ml of urine. This collection was done for all respondents.
6.5.2 Analysis of CBC performed at the mobile examination centre (MEC)
The complete blood count (CBC) was analyzed in the MEC laboratory by the technologist and performed for all respondents from whom a sample was collected. Results from any unsuitable samples (ie: severe lipemia or clot in tube) were not reported.
6.5.3 Processing and storage of the blood and urine samples
It was important to process the specimens as soon as possible because the quality and integrity of the blood and urine specimens would deteriorate over time. Whole blood was centrifuged to separate plasma from cells and serum from a clot, to allow for the aliquoting into smaller tubes. The urine was also aliquoted into smaller tubes. These tubes were placed in shipping trays and stored in the MEC laboratory in either the refrigerator or the freezer depending on the test. All specimens were stored as soon as processing was complete to ensure the samples viability.
6.5.4 Shipping
With the exception of the DNA samples, which were sent twice a week, the shipping of the blood and urine aliquots was done once a week to the reference laboratory on pre-assigned shipping days. All packages were sent to one of the 3 reference labs: Health Canada in Ottawa for chronic disease, general health (chemistry panel) and nutritional lab results, Institut National de Santé Publique du Québec (INSPQ) in Quebec City for environmental lab tests plus urine creatinine (environmental adjustments and kidney health) and the National Microbiology Laboratory (NML) in Winnipeg for infectious disease lab results and the CHMS biobank. Shipments were packaged according to the International Air Transport Association (IATA) and transport of dangerous goods regulations.(biological specimens). All shipments were sent by overnight delivery using a courier company certified to handle dangerous goods and were scheduled to arrive at the reference laboratory only on weekdays. A specimen tracking system was also developed so that staff could determine the status of every tube shipped to the reference laboratory. In addition, the temperature of refrigerated shipments was monitored using pre programmed devices that took the temperature every 15 to 30 minutes during shipping. This allowed assurance that the samples received by the reference labs were maintained at an adequate temperature to preserve the sample integrity during shipping.
There were some occurrences where shipments were delayed and once received it was noted that the shipment conditions had been compromised. Any results from compromised samples were removed to ensure that only the highest quality of data was reported to the CHMS by the reference laboratory.
7. Data processing
7.1 Verification
One of the unique features of Canadian Health Measures Survey (CHMS) is that three different sets of data were collected for the same respondent: household interview data, clinic measurement data, and laboratory result data. Each set of data had to be processed on its own, yet they could not be completely separated from each other because at various points during processing the three sets of data had to be used together.
The processing of the household interview data was performed in a manner similar to that of other health surveys at Statistics Canada. The data were validated first at the record level and then at the individual variable level, followed by detailed top-down editing. During data collection processing took place on a daily basis (including weekends). The household interview responses had to be processed quickly in order for the data to be available at the mobile examination centre (MEC) in time for the respondent's visit to the MEC.
Similarly, the processing of the clinic measurement data began with the data being validated first at the record level and then at the individual variable level, followed by detailed top-down editing. Also, because the laboratory tests were determined based on responses during the clinic portion at the MEC, the clinic data were used to generate a file containing a list of the tests for which results were expected to be received. This laboratory "control" file was used in processing the laboratory result data.
The processing of the laboratory result data involved significant file manipulation due to the fact that several different file types were received from the MEC and the three reference laboratories. Then the data were validated at the record level and at the individual variable level, and several new variables were derived. The laboratory data were processed as quickly as possible so that any critical results that had been identified at the reference laboratories and the MEC were immediately available for reporting to respondents.
7.2 Mark-all-that-apply questions
During the initial phase of data processing, mark-all-that-apply questions are expanded with each response category in the original question becoming a series of separate questions with a yes or no response. In the example below, the respondent selected both 2 and 3 as answers to the original question. The answers to the new questions are based on answers from the original question.
Original question:
CCC_Q96 What type of hepatitis do you have?
Interviewer: Read categories to respondent. Mark all that apply.
- Hepatitis A
- X Hepatitis B
- X Hepatitis C
Final questions / responses:
CCC_96A What type of hepatitis do you have? - Hepatitis A
- Yes
- X No
- Don’t Know, Refused
CCC_96B What type of hepatitis do you have? - Hepatitis B
- X Yes
- No
- Don’t Know, Refused
CCC_96C What type of hepatitis do you have? - Hepatitis C
- X Yes
- No
- Don’t Know, Refused
7.3 Coding
Pre-coded answer categories were supplied for all suitable variables, and the interviewers and health measures specialists were trained to assign a respondent’s answers to the appropriate category. In the event that a respondent’s answer could not be easily assigned to an existing category, several questions also allowed the interviewer to enter a long-answer text in the “Other-specify” category. All such questions were closely examined at head office during processing. For some household questions, the long answers were coded into one of the existing listed categories if the long answer duplicated a listed category. If not, the response was coded as ‘Other’. For the clinic responses, at the end of processing, long answers were reviewed and some responses were coded to existing categories. For the remaining ‘Other- Specify’ answers, some new categories were created where there were sufficient numbers of responses. The remaining responses were coded as ‘Other’. For all questions, the “Other-specify” responses will be taken into account when refining the answer categories for future cycles.
Statistics Canada is not permitted to release specific drug names and cigarette brands. As a result, this information, while collected, is not available on the master files. Instead, coded variables representing information about these responses (ATC, AHFS and tar values (see section 12.6)) are placed on the master files.
Certain data were collected as long answers and had codes assigned, specifically medication and other health product names and dosages, cigarette brand names, and job description information. For medications and cigarette brand names, databases of standard descriptions were available in the computer-assisted interviewing (CAI) applications, and a code could be assigned at the time of collection based on a search of the appropriate database. Any description without a code was extracted during processing and coded manually. Over the course of the full survey, there were 1,832 medications and other health products that were manually assigned a Drug Identification Number (DIN), and 154 cigarette brand names that were manually assigned a brand code. For the assignment of North American Industry Classification System (NAICS) 2002 and National Occupational Classification - Statistics (NOC-S) 2001 codes, all 3,485 records with data in the job description fields were extracted and sent for manual industry and occupation coding. A preliminary step of matching to a database of previously coded descriptions was performed to provide starting points for the manual coding.
7.4 Editing
Most editing of the data was performed at the time of the interview by the CAI application. It was not possible for interviewers to enter out-of-range values, and flow errors were controlled through programmed skip patterns. For example, CAI ensured that questions that did not apply to the respondent were not asked. Edits requiring corrective action were incorporated in the CAI application to deal with inconsistent responses, and warnings not requiring corrective action were also included to identify unusual (i.e., improbable rather than impossible) values as a means of catching potential errors and allowing correction at source.
At head-office the data underwent a series of processing steps that may have resulted in some of the data being adjusted. As a final validation step, the CAI edits were re-applied to the processed data. As a result, the final data were complete and contained reserve codes for responses of “less than limit of detection”, “not applicable”, “don’t know”, “refused” and “not stated”.
| Reserve Code label | Reserve code |
|---|---|
| Less than limit of detection | 9.5, 99.5 etc. |
| Not Applicable | 6, 96, 99.6 etc. |
| Don’t Know | 7, 97, 99.7 etc. |
| Refusal | 8, 98, 99.8 etc. |
| Not Stated | 9, 99, 99.9 etc. |
7.5 Creation of derived variables
Derived variables (DV) for cycle 1 of the Canadian Health Measures Survey (CHMS) were created to facilitate data analysis and to minimize the risk of errors. The three most common types of derived variables were created by: collapsing data from one variable into groups; combining the data from one or more survey questions for a single respondent; or combining data from more than one respondent. Derived variables generally have a "D" or "G" in the fourth character of the variable name.
Three other types of derived variables can be found on the cycle 1 CHMS data file: converting responses given in various time units (days, weeks, months or a year) into one type of units such as yearly; calculation of body mass index (BMI); and the creation of the Health Utility Index which is based on the responses from a series of questions.
Specifications were received which provided details as to how to proceed with the creation of each derived variable. Cycle 1 of the CHMS has 599 derived variables. Half were created within the capture application in order to be able to provide initial results to the respondents at the end of their visit to the mobile examination centre and the remaining derived variables were created after the completion of data processing.
All derived variables underwent a validation process after creation in order to ensure that the output provided the requested data. Modifications to the specifications may have been necessary if, during validation by subject matter experts, the output from the derived variables was determined to be flawed. Complete documentation for all cycle 1 derived variables can be found in the DV documentation (see appendix 5).
7.6 Limit of detection
The data released for waves 2 and 3 had never been collected or released by Statistics Canada in the past. This data differed from the typical survey data collected through interviews or the data collected through actual physical measurements. The vast majority of the data for waves 2 and 3 came from the blood and urine samples collected at the Mobile Examination Centres.
Once collected, the samples were sent to the reference laboratories for analysis. The instruments and methods used to perform the analysis have limits as to what they can actually detect in the blood and urine samples. For that reason, from time to time, results were returned from the laboratories with a code that indicated that the results for a particular sample were above or below a level of concentration that could be measured by the instrument for that test.
During processing this information was translated into a reserve code.
7.7 Reference ranges
Commonly referred to as the normal range a reference range is an interval into which 95% of the population falls. The ranges are established over time by testing a large number of people. They provide guidelines as to what are usual values in the population being measured but are not optimal health ranges.
Reference ranges may vary depending on factors such as age, sex, and race. The instruments used in the laboratory may also affect these ranges. For that reason, reference ranges are provided by each laboratory for each type of test they perform for a specific time period. The ranges may change over time as characteristics of the population being measured change.
For tests performed on samples collected by the CHMS, a document is available upon request that lists the reference ranges for each test. As these ranges are provided by the various laboratories performing the tests, Statistics Canada provides them to data users for informational purposes only.
8. Data file structure
8.1 Description of data files
The dissemination files only contain data from respondents who attended the mobile examination centre (MEC) and agreed to share their responses with Health Canada and the Public Health Agency of Canada. For cycle 1 of the CHMS, after the completion of processing, and with the removal of non-share records, 5,604 records remain on the main master file.
By the end of cycle 1 dissemination, nine files containing CHMS data will have been released. One file will contain the complete household, MEC visit, full sample laboratory, and activity monitor derived variables. Six files will contain sub-sampled laboratory data. There will also be one file that contains the activity monitor derived variables for people who wore their activity monitor for four or more days, and one file with all the medication data. An additional file containing Environment Canada weather and air quality data was also released.
| Wave 1 | Household & MEC data | January 2010 |
|---|---|---|
| Wave 2 | Laboratory data (excluding environmental measures) + selected fasted sub-sample file | March 2010 |
| Wave 3 | Laboratory data (including environmental measures) + three sub-sample files
|
August 2010 |
| Wave 4 | Activity monitoring data + sub-sample file for people who wore their activity monitor for 4 or more days | November 2010 |
| Supplementary Data release | Master file with updated 2,4,D data Tobacco sub-sample data:
Phthalate sub-sample data |
April 2011 |
The basic sample for the survey covers respondents 6 to 79 years of age. However, some of the measures or tests were only done for one sex, on fasting respondents or on a random subgroup of ages. Refer to chapter 4 for detailed content information.
This first data file contains the responses collected during the household interview, the MEC visit, derived variables created by the collection applications and some created after data processing. The 5,604 records represent one record for each respondent who went to the MEC and participated in at least some of the measures and then agreed to share those results with Health Canada and the Public Health Agency of Canada.
The data contained in this file covers the following topics:
- Alcohol use
- Anthropometry
- Cardiovascular health and fitness
- Chronic conditions
- General health
- Lung function
- Medication use
- Musculoskeletal fitness
- Nutrition
- Oral Health
- Physical activity
- Pregnancy
- Sexual health
- Sleep
- Smoking
- Sun exposure
This file contains all of the data from wave 1 master file, as well as the first group of laboratory variables. These variables contain laboratory data on cardiovascular health, chemistry panel, diabetes, general health, infection markers, kidney health and nutritional status.
8.1.3 Wave 2: Fasted sub-sample file
This was the first of the sub-sample files to be released CHMS. This file contains data for a subset of the CHMS respondents; those who had fasted for a minimum of 10 hours. The file contains the following variables:
- Apolipoprotein A1
- Apolipoprotein B
- Low density lipoproteins (LDL)
- Triglycerides
- Insulin
Note that this file also contains a weight specific to this sub-population.
This file created for this release contains all of the data from the wave 1 and wave 2 master files, as well as the laboratory variables concerning environmental contaminants and chemical substances. These variables contain laboratory data on bisphenol A, cotinine, metals, Organophosphate pesticides, Phenoxy herbicides (2,4-D, 2,4 DCP) and Pyrethroid pesticides.
8.1.5 Wave 3: Sub-sample files
Three more sub-sample files were released in wave 3. These files contained data for a subset of the CHMS respondents.
| Sub-sample File | Sample |
|---|---|
| 1) PFCS: | |
| - Perfluorinated compounds (PFHxS, PFOS, PFOA) | 20 to 79 (s) |
| 2) PBDE: | |
| - Organochloride pesticides | 20 to 79 (s) (fasting) |
| - Polychlorinated biphenyls (PCBs) | |
| - Polybrominated biphenyls (PBBs) | |
| - Polybrominated diphenyl ethers (PBDEs) | |
| 3) BIHG | |
| - Inorganic mercury - Blood | 6 to 79 (s) |
| (s) = some laboratory tests are only done on a random subgroup of the age range indicated | |
Note that each of these files contain a weight specific to the sub-population of the file.
8.1.6 Wave 4: Master file
The file created for this release contains all of the data from the wave 1, wave 2 and wave 3 master files, as well as 98 activity monitor derived variables.
8.1.7 Wave 4: Sub-sample file
This file contains data for a subset of the CHMS respondents; those who wore their activity monitor for a minimum of 4 days. The file contains the 98 activity monitor derived variables. The file also contains a weight specific to this sub-population.
8.1.8 Supplementary Data release: Master file
The file created for this release contains all of the data from the wave 1, wave 2 and wave 3 master files with the following changes:
- The medication data has been removed and placed on a separate file.
- The 2,4,D data has been updated.
8.1.9 Supplementary Data release: Medication File
In an effort to make the medication data collected during the CHMS household interview and clinic visit easier to work with, a separate database containing all medication responses was created. This database contains information for all respondents and so uses the same weight as the Wave 1 master file – WGT_FULL.
During the household interview, respondents were asked to report any prescription medication, over-the-counter medication and health products or herbal remedies that they took during the previous month. The interviewer was able to capture information for up to 15 prescription medications, 15 over-the-counter medications, and 15 health products or herbal remedies, for a total of 45 possible entries.
During the clinic visit the continued use of each medication, over-the-counter product and health product or herbal remedy reported at the household was confirmed. Respondents then had an opportunity to add up to five new prescription medications, five new over-the-counter products, and five new health products or herbal remedies that they started to take after the household interview had been completed.
Using this information a series of derived variables was created to indicate where the products were reported, how many total products were reported, and when the products were last taken by product type (prescription medications, over-the-counter products or health products or herbal remedies). In addition, both ATC and AHFS codes were assigned for each reported medication; a second AHFS code was added when applicable.Variable naming convention
As per the general rules for the CHMS variable naming convention, the medication database variable names are limited to 8 characters and each character of the variable name contains information about the data contained in the variable.
Positions 1-3:
- “MED” or “MHR”: collected or derived variables from the household and/or clinic interviews
- “ATC”: Anatomical Therapeutic Chemical (ATC) classification variables
- “AHF”: American Hospital Formulary Service (AHFS) classification variables
Position 4: Identifies whether the variable was collected during the household or clinic interview (“_”) or was later derived (“D”).
Position 5: Identifies the medication category:
- “1”: prescription medication
- “2”: over-the-counter medication
- “3”: health product or herbal remedy
Positions 6-7: Identifies the list number of the medication:
- “01” to “15”: Medications collected during the household interview which were then confirmed during the clinic visit
- “31” to 35”: Additional medications collected during the clinic visit
Description of key variables
Note: The variables are described below, using an “X” in position 5 of the variable name as the same logic applies for each medication category (prescription medication, over-the-counter medication, and health products or herbal remedy).
The variable MEDDX00A indicates whether or not the respondent took any medication within a given category in the past month. The variable MEDDX00B is the sum of the medications within a given category taken by the respondent during the past month. Both MEDDX00A and MEDDX00B are derived from information collected during both the household interview and the clinic visit. For more information, refer the Derived Variable Documentation.
It should be noted that although a maximum of 20 medications were captured (15 from the household and 5 from the clinic) for each medication category, the value for MEDDX00B represents the actual number of medications being taken by the respondent within a given category, and therefore may exceed a value of 20. Due to the limitations of the data capture application, details are only available for the first 20 medications reported. For example, if a respondent indicated taking 17 different prescription medications in the last month at the time of the household interview then MEDD100B will equal 17, although details would only have been captured for the first 15 of the 17 prescription medications.
Six additional variables are associated with each of the medications reported within a given category at the household and five additional variables are associated with each new medication reported at the clinic.
MEDDX01A to MEDDX15A and MEDDX31A to MEDDX35A
This variable is derived from the information collected at the clinic during the confirmation of medication-use reported during the household interview. It provides information about whether the respondent was still taking the medication, had stopped taking the medication since the household interview, or had never taken the medication.
ATC_X01A to ATC_X15A and ATC_X31A to ATC_X35A
The ATC code derived from the drug identification number (DIN) collected during the household and/or clinic interview.
AHF_X01A to AHF_X15A and AHF_X31A to AHF_X35A
The first AHFS code derived from the DIN collected during the household and/or clinic interview.
Note: If the DIN was not available for a given medication, the AHF code will appear as “Not Stated” in the database.
AHF_X01B to AHF_X15B and AHF_X31B to AHF_X35B
The second AHFS code derived from the DIN collected during the household and/or clinic interview (if applicable).
Note: If the DIN was not available for a given medication, the AHF code will appear as “Not Stated” in the database.
MED_X01B to MED_X15B
This information was collected at the household and indicates the time the respondent last took each medication from the time of the household interview.
Note: This variable is suggested for use during analysis if attempting to relate medication use to one or more other variables from the household interview.
MHR_X01B to MHR_X15B and MHRDX31B to MHRDX35B
These variables are collected at the clinic and indicate the last time the respondent took each medication from the time of the clinic interview.
Note: This variable is suggested for use during analysis if attempting to relate medication use to one or more other variables from the clinic visit.
8.1.10 Supplementary Data release: Sub-sample files
Two more sub-sample files were released. These files contained data for a subset of the CHMS respondents.
| Sub-sample File | Sample |
|---|---|
| 1) Phthalates: | |
| - Phthalates | 6 to 49 |
| 2) Tobacco: | |
| - Nicotine | 12 to 79 (s) |
| - Nicotine metabolites | |
| - NNAL (4-(methylnitrosoamino)-1-(3-pyridyl)-1-butanol) | |
| (s) = some laboratory tests are only done on a random subgroup of the age range indicated | |
Note that each these files contain a weight specific to the sub-population of the file.
8.2 Key variables for linking data files
As a result of the large number of files disseminated for cycle 1, there is a requirement to be able to link to these files in order to have access to a larger pool of information. This also applies to the sub-sample files.
In order to facilitate the linking of two or more files, a variable that uniquely identifies each respondent on each file is required. For the CHMS, the variable to be used is called CLINICID. With this variable, data users are able to join the data from any sub-sample file to the master file for a particular respondent.
8.3 Key variables and definitions
Other variables which may be particularly useful for data users are listed below:
| CLC_AGE | Respondent's age at the time of the mobile examination centre visit |
|---|---|
| CLC_SEX | Gender of Respondent |
| DHH_MS | Marital Status of Respondent |
| EDUDR04 | Highest level of education - respondent, 4 levels |
| EDUDR10 | Highest level of education - respondent, 10 levels - (D) |
| WGT_FULL | Weight for the full sample file and the medication file |
| WGT_FAST | Weight for the fasted sub-sample file |
| WGT_PFCS | Weight for the PFCS sub-sample file |
| WGT_PBDE | Weight for the PBDE sub-sample file |
| WGT_BIHG | Weight for the BIHG sub-sample file |
| WGT_ACMO | Weight for the Activity Monitor sub-sample file |
| WGT_PHTH | Weight for the Phthalate sub-sample file |
| WGT_SMOK | Weight for the Tobacco sub-sample file |
For information regarding the actual questions asked of the respondents, the household and clinic questionnaires are attached to this document (appendix 6). A record layout of all of the variables on the files is also attached to this document (appendix 7). Data dictionaries containing descriptions and characteristics of all of the released variables are available upon request. Each file released will have a separate dictionary.
9. Weighting
In order for estimates produced from survey data to be representative of the population covered and not merely of the sample itself, users must incorporate weighting factors (survey weights) into their calculations. A survey weight is assigned to each person included in the final sample, that is, in the sample of persons who responded to the entire survey. This weight corresponds to the number of people represented by the respondent in the population as a whole.
As described in chapter 5 (Sample Design), the Canadian Health Measures Survey (CHMS) uses two sampling frames for selecting its sample: an area frame of geographic units (clusters) for constructing and selecting collection sites, and an area frame of dwellings within each site.
In accordance with the weighting strategy, the selection weights for collection sites are multiplied by the selection weights for dwellings (households), adjusted for non-response. Following the conversion of household weights into person weights, the latter are adjusted for non-response at the interview stage and the mobile examination (MEC) stage, and with several other adjustments, this weight becomes the final person weight.
9.1 Selection weights for collection sites
The first step is to calculate the selection weight for each collection site. For each site, this weight is calculated as follows within each of the standard regional boundaries8 (SRB):
Selection weight of a collection site within a given SRB9 =
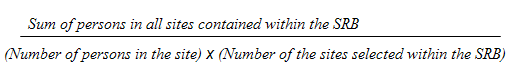
There is no adjustment for non-response at the level of the collection sites, since all sites participated in the survey.
9.2 Selection weights for dwellings
For each collection site selected, a list of all dwellings was obtained from the 2006 Census. These dwellings were stratified into six groups corresponding to the five age group strata and one other strata, using household composition as specified in the section 5.3.2 (Dwelling sampling). The sample of dwellings was allocated among these strata.
For a given dwelling, the selection weight is equal to the inverse of the probability of selection of the dwelling within the stratum to which it belongs.
This weight is then multiplied by the collection site selection weight.
9.3 Removal of out-of-scope units
Among all the dwellings sampled, a proportion are identified during collection as being outside the scope of the survey. Examples of out-of-scope cases for the CHMS are demolished dwellings; dwellings under construction; vacant, seasonal or secondary dwellings; institutions; and dwellings in which all household members are under 6 or over 79 years of age or are full-time members of the Canadian Forces. These dwellings are simply removed from the sample, leaving only dwellings in the scope of the survey. The dwellings that remain in the sample retain the same weight as at the previous stage.
9.4 Household non-response
During collection, a proportion of the households sampled inevitably resulted in a non-response. This usually occurs when the household refuses to participate in the survey, provides unusable data or cannot be reached to conduct the interview. The weight of non-respondent households is redistributed to respondents within homogeneous response groups (HRGs). In order to create these HRGs, the score method based on logistic regression is used to determine the response probability, and then these probabilities are used to divide the sample into groups with similar response properties. Since the information available for non-respondent dwellings (households) is limited, the regression model includes a few variables from the 2006 Census such as dwelling type, as well as geographic information and paradata, which includes the number of weeks between the first and last contact. An adjustment factor was therefore calculated within each HRG as follows:
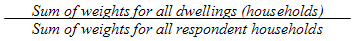
The weight of respondent households is multiplied by this adjustment factor to produce the adjusted household weight. Non-respondent households are eliminated from the weighting process starting at this point.
9.5 Creation of the person weight
Since the final sampling unit for the CHMS is the person, the adjusted household weight up to this point must be converted into a person weight. This is obtained by multiplying the adjusted household weight by the inverse of the probability of selection of the person selected in the household. It should be kept in mind that the probability of a person being selected changes depending on the number of persons in the household and their ages (see section 5.3.3, Sample Design for more details).
9.6 Non-response at the questionnaire level
The CHMS has a three-stage collection process. First, the interviewer obtains the complete list of persons living in the household, then he or she interviews the person(s) selected in the household, and finally, the selected person or persons report to the CHMS mobile examination centre.
In some cases, interviewers succeed in completing only the first step, either because they cannot contact the person(s) selected, or because the person or persons selected refuse to be interviewed. Such cases are defined as non-responses at the questionnaire level, and an adjustment factor must be applied to the weights of respondent persons to compensate for this non-response. Just as for non-response at the dwelling (household) level, the adjustment is applied within classes defined according to the characteristics available for respondents and non-respondents. All the characteristics collected when the members of the household are listed, such as the number of persons in the household, in addition to geographic information and paradata, were in fact available to create these classes. The "score" method is used to define the classes. An adjustment factor is calculated within each class, as follows:
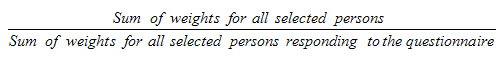
Thus, the weight of respondent persons is multiplied by this adjustment factor. Persons not responding to the questionnaires are eliminated from weighting starting at this point.
9.7 Non-response at the MEC level
Respondents to the questionnaire are then invited to go to the CHMS mobile examination centre for physical measurements. In some cases, people refuse to participate or do not keep their appointment at the mobile examination centre. Such cases are defined as non-responses at the MEC level, and to compensate for this non-response, an adjustment factor must be applied to the weights of the clinic participants. Just as for non-response at the dwelling (household) and questionnare levels, the adjustment is applied within classes defined on the basis of characteristics available for respondents and non-respondents. All the characteristics collected on the questionnaire during the interview (such as income class and whether or not the respondent is employed), in addition to geographic information and paradata, were made available to create these classes. The "score" method is used to define the classes. An adjustment factor is calculated within each class as follows:
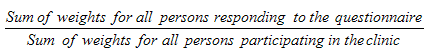
The weights of the persons participating in the clinic were accordingly multiplied by this adjustment factor. Persons who did not report to the MEC are eliminated.
9.8 Winsorization
Note that following a series of adjustments applied to the weights, it is possible that some units will have weights that stand out from the other weights to the point of being aberrant. Some respondents may actually represent an abnormally high proportion in their group and therefore strongly influence both the estimates and the variance. To avoid this situation, a respondent weight that contributes aberrantly to the age-sex group is adjusted downward using a method known as "winsorization."
9.9 Calibration
The last step required to obtain the final CHMS weight is calibration. This procedure is applied to ensure that the sum of the final weights corresponds to the estimates of populations defined at the scale of the five Canadian geographic regions, for each of the 10 age-sex groups of interest, namely the five age groups 6 to 11, 12 to 19, 20 to 39, 40 to 59 and 60 to 79 for each sex.
The population estimates are based on the most recent census counts, as well as on counts of births, deaths, immigration and emigration since then. The calibration was carried out using the mean of the monthly estimates (covering the survey period) for each cross-tabulation of standard regional boundaries and age-sex groups. After calibration, the weight adjustment was obtained. The resulting weight is the final CHMS weight found in the data file bearing the variable name WGT_FULL.
9.10 Fasted sub-sample
The steps described in sections 9.1 to 9.4 were carried out on the fasted sub-sample. At the person weight creation step (section 9.5) the fasted sub-sample flag assigned to the dwellings (see section 5.3.2.1) was attributed to the selected person(s). Before adjusting for non-response at the questionnaire level (section 9.6), the person weights of those selected to be fasted were adjusted to incorporate the fasted sub-sample sampling weights. An adjustment factor was derived by collection site and stratum as follows:
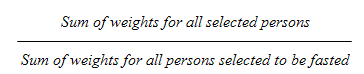
The weights of the persons selected to be fasted were accordingly multiplied by this adjustment factor. Persons who were not selected to be fasted are eliminated.
Adjustment for non-response at the questionnaire level and the MEC level (sections 9.6 and 9.7) were carried out on the fasted sub-sample.
An additional step was required to adjust for persons who were selected to be fasted, but had not fasted or did not provide blood. Such cases are defined as non-responses to the fasted sub-sample, and to compensate for this non-response, an adjustment factor was applied to the weights of the persons who fasted and gave blood. Just as for non-response at the collection site, dwelling (household), questionnaire and clinic levels, the adjustment is applied within classes defined on the basis of characteristics available for respondents and non-respondents. All the characteristics collected on the questionnaire during the household interview and measures taken at the clinic, in addition to geographic information and paradata, were made available to create these classes. The “score” method is used to define the classes. An adjustment factor is calculated within each class as follows:
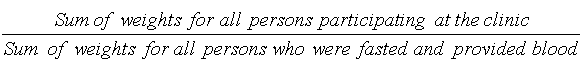
The weights of the persons who were fasted and provided blood were accordingly multiplied by this adjustment factor. Persons who were not fasted or did not provide blood were eliminated.
The final two steps, winsorization and calibration (see sections 9.8 and 9.8) were then applied to the fasted sub-sample. After calibration, the weight adjustment was obtained. The resulting weight is the final CHMS weight found in the fasted sub-sample data file bearing the variable name WGT_FAST.
9.11 Polybrominated diphenyl ether (PBDE) / Polychlorinated biphenyls (PCB) sub-sample
The steps described in section 9.10 (fasted sub-sample) were carried out. Only respondents aged 20 year old and over (at the time of the household interview) from the fasted sub-sample were kept. The resulting weight is the final CHMS weight found in the PBDE/PCB sub-sample data file bearing the variable name WGT_PBDE.
9.12 Inorganic mercury sub-sample
The steps described in sections 9.1 to 9.4 were carried out on the inorganic mercury sub-sample. At the person weight creation step (section 9.5) the inorganic mercury flag assigned to the dwellings (see section 5.3.2.3) was attributed to the selected person(s). Before adjusting for non-response at the questionnaire level (section 9.6), the person weights of those selected for the inorganic mercury sub-sample were adjusted to incorporate the inorganic mercury sub-sample sampling weights. An adjustment factor was derived by collection site and stratum as follows:
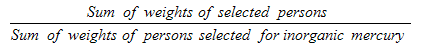
The weights of the persons selected for inorganic mercury were accordingly multiplied by this adjustment factor. Persons who were not selected for inorganic mercury are eliminated.
Adjustment for non-response at the questionnaire level and the MEC level (section 9.6 and 9.7) were carried out on the inorganic mercury sub-sample.
An additional step was required to adjust for persons who were selected for inorganic mercury but for whom the measure could not be performed. Such cases are defined as non-responses to the inorganic mercury sub-sample, and to compensate for this non-response, an adjustment factor was applied to the weights of the persons with a valid inorganic mercury measure. Just as for non-response at the collection site and dwelling (household) levels and clinic, the adjustment is applied within classes defined on the basis of characteristics available for respondents and non-respondents. All the characteristics collected on the questionnaire during the interview and measures taken at the clinic, in addition to geographic information and paradata, were made available to create these classes. The “score” method is used to define the classes. An adjustment factor is calculated within each class as follows:
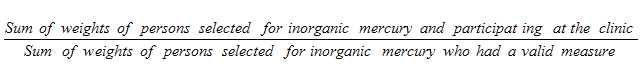
The weights of the persons who were selected for inorganic mercury who had a valid measure were accordingly multiplied by this adjustment factor. Persons who did not have a valid measure were eliminated.
The final two steps, winsorization and calibration (see sections 9.8 and 9.9) were then applied to the inorganic mercury sub-sample. After calibration, the weight adjustment was obtained. The resulting weight is the final CHMS weightfound in the inorganic mercury sub-sample data file bearing the variable name WGT_BIHG.
9.13 Perfluorinated compounds sub-sample
The steps described in sections 9.1 to 9.4 were carried out on the perfluorinated compounds sub-sample. At the person weight creation step (section 9.5) the perfluorinated compounds flag assigned to the dwellings (see section 5.3.2.4) was attributed to the selected person(s). Before adjusting for non-response at the questionnaire level (section 9.6), the person weights of those selected for the perfluorinated compounds sub-sample were adjusted to incorporate the perfluorinated compounds sub-sample sampling weights. An adjustment factor was derived by collection site and stratum as follows:
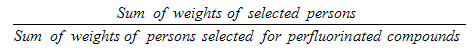
The weights of the persons selected for perfluorinated compounds were accordingly multiplied by this adjustment factor. Persons who were not selected for perfluorinated compounds are eliminated.
Adjustment for non-response at the questionnaire level and the MEC level (section 9.6 and 9.7) were carried out on the perfluorinated compounds sub-sample.
An additional step was required to adjust for persons who were selected for perfluorinated compounds for whom the measures could not be performed. Such cases are defined as non-responses to the perfluorinated compounds sub-sample, and to compensate for this non-response, an adjustment factor was applied to the weights of the persons with a valid perfluorinated compounds measure. Just as for non-response at the collection site and dwelling (household) levels and clinic, the adjustment is applied within classes defined on the basis of characteristics available for respondents and non-respondents. All the characteristics collected on the questionnaire during the interview and measures taken at the clinic, in addition to geographic information and paradata, were made available to create these classes. The “score” method is used to define the classes. An adjustment factor is calculated within each class as follows:
![]()
The weights of the persons who were selected for perfluorinated compounds who had a valid measure were accordingly multiplied by this adjustment factor. Persons who did not have a valid measure were eliminated.
The final two steps, winsorization and calibration (see sections 9.8 and 9.9) were then applied to the perfluorinated compounds sub-sample. After calibration, the weight adjustment was obtained. The resulting weight is the final CHMS weightfound in the perfluorinated compounds sub-sample data file bearing the variable name WGT_PFCS.
9.14 Activity monitor sub-sample
The steps described in sections 9.1 to 9.7 were carried out. Activity monitors were to be offered to all the clinic participants once their visits at the clinic was completed. However, due to technical problems, not all of them were offered the device. It is therefore necessary to take into account the clinic participants who were not offered to participate in this component of the survey. The weights of the 5,468 respondents for whom an activity monitor was offered were inflated to take into account the weights of the clinic respondents who were not offered one. An adjustment factor was derived by collection site and stratum as follows:
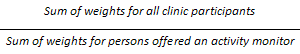
The weights of the persons offered an activity monitor were accordingly multiplied by this adjustment factor. Persons who were not offered an activity monitor are eliminated.
An additional step was required to adjust for persons who were offered an activity monitor but did not have four days or more of valid entries. Such cases are defined as non-responses to the activity monitor component, and to compensate for this non-response, an adjustment factor was applied to the weights of the persons who had four days or more of valid entries. Just as for non-response at the collection site and dwelling (household) levels and clinic, the adjustment is applied within classes defined on the basis of characteristics available for respondents and non-respondents. All the characteristics collected on the questionnaire during the interview and measures taken at the clinic, in addition to geographic information and paradata, were made available to create these classes. The "score" method is used to define the classes. An adjustment factor is calculated within each class as follows:
![]()
The weights of the persons who have valid entries for four days or more on their activity monitor were accordingly multiplied by this adjustment factor. Persons who had less than four days of valid entries were eliminated.
The final two steps, winsorization and calibration (see sections 9.8 and 9.9) were then applied to the respondents. After calibration, the weight adjustment was obtained. The resulting weight is the final CHMS weight found in the activity monitor data file bearing the variable name WGT_ACMO.
9.15 Phthalates sub-sample
The steps described in sections 9.1 to 9.4 were carried out on the phthalates sub-sample. At the person weight creation step (section 9.5) the phthalates flag assigned to the dwellings (see section 5.3.2.5) was attributed to the selected person(s). Before adjusting for non-response at the questionnaire level (section 9.6), the person weights of those selected for the phthalates sub-sample were adjusted to incorporate the phthalates sub-sample sampling weights. An adjustment factor was derived by collection site and stratum as follows:
![]()
The weights of the persons selected for phthalates were accordingly multiplied by this adjustment factor. Persons who were not selected for phthalates are eliminated.
Adjustment for non-response at the questionnaire level and the MEC level (section 9.6 and 9.9) were carried out on the phthalates sub-sample.
An additional step was required to adjust for persons who were selected for phthalates for whom the measures could not be performed. Such cases are defined as non-responses to the phthalates sub-sample, and to compensate for this non-response, an adjustment factor was applied to the weights of the persons with a valid phthalates measure. Just as for non-response at the collection site and dwelling (household) levels and clinic, the adjustment is applied within classes defined on the basis of characteristics available for respondents and non-respondents. All the characteristics collected on the questionnaire during the interview and measures taken at the clinic, in addition to geographic information and paradata, were made available to create these classes. The “score” method is used to define the classes. An adjustment factor is calculated within each class as follows:
![]()
The weights of the persons who were selected for phthalates who had a valid measure were accordingly multiplied by this adjustment factor. Persons who did not have a valid measure were eliminated.
The final two steps, winsorization and calibration (see sections 9.8 and 9.9) were then applied to the phthalates sub-sample. After calibration, the weight adjustment was obtained. The resulting weight is the final CHMS weightfound in the phthalates sub-sample data file bearing the variable name WGT_PHTH.
9.16 Tobacco sub-sample
The steps described in sections 9.1 to 9.7 were carried out. For the components that were being measured on clinic participants who provided urine and consented to storage of their urine sample for future health studies, an adjustment factor was necessary to compensate for those who did not provide urine or did not consent. Just as for non-response at the collection site and dwelling (household) levels and clinic, the adjustment is applied within classes defined on the basis of characteristics available for respondents and non-respondents. All characteristics collected on the questionnaire during the interview and measures taken at the clinic, in addition to geographic information and paradata, were made available to create these classes. The “score” method is used to define the classes. An adjustment factor is calculated within each class as follows:
![]()
The weights of persons who provided urine and consented to future studies were accordingly multiplied by this adjustment factor. Persons who did not provide urine or did not consent to storage of their urine for future studies were eliminated.
Each clinic participant aged 12 to 79 was assigned to a stratum defined by an age group (12 to 19, 20 to 39, 40 to 59 and 60 to 79) and a smoker status (smoker, non-smoker exposed to smoke and non-smoker non-exposed to smoke). To achieve the sample size of approximately 2,500 for the nicotine subsample, a sample has been selected among these participants. Some respondents were excluded because there was not enough urine left for analysis, mostly because their urine was used to perform other studies. These exclusions are considered random. To compensate for these exclusions and to factor in the nicotine sub-sample weights, an adjustment factor must be applied to the weights of the participants whose urine was analysed for the nicotine study. An ajustment factor is calculated within each of the age group by smoker status stratum as follow:
![]()
The weights of the persons 12 to 79 on whom nicotine analysis was performed were accordingly multiplied by this adjustment factor. Persons on whom nicotine analysis was not performed are eliminated.
The final two steps, winsorization and calibration (see sections 9.8 and 9.9) were then applied to the tobacco sub-sample. After calibration, the weight adjustment was obtained. The resulting weight is the final CHMS weightfound in the nicotine sub-sample data file bearing the variable name WGT_SMOK.
10. Data quality
10.1 Response rate
In all, 8,772 of the dwellings selected in the Canadian Health Measures Survey (CHMS) were within the scope of the survey10. Of these dwellings, 6,106 agreed to give the composition of the household, for a household response rate of 69.6%. From these respondent households, 7,483 persons were selected (one or two persons per household) to participate in the survey, of whom 6,604 agreed to respond to the questionnaire, for a response rate of 88.3%. Of these persons, 5,604 then reported to the CHMS mobile examination centre for physical measurements, for a response rate of 84.9%. At the Canadian scale, a combined response rate of 51.7% was observed for cycle 1 of the CHMS. It is important to note that the combined response rate is not obtained by multiplying the response rates by the person and household scales (at the questionnaire level and the clinic level), since two persons were selected in some households. Appendix 9a shows the combined response rates and the relevant information for calculating them for each site.
Below is a description of how the different components of the equation must be manipulated to calculate combined response rates correctly.
Response rate at the household scale

Response rate at the person scale among households where one person was selected (questionnaire)
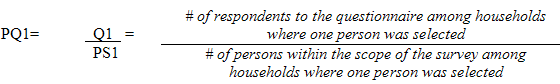
Response rate at the person scale among households where two persons were selected (questionnaire)
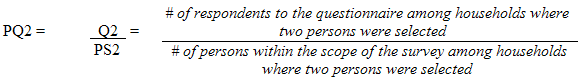
Response rate at the person scale among households where one person was selected (clinic)
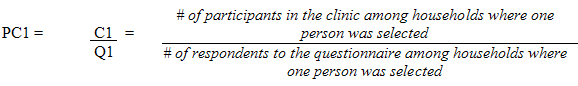
Response rate at the person scale among households where two persons were selected (clinic)
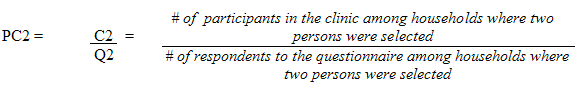
Ratio for households where one person was selected
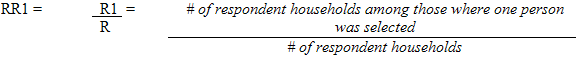
Note: The "# of respondent households among those where one person was selected" is neither more nor less than the number of persons selected among households where one person was selected in appendix 9a.
Ratio for households where two persons were selected (area frame)
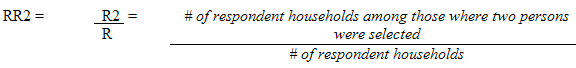
Note: It is important to note that the "# of respondent households among those where two persons were selected" is obtained by dividing by 2 the number of persons selected among household where two persons were selected in appendix 9a.
Once all the above components have been calculated, a user can calculate the combined response rate using the following formula.
Combined response rate
COMBRR = HR * [ (RR1 * PQ1 * PC1) + ( RR2 * PQ2 * PC2) ]
Below is an example of calculating the response rate at the household scale for Canada using the information provided in the appendix 9a.
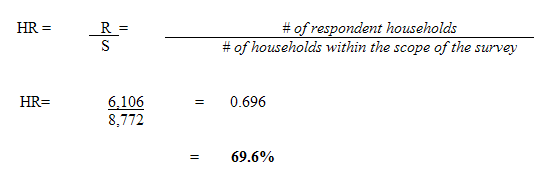
Now here is an example of calculating the combined response rate for Canada using the information provided in appendix 9a.
HR = 6,106 / 8,772 = 0.696
PQ1 = 4,158 / 4,734 = 0.878
PC1 = 3,463 / 4,158 = 0.833
PQ2 = 2,446 / 2,744 = 0.891
PC2 = 2,141 / 2,446 = 0.875
RR1 = 4,734 / 6,106 = 0.775
RR2 = 2,744 ÷ 2 / 6,106 = 0.225
Combined response rate = 0.696 * [ (0.775 * 0.878 * 0.833) + ( 0.225 * 0.891 * 0.875) ]
= 0.517
= 51.7%
10.1.1 Blood draw and Urine response rate
Although the file with the laboratory data includes all clinic participants, some laboratory analysis could not be performed because the respondents did not or could not provide blood or urine. Of the 5,604 participants who reported to the CHMS mobile examination centre for physical measurements, 5,373 participants provided blood and 5,540 provided urine. The combined response rate for blood draw was 50.0% whereas the combined response rate for urine was 51.2%. It is important to note that the combined response rate is not obtained by multiplying the response rates by the person and household scales, since two persons were selected in some households. Appendix 9b shows the combined response rates and the relevant information for calculating them for each site.
Below is a description of how the different components of the equation must be manipulated to calculate combined response rates correctly. Four additional response rates are required to derive the blood draw and the urine combined response rates:
Response rate at the person scale among households where one person was selected (blood draw)
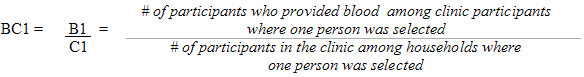
Response rate at the person scale among households where two persons were selected (blood draw)
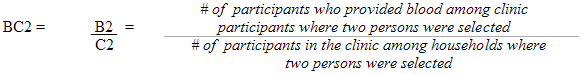
Response rate at the person scale among households where one person was selected (urine)
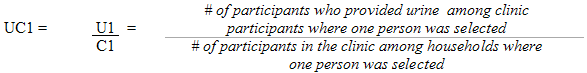
Response rate at the person scale among households where two persons were selected (urine)
Blood draw combined response rate
BCOMBRR = HR * [ (RR1 *PQ1 * PC1 * BC1 ) + ( RR2 * PQ2 * PC2 * BC2 )]
Urine combined response rate
UCOMBRR = HR * [ (RR1 *PQ1 * PC1 * UC1 ) + ( RR2 * PQ2 * PC2 * UC2) ]
where HR, RR1, PQ1, PC1, RR2, PQ2 and PC2 are described in section 10.1.
Now here is an example of calculating the Blood draw combined response rate for Canada using the information provided in Appendices 9 and 9b.
HR = 6,106 / 8,772 = 0.696
PQ1 = 4,158 / 4,734 = 0.878
PC1 = 3,463 / 4,158 = 0.833
PQ2 = 2,446 / 2,744 = 0.891
PC2 = 2,141 / 2,446 = 0.875
RR1 = 4,734 / 6,106 = 0.775
RR2 = (2,722 / 2) / 6,106 = 0.225
BC1 = 3,397 / 3,463 = 0.981
BC2 = 1,976 / 2,141 = 0.923
Blood draw combined response rate =
0.696 * [ (0.775 * 0.878 * 0.833 * 0.981) + ( 0.225 * 0.891 * 0.875 * 0.923) ]
= 0.500
= 50.0%
10.1.2 Fasted sub-sample response rate
From the 6,106 respondent households, 3,948 persons were selected (one or two persons per household) to participate in the fasted sub-sample, of whom 3,483 responded to the questionnaire, for a response rate of 88.2%. Of these persons, 2,969 then reported to the CHMS mobile examination centre for physical measurements, for a response rate of 85.2%. Of these persons, 2,634 were actually fasted and provided blood. At the Canadian scale, a combined response rate of 46.3% was observed. It is important to note that the combined response rate is not obtained by multiplying the response rates by the person and household scales, since two persons were selected in some households. Appendix 9c shows the fasted sub-sample combined response rates and the relevant information for calculating them for each site.
Below is a description of how the different components of the equation must be manipulated to calculate the combined response rate correctly.
Response rate at the person scale among households where one person was selected for the fasted sub-sample (questionnaire)
Response rate at the person scale among households where two persons were selected for the fasted sub-sample (questionnaire)
Response rate at the person scale among households where one person was selected for the fasted sub-sample (clinic)
Response rate at the person scale among households where two persons were selected for the fasted sub-sample clinic)
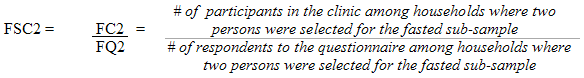
Response rate at the person scale among households where one person was selected for the fasted sub-sample (actually fasted and provided blood)
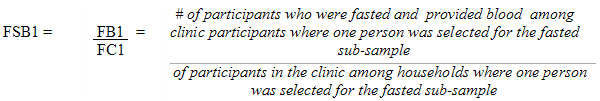
Response rate at the person scale among households where two persons were selected for the fasted sub-sample (actually fasted and provided blood)
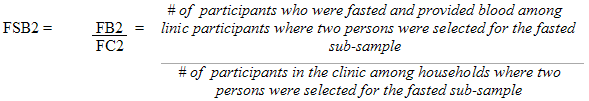
Fasted sub-sample combined response rate
FSCOMBRR = HR* [(RR1*FSQ1*FSC1*FSB1) + (RR2*FSQ2* FSC2* FSB2 )]
here HR, RR1 and RR2 are described in section 10.1.
Now here is an example of calculating the Fasted sub-sample combined response rate for Canada using the information provided in Appendices 9a and 9c.
HR = 6,106 / 8,772 = 0.696
PFSQ1 = 2,206 / 2,522 = 0.875
PFSC1 = 1,840 / 2,206 = 0.834
PFSQ2 = 1,277 / 1,426 = 0.896
PFSC2 = 1,129 / 1,277 = 0.884
PRR1 = 4,734 / 6,106 = 0.775
PRR2 = (2,744 / 2) / 6,106 = 0.225
PFSB1 = 1,672 / 1,840 = 0.909
PFSB2 = 962 / 1,129 = 0.852
Fasted sub-sample combined response rate =
0.696 * [ (0.775 * 0.875 * 0.834 * 0.909) + ( 0.225 * 0.896 * 0.884 * 0.852) ]
= 0.463
= 46.3%
10.1.3 Polybrominated diphenyl ether (PBDE) / Polychlorinated biphenyls (PCB) sub-sample response rates
From the 6,106 respondent households, 2,513 persons were select to participate in the PBDE/PCB sub-sample, of whom 2,203 responded to the questionnaire, for a response rate of 87.7%. Of these persons, 1,841 then reported to the CHMS mobile examination centre for physical measurements, for a response rate of 83.6%. Of these persons, 1,696 were actually fasted and provided blood. At the Canadian scale, a combined response rate of 47.0% was observed. It is important to note that the combined response rate is not necessarily obtained by multiplying the response rates by the person and household scales, since two persons were selected in some households. Appendix 9d shows the PBDE/PCB sub-sample combined response rates and the relevant information for calculating them for each site.
Below is a description of how the different components of the equation must be manipulated to calculate the combined response rate correctly.
Questionnaire response rate at the person scale for the PBDE/PCB sub-sample among households where one person was selected
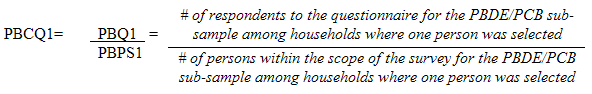
Questionnaire response rate at the person scale for the PBDE/PCB sub-sample among households where two persons were selected
Clinic response rate at the person scale for the PBDE/PCB sub-sample among households where one person was selected
Clinic response rate at the person scale for the PBDE/PCB sub-sample among households where two persons were selected
Response rate at the person scale of people who were actually fasted and provided blood for the PBDE/PCB sub-sample among households where one person was selected
Response rate at the person scale of people who were actually fasted and provided blood for the PBDE/PCB sub-sample among households where two persons were selected
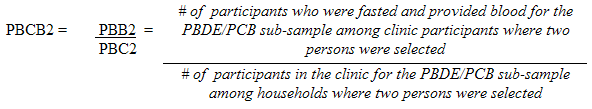
PBDE/PCB sub-sample combined response rate
PBCOMBRR = HR* [(RR1*PBCQ1*PBCC1*PBCB1) + (RR2*PBCQ2* PBCC2* PBCB2 )]
where HR, RR1 and RR2 are described in section 10.1.
Now here is an example of calculating the PBDE/PCB sub-sample combined response rate for Canada using the information provided Appendices 9a and 9d.
HR = 6,106 / 8,772 = 00.696
PPBCQ1 = 1,745 / 1,983 = 0.880
PPBCC1 = 1,438 / 1,745 = 0.824
PPBCQ2 = 458 / 530 = 0.864
PPBCC2 = 403 / 458 = 0.880
PRR1 = 4,734 / 6,106 = 0.775
PRR2 = 2,744/2 / 6,106 = 0.225
PPBCB1 = 1,324 / 1,438 = 0.921
PPBCB2 = 372 / 403 = 0.923
PBDE/PCB sub-sample combined response rate =
0.696 * [ (0.775 * 0.880 * 0.824 * 0.921) + ( 0.225 * 0.864 * 0.880 * 0.923) ]
= 0.470
= 47.0%
10.1.4 Inorganic mercury sub-sample response rates
From the 6,106 respondent households, 1,592 persons were selected to participate in the Inorganic mercury sub-sample, of whom 1,414 responded to the questionnaire, for a response rate of 88.8%. Of these persons, 1,191 then reported to the CHMS mobile examination centre for physical measurements, for a response rate of 84.2%. Of these persons, 1,123 had a measure done. At the Canadian scale, a combined response rate of 49.4% was observed. It is important to note that the combined response rate is not necessarily obtained by multiplying the response rates by the person and household scales, since two persons were selected in some households. Appendix 9e shows the Inorganic mercury sub-sample combined response rates and the relevant information for calculating them for each site.
Below is a description of how the different components of the equation must be manipulated to calculate the combined response rate correctly.
Questionnaire response rate at the person scale for the Inorganic mercury sub-sample among households where one person was selected
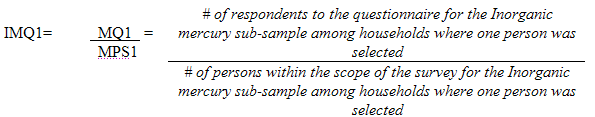
Questionnaire response rate at the person scale for the Inorganic mercury sub-sample among households where two persons were selected
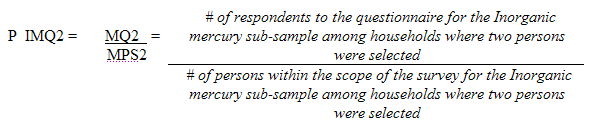
Clinic response rate at the person scale for the Inorganic mercury sub-sample among households where one person was selected
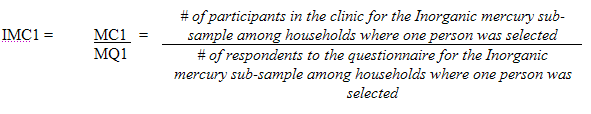
Clinic response rate at the person scale for the Inorganic mercury sub-sample among households where two persons were selected
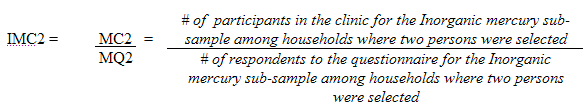
Response rate at the person scale of people who were actually fasted and provided blood for the Inorganic mercury sub-sample among households where one person was selected
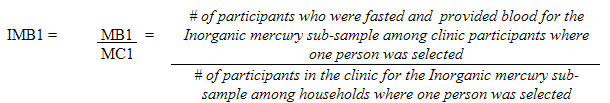
Response rate at the person scale of people who were actually fasted and provided blood for the Inorganic mercury sub-sample among households where two persons were selected
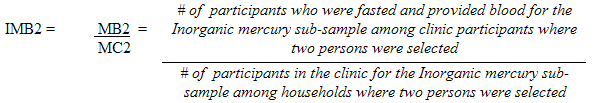
Inorganic mercury sub-sample combined response rate
IMCOMBRR = HR* [(RR1*IMQ1*IMC1*IMB1) + (RR2*IMQ2* IMC2* IMB2)]
where HR, RR1 and RR2 are described in section 10.1.
Now here is an example of calculating the Inorganic mercury sub-sample combined response rate for Canada using the information provided in Appendices 9a and 9e.
HR = 6,106 / 8,772 = 00.696
PIMQ1 = 868 / 981 = 0.885
PIMC1 = 719 / 868 = 0.828
PIMQ2 = 546 / 611 = 0.894
PIMC2 = 472 / 546 = 0.864
PRR1 = 4,734 / 6,106 = 0.775
PRR2 = 2,744/2 / 6,106 = 0.225
PIMB1 = 702 / 719 = 0.976
PIMB2 = 421 / 472 = 0.892
Inorganic mercury sub-sample combined response rate =
0.696 * [ (0.775 * 0.885 * 0.828 * 0.976) + ( 0.225 * 0.894 * 0.864 * 0.892) ]
= 0.494
= 49.4%
10.1.5 Perfluorinated compounds sub-sample response rates
From the 6,106 respondent households, 4,036 persons were selected to participate in the Perfluorinated compounds sub-sample, of whom 3,563 responded to the questionnaire, for a response rate of 88.3%. Of these persons, 2,971 then reported to the CHMS mobile examination centre for physical measurements, for a response rate of 83.4%. Of these persons, 2,880 had a measure done. At the Canadian scale, a combined response rate of 49.7% was observed. It is important to note that the combined response rate is not necessarily obtained by multiplying the response rates by the person and household scales, since two persons were selected in some households. Appendix 9f shows the Perfluorinated compounds sub-sample combined response rates and the relevant information for calculating them for each site.
Below is a description of how the different components of the equation must be manipulated to calculate the combined response rate correctly.
Questionnaire response rate at the person scale for the Perfluorinated compounds sub-sample among households where one person was selected
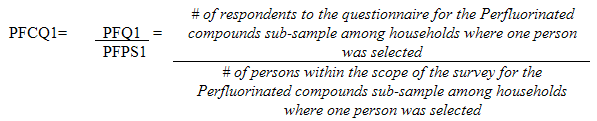
Questionnaire response rate at the person scale for the Perfluorinated compounds sub-sample among households where two persons were selected
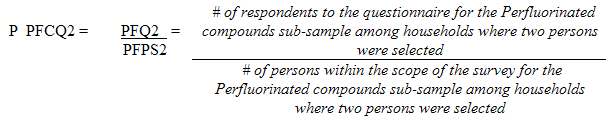
Clinic response rate at the person scale for the Perfluorinated compounds sub-sample among households where one person was selected
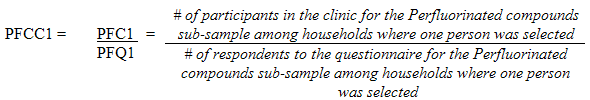
Clinic response rate at the person scale for the Perfluorinated compounds sub-sample among households where two persons were selected
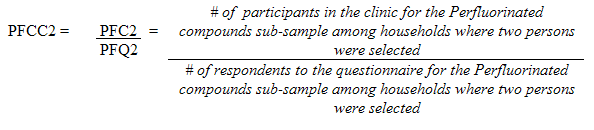
Response rate at the person scale of people who were actually fasted and provided blood for the Perfluorinated compounds sub-sample among households where one person was selected
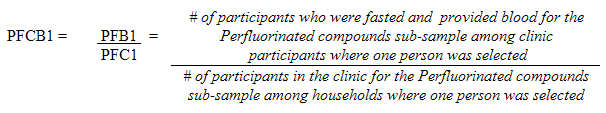
Response rate at the person scale of people who were actually fasted and provided blood for the Perfluorinated compounds sub-sample among households where two persons were selected
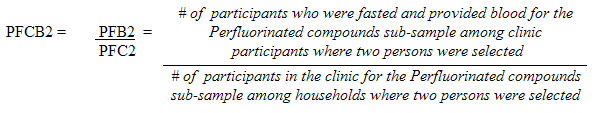
Perfluorinated compounds sub-sample combined response rate
PFCCOMBRR = HR* [(RR1*PFCQ1*PFCC1*PFCB1) + (RR2*PFCQ2* PFCC2* PFCB2)]
where HR, RR1 and RR2 are described in section 10.1.
Now here is an example of calculating the Perfluorinated compounds sub-sample combined response rate for Canada using the information provided in Appendices 9a and 9f.
HR = 6,106 / 8,772 = 00.696
PPFCQ1 = 2,798 / 3,167 = 0.883
PPFCC1 = 2,308 / 2,798 = 0.825
PPFCQ2 = 765 / 869 = 0.880
PPFCC2 = 663 / 765 = 0.867
PRR1 = 4,734 / 6,106 = 0.775
PRR2 = 2,744/2 / 6,106 = 0.225
PPFCB1 = 2,242 / 2,308 = 0.971
PPFCB2 = 638 / 663 = 0.962
Perfluorinated compounds sub-sample combined response rate =
0.696 * [ (0.775 * 0.883 * 0.825 * 0.971) + ( 0.225 * 0.880 * 0.867 * 0.962) ]
= 0.497
= 49.7%
10.1.6 Activity monitor response rate
Of the 5,604 participants who reported to the CHMS mobile examination centre for physical measurements, 5,468 participants were offered an activity monitor. Of these persons, 4,441 returned the activity monitor with at least four days of valid entries. The combined response rate for the activity monitor was 41.8%. It is important to note that the combined response rate is not obtained by multiplying the response rates by the person and household scales, since two persons were selected in some households. Appendix 9g shows the combined response rates and the relevant information for calculating them for each site.
Below is a description of how the different components of the equation must be manipulated to calculate combined response rates correctly. Two additional response rates are required to derive the activity monitor combined response rates:
Response rate at the person scale among households where one person was selected (activity monitor)
AM1= V1 / OF1 = # of participants who returned the activity monitor with at least four days of valid entries among clinic participants where one person was selected / # of participants in the clinic who were offered an activity monitor among households where one person was selected
Response rate at the person scale among households where two persons were selected (activity monitor)
AM2= V2 / OF2 = # of participants who returned the activity monitor with at least four days of valid entries among clinic participants where two persons were selected / # of participants in the clinic who were offered an activity monitor among households where two persons were selected
Activity monitor combined response rate
AMCBRR = HR * [ (RR1 * PQ1 * PC1 * AM1 ) + ( RR2 * PQ2 * PC2 * AM2 )]
where HR, RR1, PQ1, PC1, RR2, PQ2 and PC2 are described in section 10.1.
Now here is an example of calculating the activity monitor combined response rate for Canada using the information provided in Appendices 9a and 9g.
HR = 6,106 / 8,772 = 0.696
PPQ1 = 4,158 / 4,734 = 0.878
PPC1 = 3,463 / 4,158 = 0.833
PPQ2 = 2,446 / 2,744 = 0.891
PPC2 = 2,141 / 2,446 = 0.875
PRR1 = 4,734 / 6,106 = 0.775
PRR2 = (2,744 / 2) / 6,106 = 0.225
PAM1 = 2,709 / 3,372 = 0.803
PAM2 = 1,732 / 2,096 = 0.826
Activity monitor combined response rate =
0.696 * [ (0.775 * 0.878 * 0.833 * 0.803) + ( 0.225 * 0.891 * 0.875 * 0.826) ]
= 0.418
= 41.8%
10.1.7 Phthalates sub-sample response rates
From the 6,106 respondent households, 4,439 persons were selected to participate in the Phthalates sub-sample, of whom 3,902 responded to the questionnaire, for a response rate of 87.9%. Of these persons, 3,310 then reported to the CHMS mobile examination centre for physical measurements, for a response rate of 84.8%. Of these persons, 3,237 had a measure done. At the Canadian scale, a combined response rate of 50.1% was observed. It is important to note that the combined response rate is not necessarily obtained by multiplying the response rates by the person and household scales, since two persons were selected in some households. Appendix 9h shows the Phthalates sub-sample combined response rates and the relevant information for calculating them for each site.
Below is a description of how the different components of the equation must be manipulated to calculate the combined response rate correctly.
Questionnaire response rate at the person scale for the Phthalates sub-sample among households where one person was selected
PHTQ1 = PHQ1 / PHPS1 = # of respondents to the questionnaire for the Phthalates sub-sample among households where one person was selected / # of persons within the scope of the survey for the Phthalates sub-sample among households where one person was selected
Questionnaire response rate at the person scale for the Phthalates sub-sample among households where two persons were selected
PHTQ2 = PHQ2 / PHPS2 = # of respondents to the questionnaire for the Phthalates sub-sample among households where two persons were selected / # of persons within the scope of the survey for the Phthalates sub-sample among households where two persons were selected
Clinic response rate at the person scale for the Phthalates sub-sample among households where one person was selected
PHTC1 = PHC1 / PHQ1 = # of participants in the clinic for the Phthalates sub-sample among households where one person was selected / # of respondents to the questionnaire for the Phthalates sub-sample among households where one person was selected
Clinic response rate at the person scale for the Phthalates sub-sample among households where two persons were selected
PHTC2 = PHC2 / PHQ2 = # of participants in the clinic for the Phthalates sub-sample among households where two persons were selected / # of respondents to the questionnaire for the Phthalates sub-sample among households where two persons were selected
Response rate at the person scale of people who were actually fasted and provided blood for the Phthalates sub-sample among households where one person was selected
PHTB1 = PHB1 / PHC1 = # of participants who were fasted and provided blood for the Phthalates sub-sample among clinic participants where one person was selected / of participants in the clinic for the Phthalates sub-sample among households where one person was selected
Response rate at the person scale of people who were actually fasted and provided blood for the Phthalates sub-sample among households where two persons were selected
PHTB2 = PHB2 / PHC2 = # of participants who were fasted and provided blood for the Phthalates sub-sample among clinic participants where two persons were selected / # of participants in the clinic for the Phthalates sub-sample among households where two persons were selected
Phthalates sub-sample combined response rate
PHTCOMBRR = HR* [(RR1*PHTQ1*PHTC1*PHTB1) + (RR2*PHTQ2* PHTC2* PHTB2)]
where HR, RR1 and RR2 are described in section 10.1.
Now here is an example of calculating the Phthalates sub-sample combined response rate for Canada using the information provided in Appendixes 9a and 9h.
HR = 6,106 / 8,772 = 0.696
PHTQ1 = 2,348 / 2,720 = 0.863
PHTC1 = 1,948 / 2,348 = 0.830
PHTQ2 = 1,554 / 1,719 = 0.904
PHTC2 = 1,362 / 1,554 = 0.876
RR1 = 4,734 / 6,106 = 0.775
RR2 = 2,744/2 / 6,106 = 0.225
PHTB1 = 1,921 / 1,948 = 0.986
PHTB2 = 1,316 / 1,362 = 0.966
Phthalates sub-sample combined response rate =
0.696 * [ (0.775 * 0.863 * 0.830 * 0.986) + ( 0.225 * 0.904 * 0.876 * 0.966) ]
= 0.501
= 50.1%
10.1.8 Tobacco sub-sample response rate
Of the 4,530 participants aged 12 to 79 who reported to the CHMS mobile examination centre for physical measurements, 4,356 participants provided urine and consented to storage of their urine sample for future health studies. The tobacco sub-sample was selected among these participants. The combined response rate was 50.1%. It is important to note that the combined response rate is not obtained by multiplying the response rates by the person and household scales, since two persons were selected in some households. Appendix 9i shows the combined response rates and the relevant information for calculating them for each site.
Below is a description of how the different components of the equation must be manipulated to calculate combined response rates correctly. Two additional response rates are required to derive the tobacco sub-sample combined response rates:
Response rate at the person scale among households where one person was selected (tobacco)
NN1= UC / C1 = # of participants in the clinic who provided urine and consented to storage of their urine sample for future health studies in households where one person was selected / # of participants in the clinic among households where one person was selected
Response rate at the person scale among households where two persons were selected (tobacco)
NN2= UC2 / C2 = # of participants in the clinic who provided urine and consented to storage of their urine sample for future health studies in households where two persons were selected / # of participants in the clinic among households where two persons were selected
Tobacco sub-sample combined response rate
NNCBRR = HR * [ (RR1 * PQ1 * PC1 * NN1 ) + ( RR2 * PQ2 * PC2 * NN2 )]
where HR, RR1, PQ1, PC1, RR2, PQ2 and PC2 are described in section 10.1.
Now here is an example of calculating the tobacco sub-sample combined response rate for Canada using the information provided in Appendixes 9a and 9i.
HR = 6,106 / 8,772 = 0.696
PQ1 (12 to 79 only) = 4,156 / 4,732 = 0.878
PC1 (12 to 79 only) = 3,462 / 4,156 = 0.833
PQ2 (12 to 79 only) = 1,200 / 1,373 = 0.874
PC2 (12 to 79 only) = 1,068 / 1,200 = 0.890
RR1 = 4,734 / 6,106 = 0.775
RR2 = 2,744/2 / 6,106 = 0.225
NN1 (12 to 79 only) = 3,330 / 3,462 = 0.962
NN2 (12 to 79 only) = 1,026 / 1,068 = 0.961
Tobacco sub-sample combined response rate =
0.696 * [ (0.775 * 0.878 * 0.833 * 0.962) + ( 0.225 * 0.874 * 0.890 * 0.961) ]
= 0.501
= 50.1%
10.2 Errors in surveys
The survey yields estimates based on the information collected from a sample of persons. Somewhat different estimates might have been obtained if a complete census had been conducted using the same questionnaire, the same interviewers, the same measurement experts, the same supervisors, the same processing methods, etc. as used for the survey. The difference between the estimates based on the sample and those resulting from a complete enumeration conducted in similar conditions is called the sampling error of the estimates.
Errors that are not related to sampling may be made at almost any stage of a survey. Interviewers may have misunderstood the instructions; respondents may have made errors when completing the questionnaire; responses may have been incorrectly captured; measurements may have been made incorrectly; errors may have crept in when the data were processed and totalled. All these are examples of non-sampling errors.
Over a great number of observations, random errors will have little effect on the estimates drawn from the survey. However, errors that occur systematically will contribute to biases in the estimates from the survey. Much time and effort was devoted to reducing non-sampling errors in the survey. Quality assurance measures were applied at each stage of the data collection and processing cycle to control the quality of the data. Further details on the quality assurance procedures for each stage of the survey are provided in the Quality Assurance and Control section.
The effect of non-response on survey results is a major source of non-sampling error in surveys. The scope of non-response varies from partial non-response (where the respondent does not respond to one or more questions) to total non-response. In cycle 1 of the CHMS, there is little partial non-response, since once the questionnaire began, respondents tended to complete it. There was total non-response when the person selected to participate in the survey refused to do so or could not be contacted by the interviewer. In some collection sites, the sample was augmented over the course of the year in order to reach the targeted size. Lastly, cases of total non-response were taken into account during weighting by correcting the weights of persons who responded to the survey in order to compensate for those who did not respond. See chapter 9 (Weighting) for more information on the correction of weighting for non-response.
Since the estimates from a sampling survey inevitably include sampling errors, good statistical methods require researchers to provide users with some indication of the scope of this error. Measuring the possible scope of sampling errors is based on the standard deviation of the estimates drawn from the survey results. However, owing to the great diversity of estimates that can be drawn from a survey, the standard deviation of an estimate is usually expressed in terms of the estimate that it relates to. The resulting measure, called the coefficient of variation (CV), is obtained by dividing the standard deviation of the estimate by the estimate itself, and it is expressed as a percentage of the estimate.
For example, assume that a person estimates that 20% of Canadians aged 12 to 79 smoke regularly and this estimate has a standard deviation of 0.005. The CV of this estimate is then calculated as follows:
(0.005/0.20) x 100% = 2.5%
Statistics Canada often uses the CV results for data analysis, and it strongly advises users producing estimates based on the data files from cycle 1 of the CHMS to do the same.
| Type of Estimate | CV (in %) | Guidelines |
|---|---|---|
| Acceptable | 0.0 ≤ CV ≤ 16.6 | Estimates can be considered for general unrestricted release. Requires no special notation. |
| Marginal | 16.6 < CV ≤ 33.3 | Estimates can be considered for general unrestricted release but should be accompanied by a warning cautioning subsequent users of the high sampling variability associated with the estimates. Such estimates should be identified by the letter E (or in some other similar fashion). |
| Unacceptable | CV > 33.3 | Statistics Canada recommends not to release estimates of unacceptable quality. However, if the user chooses to do so then estimates should be flagged with the letter F (or in some other fashion) and the following warning should accompany the estimates: "The user is advised that . . . (specify the data) . . . do not meet Statistics Canada's quality standards for this statistical program. Conclusions based on these data will be unreliable and most likely invalid. These data and any consequent findings should not be published. If the user chooses to publish these data or findings, then this disclaimer must be published with the data." |
10.3 Quality assurance and control
There are many problems that can introduce errors in a direct measures survey. These errors can significantly affect the integrity of survey results. To ensure the success of the Canadian Health Measures Survey (CHMS) in meeting its objectives, quality assurance and quality control measures were implemented in all the processes. Quality assurance (QA) anticipates problems, and therefore consists of those activities that take place before data collection or in improving and refining data collection. Quality control (QC) responds to observed problems and thus consists of those activities that take place during and after data collection. The goal of QA, and QC, is to ensure the reliability and validity of the data and to reduce systematic bias to the lowest possible level.
10.3.1 Training of household interview and mobile examination centre (MEC) Staff
10.3.1.1 Initial trainingTraining of all staff emphasized the goals and objectives of the survey, survey methodology and quality control guidelines. Training also included questionnaire/application content and functionality, standardization of survey procedures, data transmission, refusal conversion techniques and administrative procedures.
Training involved both formal classroom training and mandatory reading of procedures and training manuals. The core of the position specific training involved hands-on practice with instructors. Experts from various fields related to the survey measures (e.g., blood pressure) and biospecimen collection/processing protocols provided seminar sessions to the appropriate staff and participated in aspects of the hands-on training.
Household interviewers:
A week of training was provided to household interviewers. Household interviewers took part in mock interviews to familiarize themselves with the household questionnaire, to simulate difficult situations and to practice potential non-response situations. They also discussed techniques for dealing with sensitive questions.
Retraining was conducted with household interviewers anytime a change was made with the application, or when clarification was needed on the household questionnaire. Formal and informal training was on-going in order to ensure that proper protocols were followed.
Mobile examination centre staff:
A month of training was provided to MEC staff prior to collection. The administrative staff received specific training on refusal conversion techniques, telephone skills and on the calibration and maintenance of the dental equipment.
The health measures specialists were provided additional training on calibration and maintenance of equipment, health and occupational safety guidelines (including both respondent and staff safety), emergency procedures and media awareness. They also received specific training on Canadian Physical Activity, Fitness and Lifestyle Approach (CPAFLA)3 protocols, blood pressure and heart rate measurement, spirometry and on how to accommodate respondents with disabilities.
The laboratory technologists received supplementary training on blood and urine collection, processing, storage and running of laboratory tests, as well as re-enforcement training on laboratory protocols.
The dentists received specific training on the CHMS dental examination procedure and were calibrated against the World Health Organization gold standard.
The site logistics officer received specific training on how to set-up the trailers for the beginning of collection at each site and how to prepare the trailers for their move to the next collection site once collection was finished. As well, the site logistics officers received training on information technology maintenance and troubleshooting.
10.3.1.2 Dress rehearsalBefore the start of the actual survey, a one month dress rehearsal was done in Ottawa using Statistics Canada, Health Canada and Public Health Agency of Canada employees and their relatives who volunteered. The purpose of the dress rehearsal was to allow both the household interview staff and the MEC staff to practice their skills before beginning collection. The MEC staff had the opportunity to set-up, run and prepare the MEC trailers for transport to another location in the same format as was to be done during the actual survey. This included booking volunteers into the mobile examination centre using the same schedule that the staff was going to use when operating at a site. The dress rehearsal also allowed the MEC staff the opportunity to refine the flow through the MEC and work on other processes that needed testing (e.g., shipping). The dress rehearsal allowed for verification of the accuracy of the documentation (e.g., procedures manuals), and the household interview and MEC staff's understanding of the procedures, processes, and the flows. It also allowed for training/re-training issues to be identified prior to going into the field.
10.3.1.3 Ongoing training – Dry run dayPrior to the start of collection at each site, one day was set aside for community volunteers to participate in a visit to the MEC. These days were referred to as dry runs. The purpose of the dry runs was to perform on-going training for the MEC team. It gave them the opportunity to practice their skills before the beginning of collection at every site, as well as ensure that all the equipment was functioning correctly.
10.3.1.4 Annual retrainingHalf way through cycle 1, the household interviewers took part in a debriefing and retraining session. During this session items that were discussed included refusal avoidance and conversion techniques, techniques on dealing with non-response and how to handle sensitive questions.
An eight day annual retraining was attended by MEC staff, during the middle of cycle 1 at head office. These sessions were similar to the initial training and were performed in collaboration with experts in different fields related to the survey but focused on elements that specifically needed retraining.
10.3.2 Household component
10.3.2.1 Monitoring – Household interviewMonitoring of the work performed by the household interviewers was an integral part of the household collection processes. Observations were completed on all interviewers at the beginning of the collection cycle and, thereafter, two to three scheduled observations were done at each site as well as on an ad hoc basis. Debriefing sessions were held in seven of the fifteen sites where factors affecting data quality were discussed.
In addition to monitoring the work of the interviewers, staff from head office performed interview observations to monitor the functionality of the household interviewing system, the respondents' understanding of the household survey content and the usefulness of the communications tools. Observers provided feedback on these items to the content development and communications teams at head office and problems were addressed as required.
10.3.2.2 Household questionnaire response ratesMonitoring the household collection response rates was conducted throughout the cycle by staff at head office preparing collection progress reports. Staff monitored the reasons for non response by age and sex, the number of contact attempts, the distribution of contact attempts by time of day, the refusal rates and refusal conversions attempts and the distribution of the fasting/non-fasting flag to ensure that the target number of respondents per age and sex group would be achieved.
10.3.2.3 Validation of questionnaire responsesAt the end of each site notes and remarks made by interviewers within a respondent's case file were reviewed and adjustments to the data were made, when required. In addition, the frequency of answer categories within a question was determined for "other, specify", "don't know", and "refusal". Questions with a high rate of response for these categories were monitored according to expected rates from other Statistics Canada health surveys and investigated if the rate was higher than expected. These data were also monitored between CHMS collection sites to identify site-specific problems.
Validation of questionnaire responses was also performed on questions that are included in other Statistics Canada health survey with similar content, namely cycles 3.1 and 4.1 of the Canadian Community Health Survey.
10.3.3 Mobile examination centre (MEC) component
The following section will provide information concerning the quality assurance and quality control procedures that were put in place and are specific to collection of the physical measures and laboratory data during the visit to the MEC.
10.3.3.1 Equipment selectionThe quality of the equipment used for collection was essential to ensure data accuracy and validity. In selecting the appropriate equipment, a combination of consulting, researching, testing, and evaluation was employed. This was done considering industry standards and in conjunction with partners (e.g., Health Canada, Public Health Agency of Canada), experts from other physical measures surveys (e.g., NHANES in the United States) and CHMS advisory committees.
When determining the MEC laboratory equipment needs, many considerations were taken into account such as the size of the equipment (due to space constraints), the cost of the equipment, the accuracy and precision of the testing equipment, as well as the comparability to other international surveys. The reliability of the instrumentation, including frequency of breakdowns, repairs and maintenance, were also examined. Other items considered when selecting the equipment used for data collection include the infrastructure needs (e.g., use of water, energy consumption, waste disposal), the ease of operation and maintenance, training courses included, the availability and timeliness of service throughout the country, the laboratory biosafety guidelines and the test throughput.
10.3.3.2 Protocols and proceduresTo ensure consistency between MEC staff on all measurement techniques, several procedures manuals containing detailed protocols for each measure were developed. These protocols were developed in consultation with, and reviewed by experts in each measurement field (when appropriate), ensuring the highest quality and least biased data collection. For standardization purposes, these protocols were covered thoroughly during staff training and scripted within the data capture application. Staff were required to review these protocols periodically during collection so as to keep themselves up to date. When changes to protocols were made all staff members were informed, provided with the updated protocols and re-training was provided if necessary. All changes to protocols were documented (date of update, reason for updating, process that was followed).
An Equipment Verification, Calibration and Maintenance Manual was also developed to ensure that calibration and maintenance of all testing equipment during collection was performed to meet or exceed the established standards. These standards were established by the equipment manufacturers and the experts with whom we consulted for the clinic laboratory standard operating procedures (SOP). This included pre-analytical functions (mixing, aliquoting), testing protocols (e.g., complete blood count (CBC)), non-testing procedures (e.g., specimen storage and shipping), quality control procedures and equipment use, calibration and maintenance.
All three CHMS reference laboratories also followed standard operating procedures that were developed for every test and technique performed in their laboratory. These provided uniform assay protocols that laboratory staff used to ensure similar results and consistent performance.
10.3.3.3 Mobile examination centre (MEC) environmentAll efforts were made to ensure measurements were carried out under controlled and standardized conditions and according to specified procedures. Due to the fact that certain measures and equipment were highly sensitive to changes in room temperature (e.g., spirometry, blood pressure, laboratory equipment), every effort was made to keep the MEC at a comfortable and constant room temperature (21°C ± 2°C). The environmental conditions of the MEC testing rooms (temperature, humidity and barometric pressure) were recorded at a minimum once per shift as well as anytime the temperature went outside of the ± 2°C range. In addition, careful monitoring of the conditions within the mobile examination centre laboratory was undertaken to ensure that the collection, analysis, storage and shipment of samples was performed under the appropriate conditions.
10.3.3.4 Adherence to pre-testing guidelinesAt the beginning of the visit to the MEC adherence to the pre-testing guidelines (see appendix 1) was verified and documented within the data capture application and adherence rates were assessed at head office. The purpose of these guidelines was to ensure testing standardization, by minimizing the potential that external factors would affect the results of certain tests. Pre-testing standardization was done to enhance the quality of the data collected.
10.3.3.5 Equipment monitoringRegular verification, calibration and maintenance of all the equipment used for data collection during the CHMS was performed to ensure data accuracy and validity. This testing was performed to meet or exceed the standards established by the equipment manufacturers and/or by experts in the field.
10.3.3.6 Data entry verificationAll paper forms such as the respondent verification sheet, the consent form, the PAR-Q as well as all the worksheets from the home visits or MEC visits done on paper, were manually entered and subsequently verified by a manager to ensure data entry accuracy.
10.3.3.7 Spirometry data reviewAll spirometry tests were reviewed by an external reviewer via a custom application that was developed for the CHMS. The application was designed to reject invalid curves based on American Thoracic Society testing11 criteria and the reviewer's role was to confirm these rejections as well as to identify other ones not flagged by the application.
10.3.3.8 Data validationData validation was performed to ensure that the CHMS data were consistent with other similar data sources including other Statistics Canada surveys, as well as international surveys. Data validation was done to compare various physical measures, laboratory measures and the oral health data by site, and to compare self-reported data from the household interview to directly measured data from the MEC visit (e.g., height, weight), by site and overall. The physical measures and oral health data were also compared against data sources that contained directly measured data, such as the Canadian Community Health Survey cycle 2.2 (physical measures only) and the National Health and Nutrition Examination Survey (NHANES) in the United States.
All CBC data received from the mobile examination centre were monitored by comparing the mean values and standard deviations to a normal reference range in order to identify any increased outliers and trends in the QC, findings and respondent results. The laboratory measures analyzed by the reference laboratories were also examined and compared to other surveys such as NHANES.
Prior to the release of cycle 1 data, external data validation was performed by making information available to Health Canada and the Public Health Agency of Canada who informed Statistics Canada of any concerns or anomalies related to data quality.
10.3.3.9 Mobile examination centre (MEC) laboratoryProcedures were put into place to allow for quick detection of errors related to the MEC laboratory CBC analysis. These procedures included internal and external QC, monitoring, and allowed the CHMS to ensure accurate results and data quality for laboratory measures. Aside from weekly review, regular comparisons were made with QC, results obtained by other users of the haematology analyzer employed by the CHMS. In addition, external QC, material from the College of American Pathologists (CAP) and Quality Management Program – Laboratory Service (QMP-LS) were tested according to their respective schedules. The results of these blind QC, samples provided an evaluation of the testing accuracy.
10.3.3.10 Replicate TestingReplicate samples were collected during dry-run days at the beginning of each site for a variety of laboratory tests, including the complete blood count, and tests analyzed at the reference laboratories (Health Canada only). Approximately 6-8 dry-run replicate samples were performed by splitting the blood and urine samples from the participants into two distinct specimen tubes with different identification numbers (IDs). As the corresponding split sample IDs were unknown to the technician/technologist testing the samples, these “blind QC, samples” were meant to monitor the precision of the assay and poor performance was inferred if the coefficient of variation obtained from the replicate samples is greater than a pre-set criteria. All replicate samples were sent to the reference laboratories along with other respondent samples and were analyzed following the same procedures as respondent samples. Data from the dry-run replicate samples were transmitted as usual along with the other respondent results. The lab section at the head office analysed them and all results outside of the acceptable limit were followed up on with the testing laboratory. Replicates were also done at the MEC on the anthropometry, sit and reach and grip strength components.
10.3.3.11 Proficiency TestingAll CHMS reference laboratories were responsible for having their own quality control programs in place. However, the CHMS also sent reference quality control materials as a form of proficiency testing for the reference laboratories. The CHMS used BioRad control samples with known concentration for all tests included in the CHMS for which reference QC, samples were available. The use of these materials allowed the CHMS to monitor the accuracy of the analytical testing being performed at the reference labs. The CHMS mobile examination centre laboratory sent these BioRad samples to the reference laboratories on a weekly basis during each collection site along with the regular shipments. The test samples were aliquotted into the same type of shipping tubes used for respondent samples and were labelled with unique sample identification numbers so as to blind the laboratories to the process. Testing results were sent back to the CHMS head office and were compared to the reference ranges provided by BioRad. The test results were assessed by head office laboratory staff and feedback was provided to the reference laboratories for review and remedial action, if necessary.
10.3.3.12 Processing and storage of the blood and urine samplesAll blood specimens collected in the clinic were centrifuged in the clinic’s laboratory within two hours of collection to preserve the quality and integrity of the specimens. The specimens were stored at the appropriate temperature (e.g., 2-8 oC fridge or -18 oC or colder freezer) and the fridge and freezer temperatures were monitored via readings at each staff shift and by an alarm system at all times. All samples were processed and stored within four hours of collection. Urine samples were refrigerated immediately upon collection and were subsequently processed and stored at the appropriate temperature as soon as possible.
10.3.3.13 ShippingAs described above under Laboratory Measures protocol section 6.5 shipment temperature monitoring ensured that only samples whose integrity remained intact were used for analysis of CHMS measures.
In order to ensure that samples were not being contaminated by the mobile clinic laboratory environment and processes, and that any detected environmental measure was reflective of the respondent’s physical status, the CHMS mobile clinic lab sent field blanks to the Institut national de la santé publique du Québec (INSPQ), the lab responsible for testing the environmental measures. The field blanks contained a blank solution that was tested to be free of any environmental contaminants and these samples were used to mimic the same processes carried out with respondent samples for collection and processing of environmental measures on blood and urine. De-ionized water was used as the blank solution for the baseline testing of environmental measures for all testing on urine and for metals being tested in blood. Similarly, vials of bovine serum were used for field blank collection of the organic components tested on blood. For sites 12-15 only water was used for the field blanks and all samples were sent in triplicate. These blanks were tested and compared to an acceptable upper limit that is three times the limit of detection of each analyte. Results above these limits were reviewed by head office staff and deviations were investigated, in consultation with the analytical lab and other experts and, if necessary, corrective action is taken.
10.3.3.15 Activity Monitor Data Review
A data review process was also developed to clean and process the activity monitor data. The review process was broken down into four distinct steps: Step 1 involved the downloading and saving of respondent data, ensuring that no malfunctioning monitors were returned to the field, and following up with respondents who hadn’t returned the monitor. Step 2 involved stacking of all respondent data into a single SAS file, and dropping non-valid/bad data (such as initialization errors, or spurious data); Step 3 involved accepting only those with at least 1 day of viable wear-time (at least 10hrs of data), and calculating the activity intensity per minute; and Step 4 involved applying reserve codes to missing data and generating the derived variables.
10.3.4 Head Office
The CHMS experienced several levels of non-response. First, the selected dwelling may refuse to provide the household composition. Second, the person(s) selected amongst the household members may refuse to answer the questionnaire. Third, the person may refuse to participate in the clinic component. Finally, the person may refuse to provide blood and/or urine for the laboratory tests for current or future analysis.
At each level of non-response characteristics available for respondents and non-respondents are used in a logistic regression model to identify variables which explain most non-response. Based on the results of each regression, homogeneous response groups are created. The non-response adjustments are applied within these groups.
The variables which were correlated most with response or non-response were used in the logistic regression models. Just to name a few are region, if the dwelling is detached or not, the collection site, age group, sex, marital status, household size, education and income.
Concerns were expressed by data users that the clinic respondents’ results were biased because it was believed that less healthy people were less likely to go to the clinic. A study was done to compare estimates of some questionnaire variables before and after the clinic non-response adjustment was carried out. Estimates based on all household questionnaire respondents (weighted) were compared to estimates based on clinic respondents (weighted and adjusted for clinic non-response). Several person level variables were examined, including those used in the regression models and others such as stress level, quality of life, frequency of seeing a dental professional, having a regular medical doctor, smoking, alcohol consumption, taking prescription medications in the last month, job status, body mass index class and indicators of health such as cognition, dexterity, emotional problems, hearing problems, disability levels, mobility trouble, pain and vision. All variables examined above were not significantly different before and after the clinic adjustment. This suggests that clinic respondents, with the clinic non-response adjustment, are similar to household questionnaire respondents.
Another study was done to compare the 20 to 39 year-olds adults living with and without children aged 6 to 11. The ratio of 20 to 39 year-olds living with children is greater in the CHMS sample than it is in the Canadian population. This imbalance is a result of the 2-person selection in households where a child 6 to 11 year-olds is found. When a child 6 to 11 is selected, a second person aged 12 to 79 is selected as well. The second person selected is usually a parent in the 20 to 39 year-olds age range. As a result, a limited number of 20 to 39 year-olds not living with children aged 6 to 11 are selected. Since the post-stratification step did not differentiate between the two types of 20 to 39 year-olds, a potential bias could have been introduced by the selection method. To evaluate this potential bias, the ratio of 20 to 39 year-olds with and without children aged 6 to 11 was calculated using the 15 sites’ dwelling frame (and household composition). A post-stratification was done using this observed ratio. Estimates were produced using these new weights and then compared to the original estimates. The new estimates were not statistically different from the original ones. The number of 20 to 39 year-olds living with children may be over estimated in CHMS but not high enough to introduce a bias in the overall results.11. Guidelines for tabulation, analysis and release
This section of the documentation provides guidelines to be applied by data users in tabulating, analyzing, publishing or otherwise releasing any data derived from the survey files.
11.1 Rounding guidelines
In order that estimates for publication or other releases derived from the data files correspond to those produced by Statistics Canada, users are urged to adhere to the following guidelines regarding the rounding of such estimates:
- Estimates in the main body of a statistical table are to be rounded to the nearest hundred units using the normal rounding technique. In normal rounding, if the first or only digit to be dropped is 0 to 4, the last digit to be retained is not changed. If the first or only digit to be dropped is 5 to 9, the last digit to be retained is raised by one. For example, in normal rounding to the nearest 100, if the last two digits are between 00 and 49, they are changed to 00 and the preceding digit (the hundreds digit) is left unchanged. If the last digits are between 50 and 99 they are changed to 00 and the proceeding digit is incremented by 1;
- Marginal sub-totals and totals in statistical tables are to be derived from their corresponding unrounded components and then are to be rounded themselves to the nearest 100 units using normal rounding;
- Averages, proportions, rates and percentages are to be computed from unrounded components (i.e., numerators and/or denominators) and then are to be rounded themselves to one decimal using normal rounding;
- Sums and differences of aggregates (or ratios) are to be derived from their corresponding unrounded components and then are to be rounded themselves to the nearest 100 units (or the nearest one decimal) using normal rounding;
- In instances where, due to technical or other limitations, a rounding technique other than normal rounding is used resulting in estimates to be published or otherwise released that differ from corresponding estimates published by Statistics Canada, users are urged to note the reason for such differences in the publication or release document(s);
- Under no circumstances are unrounded estimates to be published or otherwise released by users. Unrounded estimates imply greater precision than actually exists.
11.2 Sample weighting guidelines for tabulation
The sample design used for this survey is not self-weighted. In other words, the sampling weight is not the same for all the persons included in the sample. Even to produce simple estimates, including ordinary statistical tables, the user must employ the appropriate sampling weight. Otherwise, the estimates calculated on the basis of the master file cannot be considered representative of the population observed, and they will not correspond to those of Statistics Canada.
Users should also keep in mind that because of the treatment reserved for weights, some software packages do not yield estimates that exactly match those of Statistics Canada.
11.3 Precise variances or coefficients of variation
Calculation of a precise variance or coefficient of variation is not an easy matter, since there is no simple mathematical formula that can take into account all aspects of the CHMS sample design and weights. It is therefore necessary to turn to other methods to estimate these measures of precision, such as re-sampling methods. Among these, the bootstrap method is the one recommended for analysing CHMS data.
However, the calculation of coefficients of variation (or any other measure of precision) performed using the bootstrap method requires access to information that is considered confidential and is present only on the master file.
To calculate coefficients of variation, the bootstrap method is recommended. A macro program, called "Bootvar," has been developed to facilitate calculation using the bootstrap method. The Bootvar program is available in SAS and SPSS formats, and it consists of macros for calculating the variances of totals and ratios differences between ratios, and for linear and logistic regressions.
Since geometric means cannot be calculated within BOOTVAR, other statistical packages such SUDAAN should be used. Because SUDAAN and BOOTVAR use different methods in calculating variance, using SUDAAN to replicate tables produced using BOOTVAR (and vice versa) may yield slightly different variance estimations.
11.4 Recommendations for doing analysis with data from Cycle 1 of CHMS
The Canadian Health Measures Survey (CHMS) was designed to provide national baseline prevalence estimates for a variety of health indicators. Because of cost considerations, 15 collection sites from 5 regional strata were chosen – 1 site from the Atlantic region, 4 sites from the Quebec region, 6 sites from the Ontario region, 2 sites from the Prairies region and 2 sites from the British Columbia region. Then a sample of individuals of all ages was selected from each chosen site. This design should yield approximately unbiased national prevalence estimates that would have cv’s of approximately 16.5% for a prevalence of 10% for each of 5 age groups (6-11, 12-19, 20-39, 40-59, and 60-79) by sex.
While the small number of sampled collection sites can produce baseline prevalence estimates that meet the above criteria, it has the drawback of leaving just 11 “degrees of freedom12” for variance estimation. Limited degrees of freedom have several consequences for analysis and inference13; in particular:
- The variability of variance estimates of estimated quantities needs to be taken into account when doing analyses,
- Estimated covariance matrices of vectors of estimates (such as the vector of estimated coefficients of a model) could be singular or close to singular, thus possibly not invertible14,
- It may not be possible to calculate some test statistics,
- The usual asymptotic distributions of many test statistics may not hold when there is only a small number of primary sampling units (PSUs, in this case the collection sites) in the sample, even when the total sample size is large.
Because of the possible consequences of having a small number of PSUs, a researcher is advised to consider the following recommendations when analyzing CHMS data:
- Produce only national estimates since regional estimates will have even fewer than 11 degrees of freedom because fewer PSUs would be involved in variance estimation. This still allows the researcher to do analyses of many subpopulations such as a single age group or one sex, since all ages and both sexes are in the sample from each collection site.
- Avoid fitting models with a large number of coefficients.
- Use analytical methods that are less impacted by the limited degrees of freedom, or are conservative. In particular, when testing a hypothesis involving a vector of quantities, avoid Wald statistics and their modifications since they have been found to be unstable. Better choices would be Satterthwaite-adjusted statistics or conservative Bonferroni tests.
- Since bootstrap weights are used for variance estimation with the CHMS, it will likely be necessary to specify the degrees of freedom in the software being used because often the default degrees of freedom is likely to be incorrect.
12. File Usage
12.1 Use of weight variable
The CHMS is a sample survey, which means that the respondents "represent" many other Canadians not included in the survey. For example, a 1% sample would mean that each CHMS respondent represented 100 other Canadians. In order that the results of the survey are representative of the population, the CHMS methodologists have created weights. These weights, when applied to the survey results, enable data users to create estimates for the entire population.
Each respondent record on the master file has a unique weight attached to it. In order to produce estimates for a particular characteristic, the data user must sum the weights for each respondent with that characteristic. The total created by that calculation would produce an estimate of that characteristic in the total population.
Because of the small sample size for cycle 1 of the CHMS the results should only be used to produce national estimates. Due to the different number of respondents contained within the various files output for cycle 1, each file produced will contain a different weighting variable. If subsample files are linked to the master file, then the weight stored on the sub-sample file should be used for creating the estimates.
12.2 Environment Canada climate and air quality file
One of the modules included in the CHMS is spirometry, which measures lung function. As lung function can be affected by the atmosphere, it may be necessary for researchers to adjust for the weather and air quality at the time of the clinic visit when analyzing data from the spirometry module. To address these needs, a file has been created which contains hourly climate and air quality data for the dates when clinic collection took place at each of the 15 sites. Data have been obtained from the National Climate Data and Information Archive (www.climate.weatheroffice.gc.ca) and from the National Air Pollution Surveillance Program (http://etc-cte.ec.gc.ca/NAPS/).
The following indicators are on the climate and air quality file:
Air quality: Ozone, nitrogen dioxide, particulate matter (2.5 microns)
Climate: Temperature, barometric pressure, precipitation, relative humidity, humidex, wind speed, wind direction, wind chill
Supporting documentation is available for this file upon request.
12.3 Variable naming convention
The CHMS naming convention follows the same pattern as that used by the Canadian Community Health Survey (CCHS) and, in fact, many Statistics Canada surveys. The variable name is constructed in a way that allows the data users to easily identify the originating section of the survey, the type of variable and the survey question that collected the data. The variable names have also been created in such a way as to identify similar data between different cycles of the CHMS.
Each variable name must adhere to a mandatory requirement, which restricts variable names to a maximum of 8 characters for ease of use by analytical software products. As a result, each character of the variable name contains information about the data contained in the variable.
Generally speaking:
Positions 1 to 3: Section name
Position 4: "_" or Variable type
Position 5 to 8: Question reference
For example: The variable from question 101 of the household Chronic Conditions Section, CCC_101:
Position 1 to 3: CCC chronic conditions section
Position 4: _ underscore ( _ = collected data)
Position 5 to 7: 101 question number
12.3.1 Positions 1 to 3: Module section name
The following values are used for the section name component of the variable name:
Subject |
Variable |
|---|---|
| Activity Monitor Derived Variables – Master File | AMM |
| Activity Monitor Derived Variables – Sub-sample file (4+ days) | AMS |
Alcohol use |
ALC |
Anthropometric – Measured Height and Weight |
HWM |
Anthropometric – Eligibility |
ANC |
Anthropometric – Skin fold Measurements |
SFM |
Birth information |
BIR |
Blood and urine laboratory tests |
LAB |
Blood collection |
BDC |
Blood pressure |
BPM |
Breastfeeding information |
BRI |
Children’s physical activity |
CPA |
Chronic conditions |
CCC |
Clinic - General |
SITE |
Clinic - General |
V2 |
Complete blood count |
CBC |
Consent |
CON |
Demographic and household variables |
DHH |
Dietary fat consumption |
DFC |
Education |
EDU |
Exposure to second-hand smoke |
ETS |
Family medical history |
FMH |
Fasting status |
ATG |
General health |
GEN |
Grains, fruits and vegetables consumption |
GFV |
Grip strength |
GSM |
Grip strength – Eligibility |
GSC |
Grooming product use |
GPU |
Health utility index |
HUI |
Height and weight - Reported |
HWT |
Hepatitis |
HEP |
Hobbies |
HOB |
Housing characteristics |
HSC |
Human papillomavirus vaccine |
HPV |
Illicit drug use |
IDU |
Income |
INC |
Labour force activity |
LBF |
Maternal breastfeeding |
MBF |
Meat and fish consumption |
MFC |
Medication use |
AHF |
Medication use |
ATC |
Medication use |
MED |
Milk and dairy product consumption |
MDC |
modified Canadian Aerobic Fitness Test (mCAFT) |
AFT |
modified Canadian Aerobic Fitness Test (mCAFT) – Eligibility |
AFC |
Oral Health |
OHE |
Oral Health |
OHQ |
Oral Health |
OHR |
Oral Health |
OHM |
Oral Health – Eligibility |
OHC |
Partial curl-ups |
PCM |
Partial curl-up – Eligibility |
PCC |
Person providing information |
PPI |
Phlebotomy |
BDC |
Phlebotomy – Eligibility |
PHB |
Phlegm |
PLM |
Physical activity |
PAC |
Polybrominated biphenyls (PBBs) |
PBB |
Polybrominated diphenyl ethers (PBDEs) |
PBD |
Polychlorinated biphenyls (PCBs) |
PCB |
Pregnancy information |
PRG |
Pregnancy status |
PRS |
Report of measurements |
RMC |
Respondent verification |
CLC |
Salt consumption |
SLT |
Screening |
ATG |
Screening |
MHR |
Screening |
ORS |
Screening |
PAR |
Screening |
PHC |
Screening |
SPQ |
Sedentary activities |
SAC |
Sexual behaviour |
SXB |
Sit and reach |
SRM |
Sit and reach – Eligibility |
SRC |
Sleep |
SLP |
Smoking |
SMK |
Socio-demographic characteristics |
SDC |
Spirometry |
SPM |
Spirometry – Eligibility |
SPC |
Strengths and difficulties |
SDQ |
Sun exposure |
SEB |
Urine collection |
URC |
Water and soft drink consumption |
WSD |
Weight change |
WTC |
12.3.2 Position 4: Place Holder or Variable Type
_ Collected variable: A variable that appeared directly on the questionnaire
C Coded variable: A variable coded from one or more collected variables (e.g., SIC, NAICS, ATC, Tar)
D Derived variable: A variable calculated from one or more collected or coded variables
G Grouped variable: Collected, coded, or derived variables collapsed into groups (e.g., age groups)
12.3.3 Positions 6 to 8: Question reference
In general, the last three positions follow the variable numbering used on the questionnaire. The letter "Q" used to represent the word "question" is removed, and all question numbers are presented in a two- digit format. For example, question Q01A in the questionnaire becomes simply 01A, and question Q15 becomes simply 15.
For questions which have more than one response option, the final position in the variable naming sequence is represented by a letter. For this type of question, new variables were created to differentiate between a "yes" or "no" answer for each response option. For example, if Q2 had multiple response options, the new questions would be named Q2A for option 1, Q2B for option 2, Q2C for option 3, etc. If only options 2 and 3 were selected, then Q2A = No, Q2B = Yes, Q2C = Yes and Q2D = No.
12.4 Access to Master file data
Access to the data is provided through the Research Data Centres (RDC). These centres require researchers to submit to Statistics Canada, a research project that will use respondent data from the released files. These projects are accepted based on a set of specific rules. When the project is accepted, the researcher is designated as a "deemed employee" of Statistics Canada for the duration of the research, and given access to the data from designated Statistics Canada sites. For more information, please consult the Statistics Canada webpage:
www.statcan.gc.ca/rdc-cdr/index-eng.htm.
Another means of access to the master file data is to provide to Statistics Canada specifications for tabulations. These tables are programmed and run against the data files by employees of Statistics Canada. This service allows users who do not possess knowledge of tabulation software products or who do not have access to the RDCs, to get custom results. The results are screened for confidentiality and reliability concerns before release.
12.5 Variable Concordance
Variable names found on the master file are different from those that were used to collect the data. The attached household and clinic questionnaires (see appendix 6) show the collection names. In order to ensure that data users are able to quickly and easily work with either the file or the questionnaires, a concordance table showing the master file variable names with the appropriate collection variable names is attached (see appendix 8).
12.6 Special notes
-
Please note that MEDF1 (a flag on the Canadian Community Health Survey (CCHS) indicating whether a person has taken medication in the past month) is not on the Canadian Health Measures Survey (CHMS) file. Users can find out how many medications a CHMS respondent took by using the variables MED_100B, MED_200B and MED_300B. These variables indicate the number of prescription medications, non-prescription medications, and herbal products and remedies, respectively, which were taken in the past month.
Age and sex are collected twice during the survey process for the CHMS, first through the household interview, then again during the clinic component. Because the two appointments could be several days apart, it is possible that a respondent's age could be different on the household and clinic files. Each application uses the age and sex information that was collected as the reference for coverage and skip patterns for sections within that application. For that reason, it is important to use the appropriate age and sex variables for the data being analyzed. Incorrect usage of age and sex variables could lead to errors in analyses, due to respondents whose ages changed between the two appointments. For example, a respondent who is 11 at the time of the household interview and 12 at the time of the mobile examination centre (MEC) visit will be in different age groups depending on the data being analyzed (i.e. 6 to 11 for household analysis and 12 to 19 for clinic analysis)
For household variables, DHH_AGE and DHH_SEX should be used; for clinic variables, CLC_AGE and CLC_SEX should be used. If variables from both components are analyzed, use the age and sex variable for the module containing the most important variable of interest.-
To help give some context to the raw data that was collected at the MEC, normative scales used by analysts for specific types of data have been added to the master file. The norms used for Cycle 1 data collection were agreed upon at the start of collection, and respondents were informed of how they measured against those norms in the final report delivered to them. The norms used throughout Cycle 1 collection do not reflect changes that may have been made between the start of collection in 2007 and the present day. As the raw data is also included on the file, users are free to use norms other than those included on the file.
It should be noted that the following laboratory tests had limitations with regards to stability.
Homocysteine:
This measure is time and temperature sensitive. MEC protocol required that samples be processed within four hours of collection. Under normal circumstances however, the time from blood draw to aliquotting and storage for this measure was under 1 ½ hours.
Bilirubin:
Two thirds of the way through the survey, steps were taken to preserve the integrity of the sample collected for bilirubin analysis. Changes were made to protect the sample from light during collection, processing and storage. A shift in results could be observed.
Bicarbonate:
Bicarbonate is time sensitive as levels can decrease over time due to loss of CO2. Ideally, this analyte should be measured within 3 days of collection. Bicarbonate was part of the chemistry panel which was refrigerated and shipped once a week to the reference lab. As some of these samples could consequently be up to eight days old, this time sensitive measure may have been affected.-
During the household interview, respondents were asked to name all prescription, over the counter and herbal remedies they were taking, to a maximum of 15 per category. At the clinic interview, the respondent was then asked if they were still taking the medication(s) they listed during the household interview, as well as the names of any new ones they started taking since the household interview. A maximum of five additional medications could to be added into each category (prescription, over the counter and herbal). In the case where a respondent indicated more than 5 new medications for a given category, only the first five of those medications were chosen and coded.
Anatomical Therapeutic Chemical (ATC) classification system:
The Anatomical Therapeutic Chemical (ATC) classification system was developed by the World Health Organization (WHO). It classifies pharmaceutical products according to the organ or system on which they act and their chemical, pharmacological and therapeutic properties. An ATC code was assigned to each medication using the Drug Identification Number (DIN) and Health Canada's ATC coding system. When a medication had more than one indication, the ATC code was decided based on the main indication of the medication. The main indication was determined by Health Canada reviewers using the Product Monograph (a factual document on a drug product that describes the properties, claims, indications, and conditions of use of the drug product). In cases where it was still not clear from the Product Monograph which ATC code to assign Health Canada contacted the ATC group at the WHO Collaborating Centre for Drug Statistics Methodology in Norway for clarification. A medication was not assigned an ATC code if the DIN was missing or if the DIN did not exist in the Health Canada drug database (for example experimental drugs). In these cases the ATC code appears as "not stated" on the file. The classification system is only available in English. For more information on Anatomical Therapeutical Chemical System please refer to: www.whocc.no/atc_ddd_index/.-
American Hospital Formulary Service (AHFS) classification system:
The American Hospital Formulary Service (AHFS) classification system is published by the American Society of Health-System Pharmacists to describe the mode of action of pharmaceutical products, including vitamin and mineral supplements. The classification system is only available in English. For more information on the American Hospital Formulary Service (AHFS) classification system please refer to: www.ahfsdruginformation.com/. - Tar Value:
The tar value was provided by Health Canada and was determined as follows: - "Five conditioned cigarettes are smoked per port, using an automated 20-port constant volume smoking machine equipped with a CO analyzer, onto a conditioned, pre-weighed glass fiber filter disc (pad). The gas phase is collected in a Vapour Phase (VP) collection bag and then introduced into a Non-Dispersive Infra-Red analyzer (NDIR) and the % CO determined. The pad is then re-weighed and the difference is the Total Particulate Matter (TPM). The pad is extracted with Isopropanol (IPA) containing the internal standards, and the extract analyzed for nicotine and water by gas chromatography. The tar value is determined by subtracting the water and nicotine from the TPM".15
- Note to data users – phthalate metabolites:
Canadian Health Measures Survey (CHMS) data on phthalate metabolites have been adjusted to correct a bias introduced by the inaccuracy of the standards used to calibrate the analytical instruments and to allow the comparison of data from one CHMS cycle to the next. The adjustment factors were established based on the difference in accuracy between the standards used in the analysis of the samples and those considered to be accurate. The application of these adjustment factors is currently undergoing peer review.
13. References and end notes
- Stratum defined according composition of the household in the 2006 Census.
- For the 6 to 11, 12 to 19 and Others strata, the multiplicative factor for the 12 to 19 age group was increased from 3 to 5 during collection to reach the target number of respondents for this age group.
- Canadian Society for Exercise Physiology. 2003. Canadian Physical Activity, Fitness and Lifestyle Approach (CPAFLA). 3rd edition. Ottawa.
- Ross, W. D. & M.J. Marfell-Jones. 1991."Kinanthropometry" in Physiological Testing of the High-Performance Athlete. 2nd edition. J. D. MacDougall, H. A. Wenger, & H. J. Green, eds., Human Kinetics Books, Champaign, Illinois, pp. 223-308.
- Fitness Canada. 1986. Canadian Standard Test of Fitness (CSTF) Operations Manual. 3rd edition. Ottawa.
- Campbell, Norm R.C., Joffre Michel R., McKayDonald W. 2005. "Hypertension Surveillance in Canada: Minimum Standards for Assessing Blood Pressure in Surveys." Canadian Journal of Public Health Vol 96, number 3. p. 217 - 220.
- Miller M.R., J. Hankinson, V. Brusasco et al. 2005. "Standardization of spirometry." Eur Respir. Vol. 26 p. 319-338.
- The five regions are: British Columbia, the Prairies (Alberta, Manitoba and Saskatchewan), Ontario, Quebec and the Atlantic provinces (Newfoundland and Labrador, Prince Edward Island, Nova Scotia and New Brunswick).
- The number of sites selected for each SRB is given in Table 5.1 in section 5.3.1 (Sampling of collection sites).
- Among the dwellings initially selected, some are not within the scope of the survey. These include, for example, vacant or demolished dwellings, non-residential dwellings or dwellings in which all household members are under 6 or over 79 years of age or are full-time members of the Canadian Forces. These dwellings are identified during collection; otherwise they would have been excluded during the selection process. They are not included when calculating response rates.
- American Thoracic Society. 1995. "Standardization of Spirometry 1994 Update." Am J Respir Crit Care Med. Vol. 152, p. 1107-1136.
- Degrees of freedom” is being used as a generic term to reflect the amount of information used to estimate variances and covariances. An approximation often used for the value of “degrees of freedom” is (# of PSUs - # of strata). For the CHMS, the collection sites (15) are the PSUs. For the purpose of variance estimation, the one Atlantic region psu is collapsed in with the 4 Quebec region PSUs, thus leaving 4 strata and “degrees of freedom” equal to (15 – 4) = 11.
- In particular confidence intervals and tests of hypotheses.
- Invertible covariance matrices are needed to perform Wald tests for tests on vectors of parameters.
- Health Canada. 1999. Determination of “Tar”, Nicotine and Carbon Monoxide in Mainstream Tobacco Smoke. Ottawa
Appendix 1 Pre-testing Guidelines
Pre-testing Guidelines for morning appointments
Guidelines to follow
- Please do not:
- Eat or drink anything other than water during the 12 hours prior to your clinic appointment—for example, you can’t eat candies, cough lozenges, chewing gum or drink flavoured water during the fasting period
- Smoke or use other tobacco and nicotine products during the 2 hours prior to your clinic appointment
- Drink any alcoholic beverages during the 12 hours prior to your clinic appointment
- Exercise on the day of your clinic appointment (from midnight)
- Donate blood 2 days prior to your clinic appointment
- Wear scented products the day of your clinic appointment
- Bring loose fitting clothing (e.g., shorts, sweat pants, short sleeved top), footwear appropriate for exercise (e.g., walking or running shoes) and your health insurance card to your clinic appointment.
- Medication use:
- Take your medications as usual on the day of your clinic appointment.
- Please bring with you all medications (prescription or over the counter), herbal remedies or supplements that you began taking since, or did not disclose during, the household interview.
- If you have a breathing condition (e.g., asthma), please bring your inhaler or medication to your clinic appointment.
Pre-testing Guideline for afternoon/ evening appointments
Guidelines to follow
- Please do not:
- Eat or drink anything other than water during the 2 hours prior to your clinic appointment—for example, you can’t eat candies, cough lozenges, chewing gum or drink flavoured water during the fasting period
- Smoke or use other tobacco and nicotine products during the 2 hours prior to your clinic appointment
- Drink any alcoholic beverages on the day of your clinic appointment (from midnight)
- Exercise on the day of your clinic appointment (from midnight)
- Donate blood 2 days prior to your clinic appointment
- Wear scented products the day of your clinic appointment
- Bring loose fitting clothing (e.g., shorts, sweat pants, short sleeved top), footwear appropriate for exercise (e.g., walking or running shoes) and your health insurance card to your clinic appointment.
- Medication use:
- Take your medications as usual on the day of your clinic appointment.
- Please bring with you all medications (prescription or over the counter), herbal remedies or supplements that you began taking since, or did not disclose during, the household interview.
- If you have a breathing condition (e.g., asthma), please bring your inhaler or medication to your clinic appointment.
Appendix 2
| Measure | Exclusion Criteria |
|
|---|---|---|
| Hard Coded | Staff Decision | |
| Blood Pressure | None | Test Screen Out
|
| Standing Height | None |
|
| Sitting Height | None |
|
| Weight | None |
|
| Waist Circumference |
|
|
| Hip Circumference |
|
|
| Skinfolds |
|
Site-specific exclusions :
|
| Phlebotomy |
|
|
| Urine | None |
|
| Activity Monitor | None |
|
| Spirometry |
|
|
| Grip Strength |
|
|
| mCAFT |
|
|
| Sit and Reach |
|
|
| Partial Curl-Ups |
|
|
| Oral Health (exclusion from probing component only) |
|
|
Appendix 3 PAR-Q
PAR-Q & You (A questionnaire for people aged 15 to 69)
Regular physical activity is fun and healthy, and increasingly more people are starting to become more active very day. Being more active is very safe for most people. However, some people should check with their doctor before they start becoming much more physically active.If you are planning to become much more physically active than you are now, start by answering the seven questions in the box below. If you are between the ages of 15 and 69, the PAR-Q will tell you if you should check with your doctor before you start. If you are over 69 years of age, and you are not used to being very active, check with your doctor.
Common sense is your best guide when you answer these questions. Please read the questions carefully and answer each one honestly: check Yes or No.
1. Has your doctor ever said that you have a heart condition and that you should only do physical activity recommended by a doctor?
- Yes
- No
2. Do you feel pain in your chest when you do physical activity?
- Yes
- No
3. In the past month, have you had chest pain when you were not doing physical activity?
- Yes
- No
4. Do you lose your balance because of dizziness or do you ever lose consciousness?
- Yes
- No
5. Do you have a bone or joint problem (for example, back, knee or hip) that could be made worse by a change in your physical activity?
- Yes
- No
6. Is your doctor currently prescribing drugs (for example, water pills) for your blood pressure or heart condition?
- Yes
- No
7. Do you know any other reason you should not do physical activity?
- Yes
- No
If you answered Yes to one or more questions
Talk with your doctor by phone or in person before you start becoming physically active or before you have a fitness appraisal. Tell your doctor about the PAR-Q and which questions you answered Yes.
- You may be able to do any activity you want – as long as you start slowly and build up gradually. Or, you may need to restrict your activities to those which are safe for you. Talk with your doctor about the kinds of activities you wish to participate in and follow his/her advice.
Find out which community programs are safe and helpful for you.
No to all questions
If you answered No honestly to all PAR-Q questions, you can be reasonably sure that you can:
- start becoming much more physically active – begin slowly and build up gradually. This is the safest and easiest way to go.
- take part in a fitness appraisal – this is an excellent way to determine your basic fitness so that you can plan the best way for you to live actively. It is also highly recommended that you have your blood pressure evaluated. If your reading is over 144/94, talk with your doctor before you can start becoming much more physically active.
Delay becoming more active:
- if you are not feeling well because of a temporary illness such as a cold or a fever – wait until you feel better; or
- if you are or may be pregnant – talk to your doctor before you start becoming more active.
Please note:
If your health changes so that you answer Yes to any of the above questions, tell your fitness or health professional. Ask whether you should change your physical activity plan.
Informed use of the PAR-Q:
The Canadian Society for Exercise Physiology, Health Canada, and their agents assume no liability for persons who undertake physical activity, and if in doubt after completing this questionnaire, consult your doctor prior to physical activity.
No changes permitted. You are encourages to photocopy the PAR-Q but only if you use the entire form.
Note:
If the PAR-Q is being given to a person before he or she participates in a physical activity program or a fitness appraisal, this section may be used for legal or administrative purposes. "I have read, understood and completed this questionnaire. Any questions I had were answered to my full satisfaction."
- Name
- Signature
- Date
- Signature of parent
- Witness
- or Guardian (for participants under the age of majority)
Note:
This physical activity clearance is valid for a maximum of 12 months from the date it is completed and becomes invalid if your condition changes so that you would answer Yes to any of the seven questions.
For more information on how the PAR_Q was used by Canadian Health Measures Survey, please contact:
Tel. 1-888-253-1087
Email: chms-ecms@statcan.gc.ca
For other information on the PAR_Q, please contact the:
Canadian Society for Exercise Physiology
202-185 Somerset Street West
Ottawa, ON K2P 0J2
Tel. 1-877-651-3755
Fax (613) 234-3565
Online: www.csep.ca
Appendix 4 Canadian Health Measure Survey cycle 1 protocols
1. Anthropometric component
1.1 Standing height
Standing height is an assessment of maximum vertical size. This measure was taken on all respondents ages 6 years and older who were able to stand unassisted. Standing height was measured with a fixed stadiometer with a vertical backboard and a moveable headboard using a procedure based on the Canadian Physical Activity, Fitness and Lifestyle Approach (CPAFLA)1.
1.1.1 Equipment
- ProScale M150 Digital Stadiometer.
1.1.2 Eligibility
- All respondents aged 6-79 who are able to stand unassisted.
- Respondents who were unable to stand unassisted.
- Respondents who suffered from an acute condition that prevented him/her from completing the measure (e.g., cast on leg preventing the respondent from standing up straight).
1.1.3 Exclusion criteria
-
Respondents who were unable to stand unassisted.
-
Respondents who suffered from an acute condition that prevented him/her from completing the measure (e.g., cast on leg preventing the respondent from standing up straight).
1.1.4 Administering height
-
The health measurement specialist (HMS) had the respondent remove his/her footwear and move or remove hair ornaments, jewellery, buns and braids from the top of his/her head.
-
The respondent was instructed to stand erect, arms hanging at the sides with his/her feet together. The respondent was instructed to keep his/her heels, buttocks, back and head in contact with the vertical backboard of the stadiometer. Depending on the overall body shape of the individual, there were times when not all of the points touched. In such cases, it was ensured that the respondent’s trunk was vertical above the waist, and that the arms and shoulders were relaxed. The HMS made sure the body weight was evenly distributed, and that both feet were flat on the floor.
-
The HMS instructed the respondent to look straight ahead. The respondent’s head was aligned in the Frankfort Plane. The head is considered to be in the Frankfort plane when the horizontal line from the ear canal to the lower border of the orbit of the eye is parallel to the floor and perpendicular to the vertical backboard. If required, the HMS gently tilted the head up or down until proper alignment was achieved with eyes looking straight ahead.
-
The respondent was instructed to stand as tall as possible, take a deep breath and hold it while the measurement was taken. A deep breath allowed the spine to straighten, yielding a more consistent and reproducible stature measurement.
-
The head board was positioned firmly on top of the head with sufficient pressure to compress the hair.
-
The standing height was recorded to the nearest 0.01cm while the breath was being held.
Note: If a respondent could not keep his/her head in contact with the stadiometer while the head was in the Frankfort plane position, the Frankfort plane position took precedence over ensuring the rear of the head was in contact with the stadiometer.
1.2 Sitting height
Sitting height is an assessment of maximum vertical size when the respondent is sitting. It was measured on all respondents ages 6 years and older who were able to sit unassisted. Sitting height was measured with a fixed stadiometer with a vertical backboard and a moveable headboard. Along with standing height, it helps in the assessment of body proportions (e.g., length of the legs relative to the body trunk). Combining stature with sitting height (using a predictive equation) provides an index of maturity status for younger populations. The sitting height was measured following the International Society for the Advancement of Kinanthropometry (ISAK) protocol.2
1.2.1 Equipment
- ProScale M150 Digital Stadiometer.
- Standardized bench or block.
1.2.2 Eligibility
- Respondents aged 6 to 79.
1.2.3 Exclusion criteria
- Respondents who were unable to sit unassisted.
- Respondents who suffered from an acute condition preventing them from completing the measure (e.g. full leg cast).
1.2.4 Administering sitting height
-
The HMS had the respondent move or remove hair ornaments, jewellery, buns and braids from the top of his/her head.
-
The respondent was instructed to sit on the measuring box with hands resting on his/her thighs and to keep his/her back, shoulders and head in contact with the vertical backboard of the stadiometer. Depending on the overall body shape of the individual, there were times when not all of the points touched. In such cases, it was ensured that respondent’s trunk was vertical above the waist, and that the arms and shoulders were relaxed.
-
The HMS instructed the respondent to look straight ahead. The respondent’s head was aligned in the Frankfort Plane. The head is considered to be in the Frankfort plane when the horizontal line from the ear canal to the lower border of the orbit of the eye is parallel to the floor and perpendicular to the vertical backboard. If required, the HMS gently tilted the head up or down until proper alignment was achieved with eyes looking straight ahead.
-
The respondent was instructed to sit as tall as possible, take a deep breath and hold it while the measurement was taken. The HMS ensured that the respondent did not contract the gluteal muscles nor push with the legs.
-
The head board was positioned firmly on top of the head with sufficient pressure to compress the hair.
-
The standing height was recorded to the nearest 0.01cm while the breath was being held.
Note: If a respondent could not keep his/her head in contact with the stadiometer while the head was in the Frankfort plane position, the Frankfort plane position took precedence over ensuring the rear of the head was in contact with the stadiometer.
1.3 Weight
The weight was measured in kilograms (kg) using a digital scale and was used to calculate body mass index. The procedure was based on the Canadian Physical Activity, Fitness and Lifestyle Approach (CPAFLA).1
1.3.1 Equipment
- Mettler Toledo VLC with Panther Plus terminal scale.
1.3.2 Eligibility
- All respondents aged 6 to 79.
1.3.3 Exclusion criteria
-
Respondent who suffered from an acute condition that prevented him/her from completing the measure (see special considerations section below).
-
Respondent who were wearing a plaster cast.
1.3.4 Administering weight
-
The HMS had the respondent remove his/her footwear, any heavy accessories and empty his/her pockets.
-
The respondent was asked to step on the center of the scale facing the HMS, with his/her hands at the side and looking straight ahead.
-
The weight was recorded to the nearest 0.1kg.
1.3.5 Special considerations
Body weight could be measured with the standard procedure if the individual could support themselves on the scale without assistance. Measurements of body weight did not include the weight of assistive devices (e.g., artificial limbs, leg braces, crutches, etc.), although these were sometimes required in order for the individual to be weighed. In these cases, the assistive device was first placed on the scale and the scale tarred. The individual could then stand on the scale using the assistive device and the weight of the individual was then displayed.
Individuals who were unable to balance independently on the scale could be weighed sitting in a chair. The chair was placed on the scale, the scale was then tarred and the respondent sat in the chair. The weight of the individual was then displayed.
1.4 Waist circumference
The pattern of fat distribution is an important indicator of the health risks of obesity. Central fat (fat on the trunk) distribution, especially abdominal fat, is associated with increased risk of hypertension, type 2 diabetes, hyper-lipidemia, coronary artery disease and premature death. Waist circumference provides an indicator of abdominal fat distribution. The procedure was based on the third edition of the Canadian Physical Activity, Fitness and Lifestyle Approach (CPAFLA)1.
1.4.1 Equipment
- Gulick tape measure (150cm or 200cm)
1.4.2 Eligibility
- All respondents aged 6 to 79
1.4.3 Exclusion criteria
- Pregnant women
- Respondent in a wheelchair (if cannot correctly landmark)
- Respondent unable to stand unassisted
- Colostomy bag
1.4.4 Administering waist circumference
-
The HMS had the respondent stand erect, in a relaxed manner, with feet shoulder width apart and arms slightly forward (at a 45° angle) with palms facing in. The measure was to be taken directly on the skin.
-
Both sides of the respondent were landmarked with a washable marker. The location of the first landmark was at the bottom of the rib cage (last floating rib) and the second landmark was at the top of the iliac crest. Both marks were in the mid-axillary line. If needed, the HMS asked the respondent for assistance in locating the landmarks or to confirm the location. The mid-point between these two landmarks was measured and landmarked using the measuring tape.
-
Standing on the respondent's right side, the HMS placed the measuring tape around the trunk in a horizontal plane at the level marked on the respondent's trunk. A mirror was used to ensure proper level and positioning of tape. If there was a visible difference between the two reference marks, the mark on the right side was used as the guide. The HMS applied sufficient tension to the tape to maintain its position without causing indentation of the skin surface.
-
Once the measuring tape was in place, The HMS instructed the respondent to place both arms along the side of the body in a relaxed manner.
-
The respondent was instructed to breathe normally.
-
The HMS kept his/her eyes at the same level as the measuring tape. The measurement was taken at the end of a normal expiration. The cross-over technique was used, and the measure was read from the bottom of the tape.
-
The HMS recorded the measurement to the nearest 0.1cm.
1.5 Hip circumference
Hip circumference is the maximal circumference measured at the hips or buttocks region (whichever is larger). It is used to calculate the waist-to-hip ratio (WHR) (waist circumference divided by hip circumference). WHR is a simple method of determining body fat pattern. Although standards for risk vary by age and gender, health risk increases with higher WHR. The protocol for hip circumference was based on the Canadian Standardized Test of Fitness Third Edition3.
1.5.1 Equipment:
- Gulick tape measure (150cm or 200cm)
1.5.2 Eligibility:
- All respondents aged 6 to 79
1.5.3 Exclusion criteria:
- Pregnant women
- Respondent in a wheelchair
- Respondent who was unable to stand unassisted
1.5.4 Administering hip circumference
-
The respondent was asked to wear light clothing. The respondent was instructed to stand erect in a relaxed manner, with feet together and arms slightly forward (at a 45° angle) with palms facing in. If the respondent was not wearing light clothing (e.g., light weight shorts, exercise leggings or lightweight track pants), scrubs were given to ensure minimal clothing interference during the measurement.
-
The respondent was asked to stand with his/her weight evenly distributed to both feet. The respondent was asked to breathe normally.
-
The measurement was taken over the clothing. Standing on the respondent's right side, the HMS placed the measuring tape around the hips, at the level of the symphysis pubis and the greatest gluteal protuberance. The HMS used a mirror to ensure proper level and positioning of tape. The measuring tape was held snug but not tight.
-
Once the tape was in place, the HMS instructed the respondent to relax both arms along the body. The measurement was taken on the respondent's right side. The cross-over technique was used, and the measure was read from the bottom of the tape.
-
The HMS recorded the measurement to the nearest 0.1cm.
1.6 Skinfold measurement
Skinfold measurements are used to estimate general fatness and the distribution of subcutaneous adipose tissue. The principle behind this technique is that the amount of subcutaneous fat (fat that lies directly beneath the skin) is proportional to the total amount of body fat. Both too much fat and too little fat is associated with increased health risk. The skinfold procedure was based on the Canadian Physical Activity, Fitness and Lifestyle Approach (CPAFLA)1.
1.6.1 Equipment
- Harpenden skinfold caliper
- Fine tip washable marker
- Gulick tape measure (150cm)
1.6.2 Eligibility
- All respondents aged 6 to 79
1.6.3 Exclusion criteria
- Pregnant women
- Respondents with BMI ≥ 30 kg/m2
- Respondents who had an acute condition that prevents him/her from completing the measure (e.g., varicose veins, skin condition). This resulted in site-specific exclusion only.
- Respondents who had a chronic condition that prevented him/her from completing the measure (e.g., respondent in a wheelchair which impedes proper landmarking, or missing a limb on the right side of the body). This resulted in site-specific exclusion only.
1.6.4 Administering the skinfolds measurement
-
Prior to measuring the skinfolds, the HMS marked each site carefully. The HMS marked both the skinfold site and then the 1cm point from the skinfold landmark to identify where to place the upper edge of the caliper jaws. The marks indicated where the center of the fold would be. All marks and measurements were taken on the right side of the body.
-
The HMS completed the first set of skinfold measurements at all sites then repeated the procedure to obtain a second measurement at all sites.
-
It was important that the respondent relaxed the underlying musculature as much as possible during the skinfold measurement.
-
The HMS completely spread the index finger and the thumb to firmly grasp the fold of skin and underlying subcutaneous adipose tissue between his/her thumb and index finger. The amount grasped depended upon the thickness of the subcutaneous adipose tissue. The HMS grasped enough skin and adipose tissue to form a distinct fold that separated it from the underlying muscle. The HMS ensured that the landmark mark was at the center of the skinfold. The sides of the fold were to be roughly parallel. The skinfold was grasped at the point of the site measurement and gently held with the thumb and forefinger.
-
The HMS placed the jaws of the caliper at a right angle to the body surface, with the upper edge of the caliper jaws on the 1cm landmark below the point where the skinfold was raised. While maintaining the pressure on the skinfold with his/her fingers, the HMS fully released the trigger of the caliper.
-
The HMS measured the skinfold thickness to the nearest 0.2mm (nearest even decimal place) while continuing to hold the skinfold in his/her fingers. The HMS read the actual measurement from the caliper once the indicator had stabilized (about 2 seconds after the full pressure of the caliper had been applied to the skin).
-
The HMS read the skinfold measurement before releasing the fold. The HMS then removed the calipers, released the fold of skin and subcutaneous fat, and recorded the measurement.
Note: If the difference between the first and second measure of a particular skinfold site was found to be greater than 0.4mm, the HMS was prompted by the computer system to take a third measurement of that skinfold site. The computer would then choose, among the three values, the two measurements which most closely matched each other in value and determined the mean of those two measurements. The computer would determine the mean of the three measurements if the measures were of equal distance (e.g. 18.6, 19.4, 19.0mm).
1.6.5 Triceps skinfold method
-
The HMS had the respondent stand with his/her arms relaxed by his/her sides with palms facing the body.
-
To landmark, the HMS brought the forearm to 90º with the palm facing up.
-
The HMS palpated the acromion process and the tip of the olecranon process and determined the mid-point between these two locations on the medial aspect of the arm using a tape measure. The mid-point was marked using a washable marker. The mid-point was used as a reference to make a landmark on the midline of the back of the arm. The HMS then placed a second mark on the back of the arm, 1cm below the first mark, to indicate the placement of the upper edge of the caliper jaws.
-
The HMS had the respondent extend his/her arm down with the palm facing the upper leg.
-
The skinfold was raised at the midpoint so that the fold ran vertically along the midline of the back of the arm.
-
The upper edge of the caliper jaw was placed at the 1cm landmark, below the point where the skinfold was raised.
-
Once the indicator had stabilized, the HMS read the skinfold thickness to the nearest 0.2mm (nearest even decimal place) while continuing to hold the skinfold.
1.6.6 Biceps skinfold method
-
The HMS had the respondent extend his/her arm at the side with the palm facing forward (supinated).
-
The HMS marked the upper arm over the biceps at the same level as the mid-point for the triceps.
-
A second mark was placed 1cm below to indicate the placement of the upper edge of the caliper jaws.
-
The skinfold was raised at the mid-arm point, so the fold ran vertically along the midline of the front of the arm. The upper edge of the caliper jaws was placed at the 1cm landmark, below the point where the skinfold was raised.
-
Once the indicator had stabilized, the HMS read the skinfold thickness to the nearest 0.2mm (nearest even decimal place) while continuing to hold the skinfold.
1.6.7 Subscapular skinfold method
-
The HMS had the respondent stand with his/her back facing them, with shoulders relaxed and arms by the sides.
-
To landmark, the HMS palpated the inferior angle of the scapula. The HMS placed a mark 1cm below the inferior angle. The HMS placed a second mark 1cm below the skinfold landmark in the direction of the skinfold at an angle of 45° to the spine.
-
The skinfold ran downward and outward at an angle of 45° to the spine. The skinfold was to form a line extending diagonally toward the right elbow.
-
The HMS placed the upper edge of the caliper jaw at the 1cm landmark, below the point where the skinfold was raised.
-
Once the indicator had stabilized, the HMS read the skinfold thickness to the nearest 0.2 mm (nearest even decimal place) while continuing to hold the skinfold.
1.6.8 Iliac crest skinfold method
-
The HMS had the respondent stand in a normal erect position with the right arm raised to his/her side (so it was horizontal) with the right hand on the right shoulder. If the respondent was unable to place the right hand on the shoulder, they were to keep the horizontal arm extended.
-
To landmark, the HMS palpated the crest of the ilium and made a small mark 3cm above the crest at the midline (mid-axillary line) of the body. A second mark was placed 1cm anteriorly from the skinfold landmark in the direction of the skinfold.
-
The HMS raised the skinfold at the 3cm mark so that the fold ran forward and slightly downward.
-
The upper edge of the caliper jaws were placed on the 1cm anterior landmark, in the direction of the fold.
-
Once the indicator had stabilized, the HMS read the skinfold thickness to the nearest 0.2mm (nearest even decimal place) while continuing to hold the skinfold fingers.
1.6.9 Medial calf skinfold method
-
The HMS had the respondent place his/her unweighted (relaxed) right foot flat on a step so that the knee was at a 90° angle.
-
To landmark, the HMS used the tape measure to find the maximum calf girth. The HMS placed a mark on the medial aspect of the calf at the maximum girth point. A second mark was placed 1cm below the skinfold landmark.
-
The HMS raised the skinfold on the medial aspect of the right calf just at the level of the maximum calf girth so that the fold ran vertically along the midline.
-
The HMS placed the upper edge of the caliper jaws on the 1cm landmark, below the point where the skinfold was raised.
-
Once the indicator had stabilized, the HMS read the skinfold thickness to the nearest 0.2 mm (nearest even decimal place) while continuing to hold the skinfold.
1.6.10 Special considerations
Although skinfold measurements could virtually always be completed (except when a body part was missing), they may or may not have been appropriate. Skinfold measurements were only made on body parts whose composition was unaffected by disability since some disabilities can increase the difficulty in obtaining reliable skinfold measurements. For example, paralysis makes it difficult to obtain a correct skinfold because of the lack of tone in the underlying muscle. Rolling the skinfold between thumb and forefinger may help to isolate the fat from the muscle layers.
2. Blood pressure component
The respondent's resting heart rate and blood pressure (BP) were measured, following a new protocol created by the CHMS and inspired by the report entitled "Hypertension Surveillance in Canada: Minimum Standards For Assessing Blood Pressure In Surveys" report8. This report was published by an expert committee consisting of members of the Canadian Hypertension Society, the Canadian Coalition for High Blood Pressure Prevention and Control and the Heart and Stroke Foundation of Canada
For the purpose of standardization, all measurements were taken on the right arm, unless specific conditions prohibited the use of the right arm (e.g., right mastectomy), using the automated blood pressure cuff (BpTRU™). The BpTRU™ is designed to measure blood pressure and heart rate using an upper arm cuff. The device automatically inflates and deflates the cuff, and uses the oscillometric technique to calculate systolic and diastolic blood pressure. In the event that the automated cuff was not functioning properly, the HMS performed the measure manually by the auscultation method.
2.1 Equipment
Electronically
- Automated BP monitor: BpTRU™ BP-300 (with automatic input)
- Variety of automated BP cuff sizes (child – extra large adult)
- Foot stool for shorter respondents
Manually (auscultation method)
- Stethoscope: Littman Classic II SE (adults), Littmanä Classic II pediatric (children)
- Mercury manometer
- Variety of manual BP cuff sizes (child – extra large adult)
- Polar heart rate monitor
- Foot stool for shorter respondents
- Stopwatch
2.2 Eligibility
- All respondents aged 6 to 79
2.3 Exclusion criteria
Test exclusion
- Presence of the following on both arms: rashes, gauze dressings, casts, oedema, paralysis, tubes, open sores or wounds, withered arms, a-v shunts
- Blood pressure cuff too small or too large to fit on arm
Right arm exclusion
- Blood has been drawn from right arm within the last week
- Presence of the following: rash, gauze dressing, cast, oedema, paralysis, tubes, open sores or wounds, withered arm, a-v shunt
- Right mastectomy
- Right arm amputation
- Cast on right arm
2.4 Administering blood pressure
2.4.1 Electronically
- The respondent was situated in a quiet, comfortable environment. The respondent sat with his/her right arm supported and resting comfortably at heart level (the location of the heart was taken as the junction of the fourth intercostals space and the lower left sternal border).
- The proper cuff size associated with the arm circumference was chosen.
- The cuff was wrapped smoothly and snugly around the respondent's bare right arm, centering the bladder over the brachial artery. The lower edge of the cuff was placed 2 to 3cm above the antecubital space (elbow crease). The health measurement specialist (HMS) ensured that the respondent's clothing did not impede the blood flow to the arm (e.g., did not roll up the respondent's sleeve but rather provided a short sleeve shirt).
- The respondent was asked to rest in the seated position for at least 5 minutes prior to the measurement (with the cuff already on the arm). The respondent was asked to relax and not talk or move around during this 5 minute rest period.
- The HMS ensured that the respondent was in the correct seated position, which was as follows:
- Feet flat on the floor (for shorter respondents a foot rest was used)
- Legs/ankles uncrossed
- Back against the back rest of the chair
- Right arm resting straight on the table at the level of the heart, with the palm of the hand facing down.
- Before starting the measurement, the respondent were instructed not to move or talk during the test.
- The blood pressure was determined automatically by the BpTRU™ BP-300 as the average of 5 replicate measurements obtained at 1 minute intervals. (A total of 6 blood pressures were taken, with the first reading excluded from the average calculation).
- A minimum of 3 readings were required to complete the measurement. If more than 2 errors occurred (e.g., movement artefact), the HMS repeated the series of six measurements.
- After the series of six measurements was taken, the HMS reviewed the measurements listed on the screen and either accepted or re-did the measurements. There were 3 reasons why the HMS would be prompted to re-do the measurements:
- there was a BpTRU™ error
- for any trial) systolic BP – diastolic BP was < 20 or > 200
- Highest systolic BP – lowest systolic BP > 30
- Highest diastolic BP – lowest diastolic BP > 20
- Highest HR – lowest HR > 30
- Once the results of the second set of blood pressure measurements were taken, the HMS decided whether or not a third set of measurements were needed by using the information in table 1.
Note: If the respondent's right arm could not be used (refer to the right arm exclusion criteria), then the left arm was used.
a. Less than 3 valid measurements for BP and HR were recorded. A measurement was considered not valid if:
b. If the variability between the measurements was too large
| Outcome of 1st measurement | Outcome of 2nd measurement | Action |
|---|---|---|
| Obtained less than 3 valid measurements or if the variability between measurements was too large | Obtained less than 3 valid measurements or the variability was too large. | Re-do the measurements a third and last time by auscultation. |
| The respondent's BP (>144/94 mmHg) and/or heart rate (≥100 bpm ) are elevated. | Re-do the measurements a third and last time with the BpTRU™ to confirm. | |
| Obtained at least 3 valid measurements, the variability is within the acceptable range and the BP is considered normal. | Accept the measurements and go to the end of the component. | |
| Elevated BP or HR SBP >144 mmHg and/or DBP > 94 mmHg) and/or HR ≥100 bpm |
BP (>144/94 mmHg) and/or HR (≥100 bpm) are elevated again. | Accept the measurements and go to the end of the component. Read the high BP and/or HR message to the respondent. |
| Obtained less than 3 valid measurements or the variability was too large. | Re-do the measurements a third and last time with the BpTRU™ to confirm the first set of results. | |
| Obtained at least 3 valid measurements, the variability is within the acceptable range and mean BP is considered normal. | Accept the measurements and go to the end of the component. |
2.4.2 Manually (auscultation method)
- The respondent was situated in a quiet, comfortable environment. The respondent sat with his/her right arm supported and resting comfortably at heart level (the location of the heart was taken as the junction of the fourth intercostals space and the lower left sternal border).
- The HMS assisted the respondent with putting on the heart rate monitor. The strap was adjusted to ensure a strong reading from the heart rate monitor.
- The proper blood pressure cuff size associated with the arm circumference was chosen and the brachial artery was land-marked for proper cuff placement.
- The cuff was wrapped smoothly and snugly around the respondent's bare right arm, centering the bladder over the brachial artery. The lower edge of the cuff was placed 2 to 3cm above the antecubital space (elbow crease). The HMS ensured that the respondent's clothing did not impede the blood flow to the arm (e.g., did not roll up the respondent's sleeve).
- The respondent was asked to remain in the seated position for at least 5 minutes prior to measurement (with the cuff already on his/her arm). The respondent was asked to relax and not talk or move around during the 5 minute rest period.
- The HMS ensured that the respondent was in the correct seated position, which was as follows:
- Feet flat on the floor (for shorter respondents a foot rest should be used)
- Legs/ankles uncrossed
- Back against the back rest of the chair
- Right arm resting straight on the table at the level of the heart, with the palm of the hand facing down.
- Before starting the measurement, the respondent was instructed not to move or talk during the test.
- The maximum inflation level (MIL) was determined. The MIL or palpatory method provided an approximation of the systolic blood pressure to determine the highest level to which the cuff should be inflated when the actual measurement was made. The MIL was determined as follows:
- The respondent was positioned with the right palm upward. The HMS located the radial pulse in the right arm.
- The HMS inflated the cuff quickly to a pressure of 70 to 80 mmHg. Then they inflated the cuff in increments of 10 mmHg until the radial pulse was no longer palpable (palpated systolic). They continued inflating the cuff in increments of 10 mmHg to a final measure that was 30 mmHg above the pressure where the pulse was last palpated. This number was recorded as the MIL.
- The cuff was rapidly deflated and the return of the pulse was confirmed.
- If the HMS was unable to obtain the MIL they waited 1 minute and repeated the process.
- The following procedures were used for seated blood pressure readings:
- The HMS placed the stethoscope into his/her ear canals, angled forward to fit snugly.
- The HMS confirmed that the stethoscope head was in one of the two low-frequency positions. The positions to listen to low frequency sounds were either the open bell or tunable diaphragm using very light skin contact. If the open bell of the stethoscope was used, it was positioned over the brachial artery and held it firmly in place. If the tunable diaphragm was used, it was positioned over the brachial artery and pressed lightly against skin. The HMS ensured that the head made contact with the skin, around its entire circumference, for both positions. The HMS tried to avoid allowing the cuff, tubing, bell or diaphragm to come in contact with each other.
- The stopwatch was started (to time the intervals between measurements), and the cuff was rapidly and steadily inflated to the MIL.
- When the MIL was reached, the thumb valve was opened and the cuff was smoothly deflated at a constant rate (about 2 mmHg or one mark per second) while the HMS concurrently listened for Korotkoff sounds.
- Keeping the manometer at eye level, the HMS watched the top of the mercury column (meniscus) as the pressure in the bladder fell and noted the level of the meniscus when the first repetitive sounds were heard (Phase I) and when they disappeared (Phase V).
- The cuff was deflated at 2 mmHg per second for at least another 10 mmHg past where the last sounds were heard.
- The HMS rapidly deflated the cuff and disconnected the manometer tubing between measurements to ensure the cuff deflated completely to zero and had the respondent resting quietly for at least 30 seconds.
- The HMS entered Phase I (the level of the meniscus on the manometer at the first appearance of repetitive sounds) as the systolic blood pressure reading, and Phase V (the level of the meniscus when the last muffled sound was heard) as the diastolic blood pressure reading.
- The HMS repeated steps "a" to "h" five more times for a total of 6 measurements at 1 minute intervals.
- After the 6th measurement was entered, the application automatically calculated the average based on predetermined guidelines.
- The data from all 6 measurements were displayed on the computer screen and the HMS reviewed the measurements and either chose to accept or re-do the measurements based on the same criteria as previously outlined in the procedure for the automated BP measurement.
Note: If the respondent's right arm could not be used (refer to the right arm exclusion criteria), then the left arm was used.
Note: If phase I or V occurred between the millimetre marks on the glass column, then the HMS rounded upward to the nearest digit.
2.4.2 Manually (auscultation method)
- The respondent was situated in a quiet, comfortable environment. The respondent sat with his/her right arm supported and resting comfortably at heart level (the location of the heartwas taken as the junction of the fourth intercostals space and the lower left sternal border).
- The HMS assisted the respondent with putting on the heart rate monitor. The strap was adjusted to ensure a strong reading from the heart rate monitor.
- The proper blood pressure cuff size associated with the arm circumference was chosen and the brachial artery was land-marked for proper cuff placement.
- The cuff was wrapped smoothly and snugly around the respondent’s bare right arm, centering the bladder over the brachial artery. The lower edge of the cuff was placed 2 to 3cm above the antecubital space (elbow crease). The HMS ensured that the respondent’s clothing did not impede the blood flow to the arm (e.g., did not roll up the respondent’s sleeve).
Note: If the respondent’s right arm could not be used (refer to the right arm exclusion criteria), then the left arm was used.
- The respondent was asked to remain in the seated position for at least 5 minutes prior to measurement (with the cuff already on his/her arm). The respondent was asked to relax and not talk or move around during the 5 minute rest period.
- The HMS ensured that the respondent was in the correct seated position, which was as follows:
- Feet flat on the floor (for shorter respondents a foot rest should be used)
- Legs/ankles uncrossed
- Back against the back rest of the chair
- Right arm resting straight on the table at the level of the heart, with the palm of the hand facing down.
- Before starting the measurement, the respondent was instructed not to move or talk during the test.
- The maximum inflation level (MIL) was determined. The MIL or palpatory method provided an approximation of the systolic blood pressure to determine the highest level to which the cuff should be inflated when the actual measurement was made. The MILwasdetermined as follows:
- The respondent was positioned with the right palm upward. The HMS located the radial pulse in the right arm.
- The HMS inflated the cuff quickly to a pressure of 70 to 80 mmHg. Then they inflated the cuff in increments of 10 mmHg until the radial pulse was no longer palpable (palpated systolic). They continued inflating the cuff in increments of 10 mmHg to a final measure that was 30 mmHg above the pressure where the pulse was last palpated. This number was recorded as the MIL.
- The cuff was rapidly deflated and the return of the pulse was confirmed.
- If the HMS was unable to obtain the MIL they waited 1 minute and repeated the process.
- The respondent was positioned with the right palm upward. The HMS located the radial pulse in the right arm.
- The following procedures were used for seated blood pressure readings:
- The HMS placed the stethoscope into his/her ear canals, angled forward to fit snugly.
- The HMS confirmed that the stethoscope head was in one of the two low-frequency positions. The positions to listen to low frequency sounds were either the open bell or tunable diaphragm using very light skin contact. If the open bell of the stethoscope was used, it was positioned over the brachial artery and held it firmly in place. If the tunable diaphragm was used, it was positioned over the brachial artery and pressed lightly against skin. The HMS ensured that the head made contact with the skin, around its entire circumference, for both positions. The HMS tried to avoid allowing the cuff, tubing, bell or diaphragm to come in contact with each other.
- The stopwatch was started (to time the intervals between measurements), and the cuff was rapidly and steadily inflated to the MIL.
- When the MIL was reached, the thumb valve was opened and the cuff was smoothly deflated at a constant rate (about 2 mmHg or one mark per second) while the HMS concurrently listened for Korotkoff sounds.
- Keeping the manometer at eye level, the HMS watched the top of the mercury column (meniscus) as the pressure in the bladder fell and noted the level of the meniscus when the first repetitive sounds were heard (Phase I) and when they disappeared (Phase V).
- The cuff was deflated at 2 mmHg per second for at least another 10 mmHg past where the last sounds were heard.
- The HMS rapidly deflated the cuff and disconnected the manometer tubing between measurements to ensure the cuff deflated completely to zero and had the respondent resting quietly for at least 30 seconds.
- The HMS entered Phase I (the level of the meniscus on the manometer at the first appearance of repetitive sounds) as the systolic blood pressure reading, and Phase V (the level of the meniscus when the last muffled soundwasheard) as the diastolic blood pressure reading.
Note: If phase I or V occurred between the millimetre marks on the glass column, then the HMS rounded upward to the nearest digit.
- The HMS repeated steps “a” to “h” five more times for a total of 6 measurements at 1 minute intervals.
- After the 6th measurement was entered, the application automatically calculated the average based on predetermined guidelines.
- The data from all 6 measurements were displayed on the computer screen and the HMS reviewed the measurements and either chose to accept or re-do the measurements based on the same criteria as previously outlined in the procedure for the automated BP measurement.
- The HMS placed the stethoscope into his/her ear canals, angled forward to fit snugly.
3. Spirometry component
The Spirometry Component consists of two blocks, Spirometry Restriction (SPR) and Spirometry Measurement (SPM). Information related to the spirometry restriction block is included in the clinic questionnaire4.
The main volumes measured are:
- Forced vital capacity (FVC), which is the maximal volume of air exhaled through forced effort from a position of full inspiration, i.e. vital capacity performed with a maximally forced expiratory effort, expressed in litres at BTPS5.
- One second forced expiratory volume (FEV1), which is the maximal volume of air exhaled in the first second of a forced expiration from a position of full inspiration. This is expressed in litres at BTPS5.
Note: For respondents aged 6 to 7 the predicted equations were taken from 'Corey 1976'. For respondents 8 years and older the predicted equations were taken from 'Hankinson (NHANES III)'.
If the respondent's age, height or weight, were outside the published range for the selected predicted equation, the predicted values calculated were by extrapolation.
3.1 Equipment
- Koko spirometer
- Disposable mouthpieces - filtered
- Paediatric adapter - if necessary
- Disposable nose clip
- 3L Calibration syringe
- Barometer/thermometer
3.2 Eligibility
- All respondents aged 6 to 79
3.3 Exclusion criteria
- Respondent with a stoma (A surgically created opening of an internal organ on the surface of the body, i.e.: colostomy, tracheostomy)
- Pregnant women (> 27 weeks)
- Heart attack within the last 3 months
- Major surgery on chest or abdomen within the last 3 months
- Taking medication for tuberculosis
- Recent eye surgery (e.g., cataract, ≤ 6 weeks)
- Acute respiratory condition such as a cold, bronchitis, flu
- Respondents with an important language barrier
- Difficulty breathing at rest
- Persistent cough
3.4 Administering the spirometry measurement
- The health measurement specialist (HMS) recorded the respondent's appropriate 'race adjustment' category (see table 2). For a given standing height, people of certain ethnicities tend to have longer legs and shorter trunks than Caucasians. Consequently, these people have smaller lungs, and should not be assigned the same predicted lung capacity as Caucasians.
- The HMS provided thorough instructions, as well as a demonstration (without using the mouthpiece) of the test prior to having the respondent perform the test. The spirometry test depends greatly on the effort of the respondent; therefore it was important that the HMS adapted an appropriate coaching technique to ensure the best possible test results from each respondent.
- The respondent was instructed to sit with good posture, with both feet flat on the floor throughout the test. They were instructed not bend over at the waist during the exhalation phase. When testing older respondents, well-fitting false teeth were not routinely removed, since they preserve oropharyngeal geometry and spirometry results are generally better with them in place5.
- The HMS assisted the respondent to ensure the nose clip was on securely. The respondent must wear a nose clip during the test to avoid air escaping through his/her nose.
- The respondent placed the mouthpiece in his/her mouth and ensured that a good seal was obtained with the lips and that the teeth were resting on the outside of the mouthpiece.
- The respondent was instructed to breathe normally in and out through the mouthpiece.
- After a few normal breaths, the respondent was instructed to take a big, quick and deep breath in, filling the lungs with as much air as possible.
- At the end of the maximal inhalation, the respondent was instructed to immediately blast out all the air as forcefully and quickly as possible. It was important that the respondent did not hold his/her breath before blowing out.
- The HMS provided encouragement to the respondent during the exhalation phase. Once the respondent had obtained a 1 second plateau on the volume/time curve and exhaled for at least 6 seconds (or 3 seconds for children 6 to 10 years old), the HMS told him/her to take a big breath in (2nd maximal inspiration).
- Following the second maximal inspiration, the respondent was asked to remove the mouthpiece and nose clips.
- After each trial the HMS had to decide whether or not to retain the effort. This was done after the HMS assessed the trial quality (explained in the 'Assessing Trial Quality' section below).
- The respondent was given a short rest (about 30 to 45 sec) between trials to catch his/her breath. The HMS always observed the respondent for fatigue and did not allow another trial to be performed until the respondent had recovered from the previous trial.
- The HMS performed a minimum of 3 acceptable trials over a maximum of 8 attempts. If after 8 trials, there was still no reproducibility in the trials, the HMS selected the best trial that was done by the respondent and saved the efforts.
- The best test effort was determined by the sum of FVC and FEV1. At the end of all trials, the HMS confirmed that the chosen trial was indeed the best. If this was not the case, or the chosen trial was unacceptable due to technique or procedure, the HMS selected another trial as 'best'.
- All trials were saved and if fewer than 3 trials were performed, the HMS recorded the reason why.
If, during the household interview, the respondent reported more than one cultural/racial background (e.g., answered both Black & Arab to question SDC_Q24) the HMS selected a racial adjustment based on visual cues. The race variable from the household represents the respondent’s self-reported cultural and racial background while the race adjustment variable (SPM_022) is a variable used to perform a correction on the spirometry data based on the different morphology among the races and as such these two variables may not match for all respondents. Variable SMP_022 should only be used in conjunction with spirometry analyses.
Race adjustment: |
Reported racial background |
Correction Factor |
|
|---|---|---|---|
To Corey equation |
To Hankinson equation |
||
<1> White |
White |
None |
None |
Arab |
|||
Aboriginal |
|||
<2> Black |
Black |
10% decrease to equation used for whites |
None |
<3> Hispanic |
Mexican American |
None |
None |
<4> Asian |
South Asian / South East Asian |
10% decrease to equation used for whites |
10% decrease to equation used for whites |
West Asian |
|||
Chinese |
|||
Japanese |
|||
Korean |
|||
Filipino |
|||
<5> Other |
Other |
None |
None |
Unknown |
|||
3.5 Assessing Trial Quality
Two types of criteria assessments were done in order for the HMS to accept the trial: the within-manoeuvre criteria and the between-manoeuvre criteria.
3.5.1 Within-manoeuvre criteria
Within-manoeuvre criteria included two different criteria. First, the HMS needed to decide if the trial was usable, if it was, then they needed to decide if it was acceptable as follows:
Usable Trials
To be usable, the trial must:
- Have had a good start, which means no excessive hesitation or false start. The extrapolated volume (EV) must not have been greater than 0.5% of FVC or 0.150 L, whichever was greater. EV was determined by extrapolation through the steepest part of the curve, where flow was peak expiratory flow (PEF). FVC=4.291 L; EV=0.123 L (2.9% FVC)5.
- Have been without coughing during the first second of the manoeuvre, that would affect the measured FEV1 value, or any other cough that, in the HMS's judgment, interfered with the measurement of accurate results.
Acceptable Trials
To be acceptable, the trial must have met all of the previous conditions (be usable), plus it must:
- Have been free from glottis closure (Valsalva manoeuvre) or hesitation that caused a cessation of airflow. This could be seen as an abrupt plateau in the volume-time curve and an abrupt decrease in flow at the end of the manoeuvre in the flow-volume curve.
- Have been free from early termination or cut-off where it was apparent that the respondent failed to exhale for 6 seconds (or 3 seconds for children 6-10 years old) and there was no 1 second plateau of the volume-time curve
- Have been free from leaks that could be seen in the volume-time curve as a loss of volume over the 6 second exhalation or even a slightly negative flow at the end of the manoeuvre.
- Have been free from obstruction (e.g., obstruction due to the tongue being placed in front of the mouthpiece, or teeth in front of the mouthpiece, or mouthpiece deformation due to biting).
- Have been free from evidence of an extra breath being taken during the manoeuver5.
- Have had good starts:
- Extrapolated volume 0.5% of FVC or 0.15 L, whichever is the larger value (refer to "a" in the usable trials section).
- A 'good peak' was seen on the flow-volume [F(t)] curve (time to peak flow is less than 120 ms).
- Have shown satisfactory exhalation:
- There was no early termination (refer to "d" in this section);
Or;
- There was a plateau in the volume–time [V(t)] curve;
- There was no instance where the respondent could not or should not continue to exhale;
- There was an effort that is maximal throughout.
3.5.2 Between-manoeuvre criteria:
Between-manoeuvre criteria were used to assess reproducibility between trials. When three acceptable spirograms were obtained, the HMS checked for between-manoeuvre reproducibility:
- If respondent's FVC was > 1.0L then reproducibility criteria were when:
- The two largest FVCs were within ≤ 150ml of each other
- The two largest FEV1s were within ≤ 150ml of each other
- If respondent's FVC was ≤ 1.0L then reproducibility criteria were when:
- The two largest FVCs were within ≤ 100ml of each other
- The two largest FEV1s were within ≤ 100ml of each other
If, after three trials, both of the criteria were met, the test session could be concluded.
- The HMS ensured that the three trials were acceptable
- The HMS ensured that two of them were reproducible.
If, after three trials, both of the criteria were not met, the HMS continued testing until
- Both of the criteria were met with analysis of additional acceptable spirograms
or
- A total of eight tests had been performed or,
- The patient/subject could not or should not continue5.
Note: A respondent could give a usable, acceptable, and reproducible effort without giving a maximal effort. The HMS tried to ensure that the respondent gave a maximal effort to blow as hard as possible for as long as possible (e.g., facial expression, body language, etc). Even if the acceptability and reproducibility criteria were met after three trials, doing 1 or 2 extra trials was strongly suggested, particularly if a respondent continue to improve after each trial. There is a learning curve in performing spirometry and respondents often get better and better after each trial.
3.6 Assessing Data Quality
A quality review of all spirometry data was performed by a spirometry expert prior to the results being returned to respondents and data being released. The review included an evaluation of all trials to determine trial acceptability and test reproducibility/quality.
3.6.1 Trial Acceptability
All trials were given an acceptability code (1= acceptable or 2=unacceptable). Only acceptable curves were used in the determination of the best test data. A trial was coded as unacceptable if any of the following were noted in the trial:
- There is a cough in the first second of the trial; or
- There is a large extrapolated volume caused by excessive hesitation; or
- If the reviewer notes that data within the trial could affect the accuracy of best test data or derived variables (e.g., trial has largest FVC but QC, reviewer feels end of test is not reliable); or
- If the reviewer notes that the entire trial is of insufficient quality to be used for analysis.
3.6.2 Test Quality and Reproducibility
All acceptable trials were reviewed to determine whether the test results for FVC and FEV1 represented a maximal effort by the respondent (quality) and met the reproducibility of 150ml. The FVC quality factor (SPM_QFVC) and FEV1 quality factor (SPM_QV1) indicate whether a reproducible FVC and/or FEV1 were obtained.
A: Excellent quality and reproducibility. Use in analysis.
B: Good quality and reproducibility. Use in analysis.
Example: A common case is for children and adolescents who do not exhale for the required length of time (3 or 6 seconds). If these respondent’s trials show a 1 second plateau and the reviewer judges that the curves represent a maximum volume (FVC) then a code B is assigned.
C: Questionable quality and reproducibility. Use in analysis with caution.
Example: A respondent has only 2 acceptable curves which are not reproducible and the other curves are unacceptable due to early termination and large extrapolated volumes. However, the curves with the large extrapolated volumes do confirm the FVC reproducibility.
Example: A respondent with chronic obstructive pulmonary disease (COPD) and a low FEV1/FVC (e.g., <0.45). Because of COPD, the respondent cannot provide a repeatable FVC with even 8 manoeuvres. So, the grade should be at least a C or better as the lack of an acceptable curve due to end of test failures is not a sufficient reason to exclude or grade the subject’s results with a D or F.
D: Highly questionable reproducibility and quality. Do not use in analysis.
F: Unacceptable test results. Do not use in analysis.
4. Musculoskeletal fitness
4.1 Grip strength component
Muscular strength refers to the maximum force that can be generated by a specific muscle or muscle group. The most common method of measuring muscular strength in the field is isometric grip strength.Isometric grip strength is measured using a handgrip dynamometer. The protocol for the Grip Strength Component was based on the Canadian Physical Activity, Fitness and Lifestyle Approach (CPAFLA)1 for adults 15 to 69 and on the 1981 Canada Fitness Survey2 for 7 to 14 year old children.
4.1.1 Equipment
- Smedley III hand dynamometer (Takei Scientific Instruments Grip A).
4.1.2 Eligibility
- Respondents aged 6-79.
4.1.3 Exclusion criteria
- Respondents who had positive response(s) to PAR-Q questions 5, 6 and 7 (depending upon probing by the HMS). (See appendix 3)
- Respondents who had limited upper extremity function—respondent was unable to hold the dynamometer with both hands (e.g., missing fingers on both hands, paralysis of both hands), were screened out. Respondents who were able to grip the dynamometer with one hand still performed the component.
4.1.4 Administering the grip strength
- The HMS demonstrated the correct technique, emphasizing that the respondent should not hold his/her breath while performing the test (avoid Valsalva manoeuvre). The respondent was asked to remove any hand and wrist jewellery.
- The respondent was instructed to grasp the dynamometer in his/her right hand, with the grip between the fingers and the palm at the base of the thumb.
- The grip size of the dynamometer was adjusted using the screw until the second joint of the fingers fit snugly under the handle and took the weight of the instrument.
- The respondent was instructed to hold the dynamometer in line with the forearm at the thigh level, away from the body at a 45° angle. The respondent was asked to adopt a stable body position with the feet hip width apart. The respondent was instructed that neither the hand nor the dynamometer were to touch the body or any other object during the test.
- The respondent was then asked to squeeze vigorously to exert maximum force, exhaling while squeezing to avoid build-up of intra-thoracic pressure.
- The dynamometer was reset and the test was repeated on the left hand. Both hands were measured twice, alternating hands between trials.
- The scores were recorded for each hand to the nearest kilogram.
4.2 Sit and reach component
The protocol for the Sit and Reach Component was based on the Canadian Physical Activity, Fitness and Lifestyle Approach (CPAFLA)1 for adults 15-69 and on the 1981 Canada Fitness Survey2 for 7-14 year old children.
4.2.1 Equipment
- Exercise mat
- Flexometer
4.2.2 Eligibility
- Respondents 6-69 years old.
4.2.3 Exclusion criteria
- Respondents who had positive response(s) to PAR-Q questions 5 and 7 (depending upon probing). (See Appendix 3)
- Pregnant women (> 12 weeks)
- Respondents 70 years of age and older
- Colostomy bag
- Lower body paralysis
- Home visit
4.2.4 Administering sit and reach
- Respondents performed this test without shoes, after a short stretching warm up. The test was demonstrated prior to having the respondent perform it.
- The respondent was asked to sit with legs fully extended with the soles of the feet placed flat against the flexometer. The inner edge of the soles of the feet were positioned 6 inches apart. The flexometer was secured against the wall.
- The respondent was asked to bend and reach forward without jerking, keeping the knees fully extended, arms evenly stretched with palms down, and hands placed one on top of the other. The respondent's finger tips pushed the sliding marker along the scale. The fingertips of one hand could not extend beyond the fingertips of the other hand.
- The position of the maximum flexion was held for approximately two seconds. Respondents were advised that lowering the head and breathing out would maximize the distance reached.
- If the respondent's knees flexed, the trial was not counted. Bouncing or jerking motions were not allowed.
- The test was performed twice, with a short rest between trials. The maximum distance reached at the end of each trial was recorded to the nearest 0.1cm.
4.3 Partial curl-up component
The protocol for the Partial Curl-up Component is based on the Canadian Physical Activity, Fitness and Lifestyle Approach (CPAFLA)1.
4.3.1 Equipment
- Gym mat with 10 cm metal strap on one end
- Goniometer
- Metronome
4.3.2 Eligibility
- Respondents 6-69 years of age.
4.3.3 Exclusion criteria
- Respondents who had positive response(s) to PAR-Q questions 1, 2, 3 (automatic) and 5, 6 and 7 depending upon probing). (See Appendix 3)
- Pregnant women (> 12 weeks)
- Respondents 70 years of age and older
- Respondents with resting heart rate > 100 bpm or blood pressure > 144/94 mmHg as determined during the blood pressure component.
- Mentally and physically disabled individuals (at the discretion of the HMS)
- Difficulty breathing at rest
- Persistent cough
- Lower extremity swelling
- Appears ill or complains of fever
- Colostomy bag
- Home visit
4.3.4 Administering partial curl-ups
- The correct positioning of the curl-up was first demonstrated to the respondent by the HMS.
- The respondent was asked to get into the starting position as follows:
- Lie in the supine position with the head resting on the mat, shoulders relaxed, arms straight at the sides and parallel to the trunk, palms of hands in contact with the mat, and the middle finger tip of both hands touching the back edge of the metal strap when the arms are fully extended. If the respondent had one arm that was longer than the other, the back edge of the metal strap was placed at the middle finger of the longest arm.
- The respondent's legs were bent, shoulder-width apart, knees at a 90 degree angle (the goniometer was used to establish the correct angle).
- The respondent's heels stayed in contact with the floor. The test was performed with shoes on. In the case where the respondent did not have appropriate footwear, the test was performed in sock feet.
- Action:
- The metronome set at 50 beats per minutes. The HMS was allowed to call out "up on a beat, down on a beat" during the test if respondents had difficulty following the beat of the metronome.
- The respondent was told to slowly curl up far enough so that the tip of the middle finger of both hands reached the far end of the metal strap.
- It was explained to the respondent that his/her fingers must remain in contact with the metal plate and his/her heels must remain in contact with the floor. Anchoring of the feet was not permitted.
- The respondent was instructed that on return, the shoulder blades and head must come in contact with the mat, and the tip of the middle finger of both hands must touch the back edge of the metal strap.
- The movement was to be performed in a slow, controlled manner in order to perform the lifting and lowering stages of the curl-up at a rate of 25 per minute (up on beat, down on a beat).
- The respondent was asked to perform as many consecutive curl-ups as possible, without pausing, to a maximum of 25 in the one-minute time period.
- Only properly executed curl-ups were counted and feedback was provided on incorrectly executed curl-ups.
- The test was terminated before the one minute mark if the respondent was:
- experiencing undue discomfort;
- unable to maintain the required cadence;
- unable to maintain the proper curl-up technique (e.g., heels came off the floor) over two consecutive repetitions despite corrections by the HMS.
- The number of partial curl-ups completed was recorded. Incorrect curl-ups were not recorded.
Note: The same mistake had to have been made 2 times in a row for the test to be terminated. If two different mistakes were made consecutively then the test continued until two of the same mistakes were made in a row or 25 curl-ups were completed.
5. Modified Canadian Aerobic Fitness Test (mCAFT) component
The protocol for the modified Canadian Aerobic Fitness Test (mCAFT) Component is based on the Canadian Physical Activity, Fitness and Lifestyle Approach (CPAFLA)1 for adults 15-69 years of age and on the 1981 Canada Fitness Survey6 for children aged 6-14 years of age.
5.1 Equipment
- BpTRU™ automated blood pressure cuff (including various cuff sizes)
- mCAFT step
- mCAFT CD
- CD player
- Timer or stopwatch
- Metronome (optional)
- Stethoscope (optional)
- Heart rate monitor (belt, strap, watch)
- Mercury sphygmomanometer (optional)
5.2 Eligibility
- All respondents aged 6-69
5.3 Exclusion criteria
- Positive response to PAR-Q questions 1, 2, 3 or 6 (automatic) or 4, 5 or 7 (depending upon probing). (See Appendix 3)
- Respondents taking heart rate or blood pressure altering medications
- Pregnant women (> 12 weeks)
- Respondents who are 15 years of age and older with resting heart rate > 99 bpm or resting blood pressure > 144/94 mmHg as determined during the screening component
- Mentally and physically impaired individuals, at the discretion of the HMS. Every effort should be made to be inclusive of individuals with disabilities provided that all safety precautions are taken into account
- Respondent donated blood within the last 24 hours
- Difficulty breathing at rest
- Respondents taking medication for a breathing condition that worsens during exercise, but do not have his/her medication with them (as assessed during the Screening Component)
- Appears ill or complains of fever
- Persistent cough
- Lower extremity swelling
- Insulin pump
- Supplemental oxygen
- Drank alcohol since midnight
- Consumed a large meal within 1 hour of appointment start time
- Home visit
5.4 Administering the mCAFT
- The health measurement specialist (HMS) asked all respondents if they need to go to the washroom before they started the test.
- The HMS explained the test and assisted the respondent in putting on the heart rate monitor. The strap was adjusted as needed to ensure a strong reading from the heart rate monitor. The HMS ensured that the room temperature was between 21°C ± 2°C.
- The HMS demonstrated the two-step stepping pattern, first without music and then with the music set at the respondent's first stepping stage. Each respondent started stepping at a stage where the cadence intensity was 65-70% of the mean aerobic power expected of a person 10 years older than him/her. Male respondents 15-69 years old used a two-step pattern for stages 1 through 6 and a one-step pattern for stages 7 and 8. Female respondents 15-69 years old used the one-step pattern for stage 8 only. All stepping stages for respondents 6-14 years of age were done using the 2-step pattern and the music for the stages was always that of the adult female (based on the 1981 Canada Fitness Survey protocol)2. The starting stage was stage 5, regardless of gender. If the respondent completed the 7th stage, the test was stopped regardless of whether the ceiling heart rate was reached. In these cases, the respondent's heart rate at the end of stage 7 was used to determine the fitness level.
- The HMS had the respondent try the two-step stepping pattern with the music. The HMS then demonstrated the one-step stepping pattern to the respondent. If the respondent's heart rate after trying the two-step stepping pattern was under 100 bpm, the HMS had the respondent try the one-step stepping pattern. If the respondent's heart rate was above 100 bpm after trying the stepping patterns, the HMS had the respondent rest before starting the test. The respondent was reminded that each stepping stage was 3 minutes long and that when the music stopped he/she was to stop, turn to face the HMS and to stand still. The respondents were advised not to talk during the mCAFT unless it was necessary to do so.
- The HMS began the test at the pre-calculated start stage. The HMS guided the respondent if they had difficulty keeping up with the rhythm. During the test, the HMS stood next to the respondent and monitored them for signs of discomfort. The test was stopped immediately if the respondent began to stagger, complained of dizziness, extreme leg pain, nausea, chest pain or if he/she shows facial pallor.
- At the end of each stepping stage, the respondent stopped, turned towards the HMS and stood still. The HMS read the heart rate from the heart rate monitor when the instructor on the CD said "STOP EXERCISING". This value was recorded into the data capture application.
- If the respondent's heart rate was below the pre-calculated ceiling heart rate, the HMS had him/her prepare to start the next stepping stage. If the heart rate was equal to or above the pre-calculated ceiling heart rate, the stepping portion of the test was finished. If the respondent reached the pre-calculated ceiling heart rate during a stepping stage, he/she completed the full 3 minutes of the stage. As soon as the stepping portion was complete, the HMS started the stop watch and proceeded to the post-test procedures.
Note: If a respondent was unable to complete a stage the reason was recorded. Post-exercise heart rate and blood pressure were monitored in these cases.
| Key | Reason | When to choose this answer |
|---|---|---|
| 1 | Refusal | Respondent refuses to participate |
| 2 | Unable to maintain proper cadence | Respondent cannot perform the test at the proper cadence |
| 3 | Dizziness | Respondent feels dizzy |
| 4 | Extreme leg pain | Respondent cannot go on or start the test due to leg pain (lactic acid build up, injury, arthritis…) |
| 5 | Nausea | Respondent feels nauseated or has an extreme headache |
| 6 | Chest pain | Respondent feels chest pain |
| 7 | Facial pallor | Respondent appears ill |
| 8 | Other – Specify | Any other reason not mentioned above. You will be prompted to explain this reason in a text box. |
Note: If the HMS was not able to get a reading from the heart rate monitor, they determined the heart rate manually, using the stethoscope. The HMS placed the stethoscope head near the sternum at the 2nd intercostal space. The HMS took the pulse for a 10-second timing sequence.
Note: If a respondent was unable to complete a stage record the reason why. Post-exercise heart rate and blood pressure were monitored in these cases.
5.5 Post-test procedures
-
Upon completion of the final stepping stage, the respondent was asked to walk around slowly for 1.5 minutes. The heart rate monitor was removed from the respondent's chest. If the respondent appeared overly fatigued or was light-headed at the end of the test, the HMS had him/her sit down and elevated the legs.
-
After 1.5 minutes, the respondent was asked to sit down.
-
The respondent's blood pressure was taken (electronically or manually) at 2:00 minutes post exercise and 3:30 minutes post exercise. These measurements were recorded.
-
If the respondent's blood pressure reading at 3:30 min was > 144/94 mmHg and/or the heart rate was > 99 bpm the HMS continued to measure the heart rate and blood pressure at two minute intervals until the respondent's readings had dropped below 145/95 mmHg and 100 bpm.
6. Oral Health component
A dentist's survey manual was designed to collect information needed to assess the oral health status of Canadians and was based on the World Health Organization (WHO) criteria. The survey responses were directly entered into a computer. The World Dental Federation (FDI) numbering system was used. There were 4 blocks to the dentist's survey manual; the Oral Health Component Introduction, the Oral Health Questions, the Oral Health Restriction and the Oral Health Examination. For more information, please refer to the Canadian Health Measures Survey 2006-2008, Dentist's Survey Manual and Coding Criteria7.
6.1 Equipment
- a plane mirror
- a graduated Williams periodontal probe
- cotton rolls and gauze
6.2 Eligibility
- All respondents aged 6-79
6.3 Exclusion criteria
The follow criteria excluded the respondent from the probing score assessment portion of the oral health examination component.
- Respondents who need to take antibiotics (for example, penicillin) before a check-up or get dental care.
- Respondents who have been diagnosed by a health professional with a heart murmur that requires them to take antibiotics for dental treatment.
- Respondents who have been diagnosed by a health professional with a heart valve problem.
- Respondents who have been diagnosed by a health professional with congenital heart disease.
- Respondents who have been diagnosed by a health professional with bacterial endocarditis?
- Respondents who have been diagnosed by a health professional with rheumatic fever?
- Respondents who have had bypass surgery in the past year.
- Respondents who have had a pacemaker or other automatic defibrillator for less than one year.
- Respondents who have other artificial material in his/ heryour heart, veins or arteries?
- Respondents who have had a joint replacement.
- Respondents who have ever received an organ transplant.
- Respondents who have kidney disease that requires dialysis.
- Respondents who are immuno-supressed or are on immuno-suppression therapy (for example, chemotherapy).
- Respondent who had haemophilia or had received chemotherapy in the past four weeks
6.4 Administering the oral health component
Oral health questions block (OHQ)
- Next the dentist asked a series of questions pertaining to the oral health of the respondent. These questions compliment the examination block and help to build a better profile of the respondent. During this component the dental recorder entered the answers provided by the respondent into the data capture application.
Oral health restriction block (OHR)
-
Before the oral health examination block, the dentist asked specific oral health screening questions to determine whether the respondent could participate in the entire oral health component.
-
During this component the dental recorder entered the answers provided by the respondent in the data capture application.
-
If the respondent answered yes to any the restriction questions (with the exception of the question on pacemakers or other automatic defibrillators which had a second probing question) the oral health restrictions block was exited and the respondent was automatically screened out of the probing score assessment portion of the oral health examination component. Any respondent who had had haemophilia or had received chemotherapy in the past four weeks skipped this block of questions completely as he/she had been automatically screened out of probing because of these conditions.
Oral health examination block (OHE)
-
At the start of the oral health examination block, the dentist explained the process to the respondent and showed the respondent the tools that were used during the examination.
-
As the dentist progresses from question to question, the dental recorder cued the dentist on which assessment was next and, if applicable, with which tooth number the dentist should start. This was important as the flow of the tooth examinations varied from question to question and a prompt by the dental recorder helped to limit errors.
- The oral health examination block assessed the following:
- Dentate status - This section served to record the condition of the respondent's natural teeth.
- Prosthetic status - This section served to record whether the respondent had any artificial teeth in either their upper or lower arch. The dentist asked if the respondent has any prosthetic appliances even if the respondent is not wearing them.
- Mucosal status - This section served to record the presence or absence of any oral pathology. An oral pathology is defined as any abnormality in the oral cavity.
- Fluorosis - This section served to record a fluorosis score for the anterior permanent maxillary incisors for respondents aged 6-12.
- Orthodontic status/treatment - This section served to record the orthodontic status and treatment of respondents > 12 years of age. Respondents who are edentulous skipped this section of questions.
- Periodontal assessments - This portion of the examination included an assessment of gingivitis, debris, calculus, attachment loss and a probing score. The age of the respondent and the medical history already recorded (OHR block, haemophilia, chemotherapy) determined if the respondent could participate in attachment loss and periodontal probing. Respondents who were less than 15 years old or was not medically fit for attachment loss, periodontal probing or sub-gingival calculus assessment, the "Attachment loss" and "Probing score" skipped this section.
- Tooth status - This section served to record the status of each of the respondent's teeth. For respondents aged 17 years or younger, the dentist did not perform a root examination. For a child with mixed dentition (having both primary and permanent teeth) the status of whichever tooth was present in the mouth was recorded. If both the primary and permanent teeth were present then the permanent tooth took precedence.
- Amalgam count - This section served to record the total number of tooth surfaces with amalgam (silver) fillings.
- Traumatic injury - This section served to record the condition of each of the four permanent upper and four permanent lower incisor teeth.
- Treatment needs - This section served to record the dentist's view of the treatment needs of what the respondent needs on this day assuming there are no financial barriers. This included prosthetic needs and general treatment needs.
- Urgent treatment needed - Once the respondent has left the oral health room, the dentist completed the "Urgent Needs" section of the component.
- Medical condition discovered - If the dentist performing the examination noticed that the respondent has one of the following conditions: oral lesion, severe acute infection and/ or another serious condition requiring attention from a medical professional within a week, then it was recorded.
7. Urine Component
The purpose of the urine collection component was to obtain laboratory results for respondents ages 6 to 79 on a variety of measures that will be used to obtain prevalence estimates of disease, risk factors for diseases, and baseline information on health, nutritional status and environmental exposure of the population.
Approximately 70mL of urine was collected from each respondent aged 6 to 79 years. The Urine Collection Component could be completed at any time during the clinic visit.
7.1 Exclusion criteria
- if the respondent has a mental or physical condition that prevents him/her from providing a sample
- if there is a language barrier that prevents proper instruction of collection.
7.2 Equipment
- urine cup
7.3 Urine Collection
| 1. | Wash hands with soap and water. |
| 2. | Open the urine cup. Do not touch the inside of the cup or the lid. |
| 3. | Urinate a small amount of urine into the toilet and, without stopping, catch as much urine as possible in the cup. If possible, fill the cup up to the black line with urine. |
| 4. | Place the lid tightly on the container, taking care not to touch the edges of the inside of the container. Rinse and dry the container. Place the container in the brown paper bag provided. |
| 5. | Wash your hands with soap and water. |
| 6. | Return the urine cup in the brown paper bag to the CHMS staff member. |
Note: On occasions it may have been necessary to obtain multiple urine samples to meet volume requirements. More than one urine sample was required only if the respondent’s first urine sample was less than ¾ of the requested volume.
7.4 Handling urine samples
Upon receipt, urine samples were placed in the fridge with the barcode facing outward until processing. If a respondent provided more than one urine sample the sample containers were pooled upon receipt of the second sample. If time did not permit, they were kept together and labeled 1, 2 etc.
7.4.1 Urine splitting
| Collection Type | Test ID # | Test Name | Age (years) | Preferred Sample Volume (mL) |
Minimum Sample Volume (mL) |
Specimen Tube Capacity (mL) |
Specimen Tube Type |
Cap Colour |
|---|---|---|---|---|---|---|---|---|
| Urine Cup | 701 | Microalbumin/ Creatinine |
6 to 79 | 2.0 | 0.5 | 2.0 | VWR |
Blue |
| 751 | Cotinine | 6 to 79 | 4.5 | 0.5 | 5.0 | VWR Cryogenic |
Red | |
| 752 | Phthalates | 6 to 49 (3500) |
15.0 | 12.0 | 30.0 | Nalgene | Clear | |
| 753 | Inorganic Mercury | 6 to 79 | 4.5 | 1.6 | 5.0 | VWR Cryogenic |
Clear | |
| 754 | Bisphenol A | 6 to 79 (5000) |
(see note) | 20.0 | 30.0 | Nalgene | Clear | |
| 702 | Iodine | 6 to 79 | 4.0 | 2.0 | 5.0 | VWR Cryogenic |
Green | |
| 755 | Organophosphate Pesticides | 6 to 79 (5000) |
(see note) | With test 754 | 30.0 | Nalgene | Clear | |
| 756 | Phenoxy herbicide | 6 to 79 (5000) |
(see note) | With test 754 | 30.0 | Nalgene | Clear | |
| 971 | Stored Urine 1 | 6 to 79 | 4.5 | NA | 5.0 | VWR Cryogenic |
Yellow | |
| 972 | Stored Urine 2 | 6 to 79 | 4.5 | NA | 5.0 | VWR Cryogenic |
Yellow | |
| Note: Test numbers 754, 755, and 756 are all analyzed from the same 30ml bottle. | ||||||||
7.5 Specimen storage
Specimens were stored in the mobile clinic lab in the refrigerator and were shipped once a week to the reference labs. All specimens were to be stored as soon as processing was complete.
For more information regarding the laboratory standard operating procedures (SOP) please contact the Canadian Health Measures Survey at 1-888-253-1087 or chms-ecms@statcan.gc.ca.
8. Phlebotomy Component
During the Phlebotomy Component the phlebotomist collected blood samples in order to measure nutritional status, metabolic syndrome, cardiovascular disease and infectious disease markers.
8.1 Exclusion Criteria
- Chemotherapy within the past 4 weeks
- Haemophilia
- Double mastectomy
- Rashes, gauze dressings, casts, edema, paralysis, tubes, open sores or wounds, withered arms or limbs missing, damaged, sclerosed or occluded veins, allergies to cleansing reagents, burned or scarred tissue, shunt or IV on both arms.
8.2 Equipment
|
|
|
|
|
|
|
|
|
|
|
|
|
|
|
|
|
|
|
|
|
|
|
|
8.3 Performing the Venipuncture Procedure
8.3.1 Selecting the Appropriate Vein
Whenever possible, a vein on the left arm was looked for first.
The median cubital and cephalic veins were the most common veins to use for the venipuncture procedure. If there were no suitable veins in this area, on either arm, the phlebotomist looked at the back of the hands of the respondent. These veins were used as a last resort and a butterfly needle was always used for this procedure.
8.3.2 Preparing for the blood draw
-
The phlebotomist determined the appropriate needle size.
-
The site was cleaned with an alcohol wipe in a circular motion beginning with the centre of the site and moving outwards.
-
All the required supplies for the venipuncture were prepared. All the tubes required were placed in the proper order (see tables 2a and 2b).
-
The phlebotomist reapplied the tourniquet when they were ready to perform the procedure. They had the respondent make a fist and hold it. They instructed the respondent not to pump his/her fist as this can affect certain test results.
| Tube order | Tube Type | Size | Age in Years | |||
|---|---|---|---|---|---|---|
| 6 to 11 | 12 to 13 | 14 to 19 | 20 to 79 | |||
| 01 | Red/Grey SST | 8.5mL | Y | Y | Y | Y |
| 02 | Light Grey | 2.0mL | Y | Y | Y | Y |
| 03 | Lavender EDTA | 6.0mL | Y | Y | Y | Y |
| 04 | Lavender EDTA | 6.0mL | Y | Y | Y | Y |
| 05 | Red/Grey SST | 8.5mL | Y | Y | ||
| 06 | Lavender EDTA | 10mL | Y | |||
| 07 | Light Blue | 1.8mL | Y | Y | Y | |
| 08 | Gold SST | 5.0mL | Y | Y | Y | Y |
| 09 | Lavender EDTA | 10mL | Y | |||
| 10 | Lavender EDTA | 10mL | Y | |||
| 11 | Red/Grey SST | 8.5mL | Y | Y | Y | |
Tube order |
Tube Type |
Size |
Age in Years |
|||
|---|---|---|---|---|---|---|
6 to 11 |
12 to 13 |
14 to 19 |
20 to 79 |
|||
01 |
Red/Grey SST |
8.5mL |
Y |
Y |
Y |
Y |
02 |
Lavender EDTA |
6.0mL |
Y |
Y |
Y |
Y |
03 |
Lavender EDTA |
6.0mL |
Y |
Y |
Y |
Y |
04 |
Red-Grey SST |
8.5mL |
|
|
Y |
Y |
05 |
Light Grey |
2.0mL |
Y |
Y |
Y |
Y |
06 |
Lavender EDTA |
10mL |
|
|
|
Y |
07 |
Light Blue |
1.8mL |
|
Y |
Y |
Y |
08 |
Gold SST |
5.0mL |
Y |
Y |
Y |
Y |
09 |
Lavender EDTA |
10mL |
|
|
|
Y |
10 |
Lavender EDTA |
10mL |
|
|
|
Y |
11 |
Red/Grey SST |
8.5mL |
|
Y |
Y |
Y |
8.4 Handling blood samples
Blood samples were brought into the lab by the phlebotomist as soon as possible after collection.
| Time | Tube Type (Test Number) | Handling |
|---|---|---|
| During first 15 minutes post collection | 6.0mL EDTA lavender (03or 02)1 6.0mL EDTA lavender (04 or 03)1 2.0mL light grey (02 or 05)1 10.0mL EDTA lavender (06) 1.8mL light blue (07) 10.0mL EDTA lavender (09 and 10) |
|
| 8.5mL red/grey (01) 8.5mL red/grey (05 or 04)1 5.0mL gold SST (08) 8.5mL red/grey (11) 3.0mL red (99) |
|
|
| After first 15 minutes | 8.5mL red/grey (01) 8.5mL red/grey (05 or 04)1 5.0mL gold SST (08) 8.5mL red/grey (11) |
|
| 10.0mL EDTA lavender (09 and 10) |
|
|
| 6.0mL EDTA lavender (03 or 02) 3.0mL red top (99) |
|
|
| 6.0mL EDTA lavender (04 or 03)1 2.0mL light grey (02 or 05) 10.0mL EDTA lavender (06) 1.8mL light blue (07) |
|
|
| After second 15 minutes | 6.0mL EDTA lavender (03 or 04)1 2.0mL light grey (02 or 05)1 10.0mL EDTA lavender (06) 1.8mL light blue (07) 8.5mL red/grey (01) 8.5mLred/grey (05 or 04)1 5.0mL gold SST (08) 8.5mL red/grey (11) |
|
| After centrifugation | 6.0mL lavender (03 or 02)1 3.0mL red (99) 8.5mL red/grey (01) 8.5mL red/grey (05 or 04)1 5.0mL gold SST (08) 8.5mL red/grey (11) 2.0mL light grey (02 or 05)1 6.0mL lavender (04 or 03)1 10.0mL EDTA lavender (06) 1.8mL light blue (07) |
|
| 1. the first test number is for fasted respondents, the second is for non-fasted respondents. | ||
All samples were centrifuged within two hours and aliquotted within four hours of the blood draw. Test 132 (homocysteine) was aliquotted within 1.5 hours.
8.4.1 Serum handling
There were a maximum of four serum collection tubes that could be drawn depending on the age and test eligibility of the respondent. Serum from the SST tubes (red/grey and gold) was first pooled into the pre-labelled 30ml Nalgene bottle prior to being aliquotted into individual specimen tubes.
The phlebotomist was given the following instructions when performing serum handling:
-
After centrifugation, inspect all tubes for fibrin strands that may be left in the serum. If strands of fibrin are visible, remove them from the sample with an applicator stick and dispose of the stick in the biohazard waste. Also ensure that the gel has indeed separated the cells and serum as it should.
-
Repeat the above step for each serum collection tube (all red/grey and gold top collection tubes)
-
Pour off serum from each serum collection tube into the pooled serum bottle. The separation gel will prevent any red cells from decanting. Remove as much serum as possible from each collection tube.
Note: Avoid pooling serum that is moderately or grossly hemolyzed. Keep these tubes separate and use them for measures such as hepatitis and lipid profile where hemolysis is not an issue. Serum which is slightly hemolyzed would be acceptable to add to the pooled serum bottle. -
Screw the lid tightly on the pooled serum bottle and mix the serum by briskly swirling or inverting the bottle 2 to 3 times.
-
Record whether there is any problem with the specimen that has been transferred to the pooled serum bottle based on the definitions outlined in Table 7.
- Set the bottle aside until ready to separate into specimen tubes.
8.5 Specimen processing
Samples were processed as soon as possible to keep sample integrity at its highest.
8.5.1 Whole blood splitting
| Collection Type | Test ID # | Test Name | Age (Years) | Preferred Sample Volume (mL) |
Minimum Sample Volume (mL) |
Specimen Tube Capacity (mL) |
Specimen Tube Type |
Cap Colour |
|---|---|---|---|---|---|---|---|---|
| 6.0mL EDTA | 111 | Glycosylated Hemoglobin | 6 to 79 | 1.5 | 1.0 | 2.0 | Nalgene | Clear |
| 112 | RBC Folate | 6 to 79 | 0.2 | 0.1 | 2.0 | VWR Cryogenic | Orange | |
| 511 or 512 |
Metal Screen 1 | 6 to 79 | 1.8 | 0.8 | 2.0 | Nalgene | Clear | |
| Metal Screen 2 | 6 to 79 | 1.8 | 1.3 | 2.0 | Nalgene | Clear | ||
| 10mL EDTA1 | 09 | DNA | 20+ | 10.0 | NA | 10.0 | Collection Tube | Lavender |
| 10mL EDTA1 | 10 | DNA | 20+ | 10.0 | NA | 10.0 | Collection Tube | Lavender |
| 1. 10 mL EDTA tubes are not aliquotted | ||||||||
8.5.2 Plasma splitting
| Collection Type | Test ID # | Test Name | Age (Years) | Preferred Sample Volume (mL) |
Minimum Sample Volume (mL) |
Specimen Tube Capacity (mL) |
Specimen Tube Type |
Cap Colour |
|---|---|---|---|---|---|---|---|---|
| 2.0mL Light Grey | 131 | Glucose | 6 to 79 | 1.0 | 0.3 | 2.0 | VWR Cryogenic | Blue |
| 6.0mL Lavender | 132 | Homocysteine1 | 6 to 79 | 1.0 | 0.4 | 2.0 | VWR Cryogenic | Orange |
| 133 | Vitamin D | 6 to 79 | 1.0 | 0.5 | 2.0 | VWR Cryogenic | Green | |
| 931 | Stored Plasma 1 | 6 to 79 | 0.5 | N/A | 0.5 | VWR SuperClear | Purple/ White | |
| 10.0mL Lavender2 | 531 | PBDE + Organochlorine Pesticides + Non-Coplanar PCBs |
20 to 79 (fasting) (2500) |
2.7 | 2.2 | 7.0 | Supelco glass vial | Black |
| 532 | Perfluorinated Compounds | 20 to 79 | 1.8 | 1.2 | 2.0 | VWR Cryogenic | Red | |
| 1.8mL Light Blue | 134 | Fibrinogen | 12 to 79 | 0.5 | 0.2 | 2.0 | VWR Cryogenic | Tan |
| 1. Homocysteine sample was aliquotted within 1.5 hrs of collection and put in the in the freezer immediately. 2. Test 531 and 532 are sub-samples so not all respondents were eligible for these tests. |
||||||||
8.5.3 Pooled serum splitting
| Collection Type | Test ID # | Test Name | Age (Years) | Preferred Sample Volume (mL) |
Minimum Sample Volume (mL) |
Specimen Tube Capacity (mL) |
Specimen Tube Type (Size) |
Cap Colour |
|---|---|---|---|---|---|---|---|---|
| Pooled Serum from SST Tubes (30mL bottle) | 151 | Lipid Profile | 6 to 79 (fasting) | 1.0 | 0.5 | 2.0 | VWR Cryogenic | Pink |
| 152 | Insulin | 6 to 79 (fasting) | 0.5 | 0.3 | 2.0 | VWR Cryogenic | Orange | |
| 153 | Chemistry Panel | 6 to 79 | 1.0 | 0.5 | 2.0 | VWR Cryogenic | Blue | |
| 154 | C-Reactive Protein | 6 to 79 | 0.5 | 0.2 | 2.0 | VWR Cryogenic | Blue | |
| 155 | Vitamin B12 | 6 to 79 | 0.7 | 0.4 | 2.0 | VWR Cryogenic | Orange | |
| 351 or 352 |
Hepatitis Panel 1 | 14 to 79 | 1.0 | 0.5 | 3.0 | Fisherbrand | Clear red O-ring |
|
| Hepatitis Panel 2 | 14 to 79 | 2.0 | 0.5 | 3.0 | Fisherbrand | Clear red O-ring | ||
| 951 | Stored Serum 1 | 6 to 79 | 0.5 | NA | 0.5 | VWR SuperClear | Purple Yellow |
|
| 952 | Stored Serum 2 | 6 to 79 | 0.5 | NA | 0.5 | VWR SuperClear | Purple Yellow |
|
| 953 | Stored Serum 3 | 6 to 79 | 0.5 | NA | 0.5 | VWR SuperClear | Purple Yellow |
|
| 954 | Stored Serum 4 | 6 to 79 | 0.5 | NA | 0.5 | VWR SuperClear | Purple Yellow |
|
| 955 | Stored Serum 5 | 12 to 79 | 0.5 | NA | 0.5 | VWR SuperClear | Purple Yellow |
|
| 956 | Stored Serum 6 | 12 to 79 | 0.5 | NA | 0.5 | VWR SuperClear | Purple Yellow |
|
| 957 | Stored Serum 7 | 12 to 79 | 1.0 | NA | 2.0 | VWR Cryogenic | Yellow | |
| 958 | Stored Serum 8 | 12 to 79 | 1.0 | NA | 2.0 | VWR Cryogenic | Yellow | |
| 959 | Stored Serum 9 | 12 to 79 | 1.0 | NA | 2.0 | VWR Cryogenic | Yellow |
8.6 Specimen storage
Specimens will be stored in the mobile clinic lab in either the refrigerator or the freezer, depending on the test, and will be shipped once a week (twice a week for DNA) to the reference labs. All specimens are to be stored as soon as processing is complete.
For more information regarding the laboratory standard operating procedures (SOP) please contact the Canadian Health Measures Survey at 1-888-253-1087 or chms-ecms@statcan.gc.ca.
9. Activity monitor component
Activity monitors, also known as accelerometers, are battery operated pager-sized, electronic devices that are worn on a belt around the waist. These devices record a movement count each minute proportional to the average intensity of motion (i.e., acceleration) over that minute.
9.1 Equipment
- Actical Activity monitor
- Disposable, adjustable belt
9.2 Eligibility
- Respondents aged 6 to 79
9.3 Exclusion criteria
- Persons in a wheelchair
9.4 Administering the activity monitor
-
Respondents who agreed to take part in the activity monitor component were given an activity monitor and an appropriately sized disposable, adjustable belt. If a respondent was not willing to wear an activity monitor, the reason for the refusal was recorded.
-
The health measurement specialist (HMS) showed the respondent how to put the belt on. The activity monitor was then placed securely on the belt. The belt was adjusted so that the activity monitor was positioned over the right hip, with the arrow pointing up. The activity monitor could be worn over or under clothing.
-
The HMS explained that the activity monitor should be put on when the respondent gets up from bed each day and should be worn until the respondent is ready to fall asleep. If the respondent reads or does any other activity before falling asleep, they were to keep wearing the activity monitor. The respondent was instructed to wear the activity monitor for 7 days.
10. References - Canadian Health Measure Survey cycle 1 protocols
- Canadian Society for Exercise Physiology. 2003. Canadian Physical Activity, Fitness and Lifestyle Approach (CPAFLA). 3rd edition. Ottawa.
- Ross, W. D. & M.J. Marfell-Jones. 1991."Kinanthropometry" in Physiological Testing of the High-Performance Athlete. 2nd edition. J. D. MacDougall, H. A. Wenger, & H. J. Green, eds., Human Kinetics Books, Champaign, Illinois, pp. 223-308.
- Fitness Canada. 1986. Canadian Standard Test of Fitness (CSTF) Operations Manual. 3rd edition. Ottawa.
- Statistics Canada. No date. Canadian Health Measures Survey Clinic Questionnaire. 92 p. www.statcan.gc.ca/cgi-bin/imdb/p2SV.pl?Function=getSurvey&SDDS=5071&lang=en&db=imdb&adm=8&dis=2
- Miller M.R., J. Hankinson, V. Brusasco et al. 2005. "Standardization of spirometry." Eur Respir. Vol. 26 p. 319-338.
- Stephens, T. & C.L. Craig. 1985. Fitness and activity measurement in the 1981 Canada Fitness Survey. In: Drury, T. (ed.). 1989. Assessing physical fitness and activity patterns in general population surveys. Department of Health and Human Services, Public Health Service, Center for Disease Control, National Center for Health Statistics. Hyattsville, MD. pub. No. (PHS) 89-1253.
- For a copy of the "Canadian Health Measures Survey 2006-2008, Dentist's Survey Manual and Coding Criteria" please contact the Canadian Health Measures Survey at 1-888-253-1087 or chms-ecms@statcan.gc.ca .
- Campbell, Norm R.C., Joffre Michel R., McKay Donald W. 2005. "Hypertension Surveillance in Canada: Minimum Standards for Assessing Blood Pressure in Surveys." Canadian Journal of Public Health Vol 96, number 3. p. 217 - 220.
Appendix 5 Derived variable documentation
For more information on the derived variable documentation for Wave 1 please see Canadian Health Measures Survey (CHMS) Cycle 1 Wave 1. Derived Variable (DV) Specifications.
For more information on the derived variable documentation for Wave 2 please see Canadian Health Measures Survey (CHMS) Cycle 1 Wave 2. Derived Variable (DV) Specifications.
For more information on the derived variable documentation for Wave 3 please see Canadian Health Measures Survey (CHMS) Cycle 1 Wave 3. Derived Variable (DV) Specifications.
For more information on the derived variable documentation for Wave 4 please see Canadian Health Measures Survey (CHMS) Cycle 1 Wave 4. Derived Variable (DV) Specifications.
For more information on the derived variable documentation for the Supplementary Data Release please see Canadian Health Measures Survey (CHMS) Cycle 1 Supplementary Data Release. Derived Variable (DV) Specifications.
Appendix 6 Questionnaires
For more information on the household or clinic questionnaires please see Questionnaire(s) and reporting guide(s) – Canadian Health Measures Survey (CHMS).