5 The Measurement of Relative Canada/U.S. Total Factor Productivity as of 1929

Archived Content
Information identified as archived is provided for reference, research or recordkeeping purposes. It is not subject to the Government of Canada Web Standards and has not been altered or updated since it was archived. Please "contact us" to request a format other than those available.
Because of the differences in Canadian and U.S. factor intensities, we need to calculate a total factor productivity measure, not a partial labour productivity measure, if we are to draw conclusions about Canadian inefficiency. Canada may well have had lower output per worker because it used less capital, less fuel and less materials per worker. One reason for this could simply have been that Canada was technologically backward, being slow to adopt the most advanced technology. On the other hand, it may have been a response to the different relative factor costs. With lower labour and higher capital costs, Canadian manufacturers might well have been expected to adopt lower capital/labour ratios.
This study adopts for a total factor productivity measure the commonly-used translog index (Allen, Gallop and Jorgenson, 1980). It is written as:
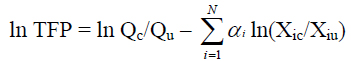
where
Q = output
Xi = input i-capital (K) and labour (L)14
αi = the cost share of input i
C = a subscript referring to Canada
U = a subscript referring to the U.S.
In the case of constant returns to scale,15 equation #2 reduces to:
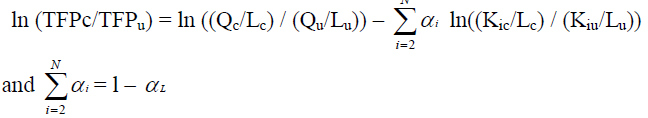
and αi is the output elasticity of labour.
Estimates of αi are derived from the average factor shares of the matched Canadian and U.S. industries.
Reformulation of the TFP index as equation #1 reported earlier serves to emphasize the reason that a TFP index will differ from the average labour productivity index that has been so often used for Canada/U.S. comparisons. Relative labour productivity is equal to relative total factor productivity (the measure of technical efficiency) and a term that is the product of the average share of GDP going to capital multiplied by the relative capital/labour ratios of the two countries.
If all relative factor input ratios are equal, the second term on the right hand side of #1 vanishes and the total factor productivity measure is just the relative output per worker measure.
Dales (1966, p. 98) had previously concluded that gross output per worker in Canada was only 70 to 80% that of American output per worker between 1926 and 1933. For our sample of 130 matched U.S. industries in 1929, the median of the relative output per worker fell in this range at 77%. As indicated above, the median for relative materials per worker was 77%, for relative horsepower, 78% and for relative fuel consumption, 76%. It is clear that Canada was relatively labour intensive in general and that a total factor productivity measure will be higher than a partial labour productivity measure.
Productivity indices can be calculated using either total production or value-added (production less some inputs such as materials and/or fuel). The latter was a popular choice for production function estimation and for productivity studies for a considerable time, partially because materials were regarded as being a fixed proportion of output and partially because early econometric techniques had difficulty in rejecting this assumption. Sims (1969) outlined the assumptions necessary for the use of a value-added function as opposed to total output. But the conditions that are necessary for estimating a value-added function have been questioned by Denny and May, 1977. Moreover, the use of value-added as an output measure in productivity studies may fail to catch important differences in material usage. This is particularly important in Canada/U.S. studies since Canadian materials input usage is generally higher than in the United States. This study sidesteps the theoretical issues and uses both output measures.
The inputs used are labour (total employment of salaried workers, wage earners, piece-workers and working proprietors), capital, fuel and materials. The total factor productivity variant that uses gross sales or output employs all these inputs. The value-added measures exclude materials or materials and fuel. The measurement of capital in productivity studies always provides difficult conceptual and empirical problems. More recent studies have available fixed capital stock estimates that are built up from investment flows; or book value measures based on annual reports. Work by Baldwin and Gorecki (1986) suggest that, at least when it comes to relative empirical estimates of Canada/U.S. capital stock, there is little to choose between the two approaches. In this study, we do not have either of these two dollar measures for individual industries in 1929. But relative horsepower and relative fuel purchased do exist. Both are used alternately as proxies for relative capital stocks. Conceptually, these relatives should be good proxies because of their relationship to motive power and therefore at least to capital invested in machinery and equipment. Corroborative evidence from attempts to estimate a capital stock using dollar values of investment suggests the horsepower proxy is accurate.16
Table 6 presents the median estimates of the various productivity measures (the Canadian level is expressed as a % of the U.S. level) that were calculated along with definitions of each measure.17 Two (RTVP and RVA) are partial labour productivity measures. Three (TFP1, TFP2 and TFP3) are total factor productivity measures based on gross output value. Three (TFP4, TFP5, TFP6) are total factor productivity measures based on different measures of value-added. The estimates are calculated for 127 matched Canadian/U.S. manufacturing industries in 1929.18TFP1 separates all factors and uses horsepower as a proxy for capital. TFP2 and TFP3 combine fuel and materials; and TFP3 uses fuel while TFP2 uses horsepower as a proxy for capital. TFP6 defines value-added net of materials only and considers labour, fuel and capital as inputs. TFP4 and TFP5 define value-added net of both materials and fuel; the first uses horsepower as a proxy for capital; the second uses fuel expenditures as the proxy for capital since it sometimes argued that this is a good alternate proxy for capital (Globerman, Reis, and Vertinsky, 1994). While our preferred measures are TFP1 and TFP6, we report the others to show how robust the results are to slight variations in the definitions.
The first column of Table 6 contains the productivity measures that make no correction for different Canada/U.S. prices. While the median of the partial labour productivity measures using total output (RTVP) and value-added (RVA) is only 77% and 81% respectively, the total factor productivity measures using gross output are around 97%, the value-added measures are about 94%.19 For the sample as a whole, it makes little difference whether horsepower or fuel is used as a proxy for capital, whether fuel is included as a separate factor or added in with raw materials.20 Finally, it should be noted that differences across Canada and the United States in definitions of the variables used biases our estimates of relative Canada/U.S. total factor productivity downwards, thereby indicating there was even less of a difference in the two countries than these estimates suggest.21
The productivity estimates reported in column 1 of Table 6 may be biased if Canadian and U.S. prices differed. In order to correct for price differences, we first calculated relative output prices for the products produced in each matched Canada/U.S. industry. Two relative output price indices were then calculated and applied to Canadian/U.S. value of output series.22 The first used Canadian quantities as weights; the second used U.S. quantities as weights. By applying these indices only to output, the resulting total factor productivity measures based on gross output will be biased downwards to the extent materials prices were also higher in Canada than the United States. When Canadian quantity weights are used, the total factor productivity measure now has a lower median ranging from about 92% for the total output variant TFP1 to 91% for the value-added variant TFP6 (column II of Table 6). When U.S. weights are used, the result is about the same (column III).
The median estimates of total factor productivity presented in Table 6 could conceal undue concentration of Canadian production in sectors where inefficiency existed. Therefore weighted means of TFP1 were calculated.23 The weights chosen are Canadian and U.S. value of production. For the TFP1 estimate that makes no correction for relative prices, the weighted mean is 96% using Canadian value of production and 97% using U.S. value of production as weights. The comparable median estimate from Table 6 was 97%. For the TFP1 estimate that uses relative output prices based on Canadian quantity weights to derive the price index, the weighted mean is 94% using Canadian value of production and 92% using U.S. value of production as weights versus the comparable median estimate in Table 6 of 92%. The median and the weighted means yield essentially the same result.
Because the use of output prices alone for deflation has been challenged in the literature, two additional deflation methods were used to test the robustness of our conclusion. For a 51 industry subset of the 137 industry matched set, relative input prices could be calculated. These input prices were used to recalculate the gross output productivity measures by deflating relative materials costs and to re-estimate the value-added total productivity measures by using the double-deflation method. These results are presented in Table 7. The first column reports the median of the estimates that make no correction for relative prices for the sub-sample where input prices were available. The second column contains the estimates that also take into account differences in relative input prices.24 The differences between the various uncorrected and price– corrected estimates are sufficiently small to suggest that taking into account input price differentials does not affect the conclusion that inefficiency in the Canadian manufacturing sector was much smaller than has traditionally been suggested. For our purposes then, we can treat the original estimates that make no correction for prices as representative of the overall difference in efficiency between the Canadian and U.S. manufacturing sectors.
As a final check on our result, we made use of the dual formulation to derive an index of relative inefficiency using relative prices and relative costs. Following suggestions by Sims (1966), Arrow (1974) and Diewert (1976), a divisia index of relative input prices was used where the input prices were weighted by their factor's respective share of value added. The wage rate was calculated from total wages and salaries. Capital cost was calculated as the quasi-rent accruing to capital (value added minus total wage and salaries divided by horsepower). The relative input price was that used previously. The divisia index (I) is:
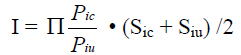
where
Pic = the Canadian input price of factor i
Piu = the U.S. input price of factor i
Sic = the Canadian share of factor i in value-added25
Siu = the U.S. share of factor i in value-added.
24. We also had relative fuel prices for a subset of our matched industries. Canadian fuel and electricity prices were about 7% higher than American. When we correct for relative fuel prices, no significant change occurs— because the relative fuel price is close to the relative materials price and the share of fuel is quite small.
25. The materials share is calculated from expenditures on materials and fuel. When fuel prices are used as a separate index, no significant change occurs.
The inefficiency measure TFP7 is then calculated as:
ln (TFP7) = ln (Pc/Pu) – ln(I)
where
Pc = Canadian product price
Pu = U.S. product price.
This method yields a median estimate of inefficiency of 104.8%—almost exactly that of the dual approach based on quantities rather than prices reported for the same sub-sample in Table 7. This alternative approach does not change the observation that Canadian industry as a whole showed little inefficiency.
14. While it has become more common in the growth literature to make use of capital and labour services, we employ simple measures of capital stock and employment for reasons related to data availability.
15. If there are economies of scale and the measure in #2 is built up from micro-production functions, the right hand side would have an additional term (-s ln RELSIZE) where s is the degree of scale economies (s=1 when there are constant returns to scale, positive when there are increasing scale economies, negative when there are decreasing returns) and RELSIZE is the ratio of average Canadian to U.S. plant size. (See Baldwin and Gorecki, 1986 for derivation of this result).
16. See the data appendix for a discussion of this proxy. Horsepower was defined as the sum of horsepower in waterwheels, water turbines, steam turbines, internal-combustion engines and electric motors using rented power, what is called primary horsepower.
17. We excluded hand trades and miscellaneous industries (i.e. miscellaneous food, vegetables, textiles, wood, nonferrous metals, non-metallics and chemicals) from these estimates.
18. Rather than arbitrarily remove estimates we felt were subject to measurement error, we chose to report the median rather than the mean estimate to remove the effect of outliers.
19. That the measures differ depending upon whether gross output or value-added is used should not be interpreted to mean one is biased and the other is correct. They are measured at different levels of the production process and should be expected to differ because of this. For example, if both countries employed exactly the same inputs but Canada produced 4% less gross output and value-added was 50% of gross output, then the percentage deficiency in value-added would be 8%. A 4% deficiency at the level of gross output is equivalent to an 8% deficiency at the level of value added.
20. We also experimented with total horsepower—primary plus electric motors using internally-generated power. The results were so similar they are not reported.
21. Allowing for economies of scale would further reduce the TFP difference between Canada and the United States.
22. A discussion of the price indices is included in the data appendix.
23. For these estimates, we omitted the top and bottom 5% of our sample to reduce the effect of measurement error.
- Date modified: