
Shelters for abused women in Canada, 2010

Archived Content
Information identified as archived is provided for reference, research or recordkeeping purposes. It is not subject to the Government of Canada Web Standards and has not been altered or updated since it was archived. Please "contact us" to request a format other than those available.
By Marta Burczycka and Adam Cotter
Data on annual admissions to shelters are under revision due to incorrect reporting by a survey respondent. Revised data will be released when available.
- Shelters for abused women increase in recent years
- Transition homes and second-stage housing increase more than other types of shelters
- Bed space growing as high-capacity shelters increase
- Overall admissions remain stable in 2009/2010
- Re-admissions to shelters highest in Manitoba
- Full-capacity most common reason for turning women away
- Most women seek shelter for reasons of abuse or housing
- Abuse by current partners prevalent among women residing in shelters
- Few women in shelters report the abuse to police
- Types of services offered at shelters changed little in 2009/2010
- Shelters serving Aboriginal populations
- Summary
- Data source and methodology
- Detailed data tables
- References
- Notes
Canadian federal, provincial and territorial governments continue to develop a range of policy initiatives aimed at addressing family violence and spousal abuse (Department of Justice Canada 2011). Among those designed to help victims of abuse, initiatives that focus on shelter and housing are especially important. According to a recent study, emergency shelter and related housing assistance are among the most frequently accessed type of victims' services in Canada (Sauvé 2009).
Using data collected by the 2010 Transition Home Survey (THS), this Juristat article analyses information on residential facilities in Canada, particularly those that offer shelter to abused women. It presents information on the different types of facilities, the number of annual admissions, the reasons women seek shelter and the variety of services offered to clients. In addition, this article examines the use of shelters offering culturally sensitive services to Aboriginal people, including those living on reserve and in the territories.
The information presented in this article refers to two distinct time periods. First, data pertaining to the characteristics of facilities, the number of annual admissions, the types of services offered and financial information were collected in 2010 and are based upon the 12-month period that preceded the survey.1 Second, information was collected on the women being served in shelters on the specific "snapshot date" of April 15, 2010.
Shelters for abused women increase in recent years
On April 15, 2010, there were 593 shelters for abused women operating across Canada (Table 1). This was an increase of 24 shelters since 2008 (up 4%), the last time the survey was conducted, and 40 shelters since 2006 (up 7%).
Since 2008, the number of shelters in operation increased or remained stable in all provinces and territories for which data is available. The largest increase was reported in Nova Scotia, where the number of facilities increased by 2 since 2008 (up 13%).
Transition homes and second-stage housing increase more than other types of shelters
In Canada, there are several types of shelters available to women leaving abusive situations (Text box 1). While the overall number of shelters in Canada has increased, the growth among the different types of shelters has varied. With 22 more shelters in 2010 than in 2008, transition homes increased the most and continued to be the most common type of shelter for abused women in 2010 (Chart 1). Other increases in 2010 were noted in the number of second-stage housing facilities (up 11 shelters or 11%) and women's emergency shelters (up 6 shelters or 9%).
Chart 1
Number of shelters by type of facility, Canada, 2006, 2008 and 2010
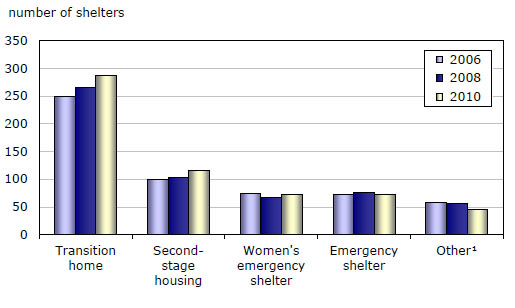
1. 'Other' includes all other facilities not otherwise classified, such as Rural Family Violence Prevention Centres (Alberta), Interim Housing (Manitoba), and other types of emergency shelters.
Source: Statistics Canada, Canadian Centre for Justice Statistics, Transition Home Survey.
Text box 1
Types of residential facilities for abused women
For the purposes of the Transition Home Survey (THS), the term 'shelter' is used broadly to refer to all residential facilities for abused women. In addition, the following generic categories were developed to further define the various types of shelters. Referring to these definitions, those responding to the THS were asked to select the facility type that best described their shelter.
Transition home/shelter: Facility offering short- or moderate-term (1 day to 11 weeks) secure housing for abused women with or without children. This type of shelter may also be referred to as first-stage emergency housing.
Second-stage housing: Facility offering long-term (3 to 12 months) secure housing with support and referral services designed to assist women while they search for permanent housing.
Women's emergency centre/shelter: Facility offering short-term (1 to 21 days) respite for women and their dependent children.
Emergency shelter: Facility offering short-term (1 to 3 days) respite for a wide population range, not exclusively abused women. Some facilities may provide accommodation for men as well as women. This type of facility may accommodate residents who are not associated with family abuse but are without a home due to an emergency situation (e.g., eviction for non-payment of rent).
Safe home network: A network of private homes in rural or remote areas where there is no full-fledged operating shelter. It offers subsidiary short-term (1 to 3 days) emergency housing for women.
Other: Includes all other residential facilities offering services to abused women with or without children, not otherwise classified. This category includes rural family violence prevention centres in Alberta, interim housing in Manitoba, family resource centres in Ontario, and other types of emergency shelters such as YWCAs. Note that these services may not be exclusive to abused women.
End of text box 1.
The shelter types that have increased in number over the past decade tend to rely less on funding from provincial and territorial governments. While all shelters receive some funding from provincial and territorial governments, the proportion of income received from these sources varies by shelter type. For example, transition homes receive 81% of their funding from provincial and territorial governments. Meanwhile, women's emergency shelters (71%), emergency shelters (62%) and second-stage housing (37%) receive less of their funding from the provinces and territories. These shelter types rely more on municipal governments, charitable donations and user fees for their revenues.
Bed space growing as high-capacity shelters increase
Not only has the number of shelters in Canada increased over the past several years, so too has the number of beds available to clients. In 2010, the total number of beds available was 11,461 (Table 2).2 This represented an increase of 757 beds or 7% from two years earlier, and an increase of 936 beds or 9% from 2006. This growth in bed availability is driven by the increase in high-capacity facilities that offer a higher average number of beds. Second-stage housing facilities, for example, provide an average of 22 beds per shelter, while transition homes offer 15 beds per shelter.
On April 15, 2010, the majority of beds in shelters for women were occupied. Among those facilities that admit women exclusively, almost three-quarters (74%) of funded and licensed beds were occupied (Text box 2), a proportion that showed little variation among transition homes, women's emergency shelters and second-stage housing.
Text box 2
Measuring shelter occupancy
The availability of spaces within shelters can be measured through the concept of bed space. Facilities responding to the THS provide a count of the funded or licensed beds they have for clients (whether or not a bed is currently occupied). Respondents are asked to exclude unfunded and unlicensed emergency beds, such as cots or sofas. The total number of beds available presented here may therefore undercount the total number of beds that shelters are prepared to provide to clients, if those shelters choose to offer unfunded or unlicensed beds.
Occupancy rates for women-only shelters showed some variation across the country in 2010. Among the provinces, shelters in Newfoundland and Labrador reported the highest occupancy rate (93%), while Manitoba, New Brunswick and Nova Scotia reported the lowest (55%). Among the territories, Northwest Territories (91%) and Nunavut (99%) reported high occupancy rates, while the rate in Yukon (28%) was comparatively low.
| Province or territory | Women-only facilities | Beds | Women and children residents1 | Occupancy rate |
|---|---|---|---|---|
| number | percent | |||
| Newfoundland and Labrador | 13 | 161 | 150 | 93 |
| Prince Edward Island | 4 | 54 | 37 | 69 |
| Nova Scotia | 18 | 304 | 168 | 55 |
| New Brunswick | 22 | 294 | 163 | 55 |
| Quebec | 120 | 1,844 | 1,388 | 75 |
| Ontario | 157 | 3,581 | 3,085 | 86 |
| Manitoba | 26 | 539 | 296 | 55 |
| Saskatchewan | 25 | 480 | 359 | 75 |
| Alberta | 43 | 1,134 | 702 | 62 |
| British Columbia | 101 | 1,370 | 869 | 63 |
| Yukon | 5 | 67 | 19 | 28 |
| Northwest Territories | 6 | 64 | 58 | 91 |
| Nunavut | 6 | 69 | 68 | 99 |
| Canada | 546 | 9,961 | 7,362 | 74 |
|
1. In order to accurately present occupancy rates, the presence of child residents is used in this calculation. Source: Statistics Canada, Canadian Centre for Justice Statistics, Transition Home Survey. |
||||
End of text box 2.
Overall admissions remain stable in 2009/2010
Annual admissions to shelters remained stable in 2009/2010, continuing the pattern evident over the past several years. Between April 1, 2009 and March 31, 2010 there were about 64,500 admissions of women to shelters across Canada (Table 3), representing a rate of 452 admissions per 100,000 women.3 The rate of admissions was up 2% from 2007/2008.
The rate of admissions tends to be higher in the territories and the western provinces than in the eastern part of the country. In Yukon, the Northwest Territories and Nunavut, the rate of admissions in 2009/2010 were six to eight times higher than in Manitoba, the province with the highest rate (670 admissions per 100,000 women). The lowest rate of admission among the provinces was recorded in Newfoundland and Labrador (260 admissions per 100,000 women). As admission rates can vary according to shelter capacity, differences among provinces may be influenced by the number of high-capacity shelters in operation.
Along with information on annual admissions, shelters were asked to provide a count of the women in residence at their facility on April 15, 2010. In total, there were 4,645 women staying at shelters across Canada on that day (Table 4). The majority were staying at transition homes (36%), emergency shelters (21%), second-stage housing (20%) and women's emergency shelters (15%). The remaining 7% of women were staying in other types of shelters such as Family Resource Centres and Interim Housing.
Text box 3
Admissions of men
The Transition Home Survey (THS) collects a limited amount of information about the admission of adult males to shelters. Among the 593 shelters that offered services to abused women in 2009/2010, 47 or 8% also admitted adult men, usually to emergency shelters or safe home networks. Among males admitted in 2009/2010, 3% were admitted because of spousal violence and another 4% sought shelter because of another type of abuse. Information provided by shelters indicates that some of these situations involved elderly or disabled men who had experienced abuse by a caretaker or family member. Information on other reasons for admission is not available from the THS.
End of text box 3.
Text box 4
Admissions of children
Most shelters in Canada allow children to be admitted with their mothers. On April 15, 2010, almost three-quarters (74%) of women with parental responsibilities brought their children into the shelter with them. On average, these women were admitted with 2 children. Most of the 3,611 children admitted on snapshot day were in shelters because either they or their mothers had been abused (85%).
Many shelters offer services specifically for child residents. Among services geared towards children, recreational services were most frequently provided, offered by about three-quarters of shelters.
| Type of service | percent |
|---|---|
| Outdoor recreation spaces | 78 |
| Indoor recreation spaces | 75 |
| Individual counselling | 65 |
| Programs for child witnesses or victims of abuse (e.g. play therapy) | 54 |
| Group counselling | 51 |
| Culturally sensitive services for ethno-cultural and visible minority children | 48 |
| Culturally sensitive services for Aboriginal children | 48 |
| Baby-sitting services | 47 |
| Child protection or family services | 22 |
| School classes or tutoring | 18 |
| Supervised visiting for non-resident parent | 8 |
| Temporary placement of children without parents | 2 |
| Other1 | 15 |
|
1. Examples of other services include school lunch programs, transportation to and from school, and other services. Source: Statistics Canada, Canadian Centre for Justice Statistics, Transition Home Survey. |
|
End of text box 4.
Re-admissions to shelters highest in Manitoba
Of the women staying in facilities on April 15th, 2010 many had sought shelter there more than once before (Table 5). Almost one-third (31%) of women had at least one previous stay at the shelter, up from 25% recorded on the 2008 snapshot day. Women's emergency shelters reported the highest proportion of clients who had been at the facility before (43%), higher than the proportions for emergency shelters (36%), transition homes (33%), and second-stage housing (27%).
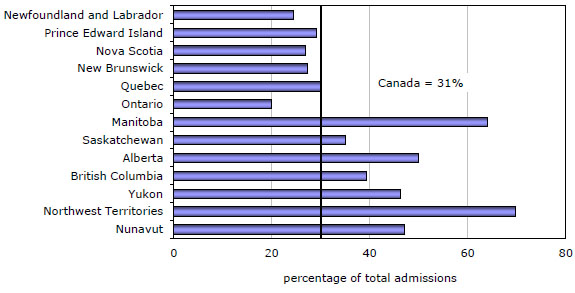
Among the provinces, shelters in Manitoba reported the highest proportion of re-admissions on snapshot day. Almost two-thirds (64%) of women residing in Manitoba's shelters were repeat clients, more than double the proportion for Canada as a whole (31%) (Chart 2). The lowest proportions of re-admissions were reported in Ontario (20%) and Newfoundland and Labrador (24%).
Chart 2
Re-admissions to shelters, by province and territory, April 15, 2010
Source: Statistics Canada, Canadian Centre for Justice Statistics, Transition Home Survey.
Full-capacity most common reason for turning women away
In addition to admissions and re-admissions, shelters were asked to provide a count of how many women were turned away from their facility on April 15th, 2010. In total, 426 women were turned away from facilities that day.
As in previous years, the most common reason for not providing admission to a client was that the shelter was full, accounting for half (50%) of all reasons for turn-aways. The presence of mental health issues as well as the use of drugs and/or alcohol were other frequently reported reasons for refusing admission, at 10% and 8%, respectively.
Most women seek shelter for reasons of abuse or housing
Most, but not all, women staying in shelters on April 15, 2010 were there because of abuse.4 Of the 4,645 women in shelters on that date, 71% reported abuse as their reason for seeking refuge. The majority of women reported emotional abuse (66%) and physical abuse (53%), while relatively large proportions reported threats (40%), financial abuse (39%), harassment (28%) and sexual abuse (25%) (Table 6).5 In addition to seeking safety for themselves, the desire to protect their children from suffering or witnessing abuse was a leading motivation for women to seek shelter. For example, nearly one-quarter (24%) of abused women in shelters reported that wanting to protect their children from psychological abuse was among their reasons for admission.
Other reasons that motivated women to stay at shelters included the inability to find affordable housing (30%), issues related to mental health (23%) and drug and alcohol dependency (19%). On average, each woman reported five different reasons for seeking admission to a shelter.
On snapshot day, transition homes, second-stage housing and women's emergency shelters reported the highest proportions of women staying for reasons of abuse (Chart 3). In contrast, emergency shelters and other shelter types (for example, safe home networks, Ontario's Family Resource Centres) reported larger proportions of women staying for reasons other than abuse.Chart 3
Women staying at selected shelter types for reasons of abuse, Canada, April 15, 2010
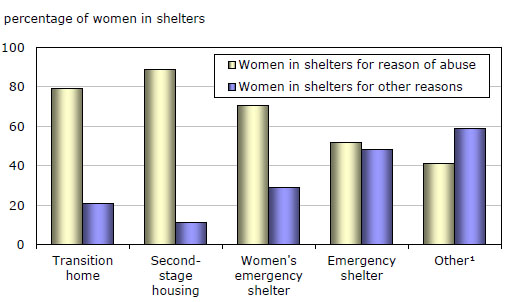
1. Includes all other facilities not otherwise classified, such as Rural Family Violence Prevention Centres (Alberta), Interim Housing (Manitoba), and other types of emergency shelters.
Source: Statistics Canada, Canadian Centre for Justice Statistics, Transition Home Survey.
Abuse by current partners prevalent among women residing in shelters
Among abused women, those experiencing abuse by a current spouse or common-law partner continued to be the most frequent residents of shelters (Chart 4). Of the women reporting abuse among their motivations for seeking shelter, most indicated that their abuser was either a current common-law partner (42%) or spouse (25%). Former common-law partners or spouses were less frequently cited as abusers at 8% and 6%, respectively. The remainder of abused women (19%) reported abuse from other types of relationships, such as dating partners, caregivers or non-spousal family members.
Chart 4
Relationship to abuser among women residing in shelters, Canada, April 15, 2010
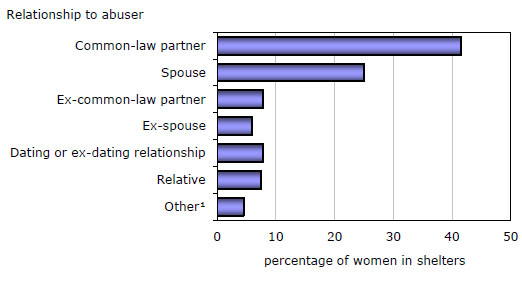
1. Includes caregiver, friend/acquaintance, authority figure, and other unspecified relationships.
Source: Statistics Canada, Canadian Centre for Justice Statistics, Transition Home Survey.
In most areas of the country, the rates of women seeking shelter from a current or former spouse or common-law partner were close to the national rate (25 women per 100,000 married, common-law and separated or divorced women) (Table 7). The exceptions to this were in the territories, particularly Nunavut, where the rates were substantially higher.
The highest rate of women residing in shelters for reasons of abuse was among those aged 25 to 34 (Chart 5). After age 34, the presence of abused women in shelters decreased steadily with age. This distribution mirrors the rates of self-reported spousal violence in Canada, which tend to be highest among those aged 25 to 34 and to decline as individuals grow older (Brennan 2011).
Chart 5
Abused women in shelters, by age group, Canada, April 15, 2010
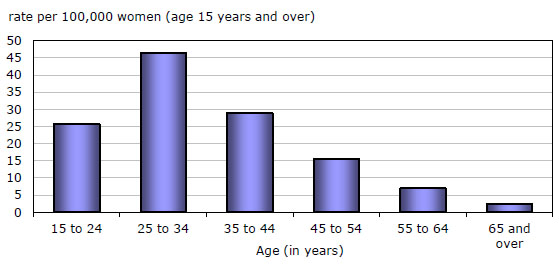
Note: Rates are based upon July 1st population estimates of women aged 15 years and over. Different methodologies for the calculation of rates may have been used in the past; thus, comparisons to previous reports should be made with caution.
Source: Statistics Canada, Canadian Centre for Justice Statistics, Transition Home Survey.
Few women in shelters report the abuse to police
Respondents reported that for most abused women (6 in 10) residing in shelters on April 15, 2010, the incident which brought them there was not reported to police. Similarly, respondents reported that 27% of the incidents that brought women into shelters resulted in formal charges being laid, and 26% resulted in the imposition of a restraining order or similar undertaking against the abuser.
Types of services offered at shelters changed little in 2010
Shelter types can differ both in the durations of stay they can offer clients and in the types of services they have available. Though a wide range of services is usually available at most shelters, some variation exists, particularly for those shelters offering short-term stays (less than one week) compared with those offering stays of longer duration (one month or more) (Table 8). For example, individual long-term counselling is more frequently offered by second-stage housing facilities (available at 57% of facilities) than by emergency shelters (available at 30% of facilities).
The provision of services offered by the same shelters has changed little over time. The availability of the most common types of services, namely, safety and protection planning and advocacy on behalf of women (each available at 92% of shelters) did not change in 2010. Similarly, no change was noted in the availability of the less common services (e.g. job training and family counselling, available at 30% and 20% of facilities, respectively).Shelters serving Aboriginal populations
The issue of victimization among Canada's Aboriginal population has been the focus of many recent studies (Perreault 2011; Scrim 2010). According to a recent report, Aboriginal women were close to three times as likely to report being victims of spousal violence than were non-Aboriginal women (Brennan 2011).
Though the THS does not collect information on the Aboriginal identity of women staying at shelters, it does ask respondents to indicate whether or not their facility is located on a reserve, whether or not their facility serves an on-reserve population, and whether or not their facility offers services sensitive to the needs of an Aboriginal clientele.
On April 15, 2010 the largest proportion of on-reserve shelters were emergency shelters (26%), followed by transition homes and women's emergency shelters (23% each). In total, there were 39 shelters admitting abused women located on reserves in six provinces: Nova Scotia, Quebec, Ontario, Manitoba, Alberta and British Columbia. Of these, Alberta and Nova Scotia had the highest proportion of shelters operating on reserves (18% and 17%, respectively).
Many shelters not located on a reserve reported serving an on-reserve population on the snapshot day. Across Canada, 25% or 146 shelters served clients residing on reserves. More specifically, about one-fifth (20%) of all transition homes reported serving on reserve clients, while one-third (32%) of all emergency-type shelters (emergency shelters and women's emergency shelters) reported serving these populations. Among the provinces, Manitoba had the highest proportion of shelters that reported serving reserves (48%), while Prince Edward Island did not report any such shelters. These two provinces also had the highest and lowest proportions of those who self-identified as an Aboriginal person (Bisson et al. 2010).
Transition homes and other shelters sometimes offer services that recognize and accommodate the distinct needs of Aboriginal women. Examples of services sensitive to the needs of Aboriginal women include those designed around traditional healing and mediation practices, or the presence of counsellors with knowledge of Aboriginal languages and customs. Of those shelters that reported serving an on-reserve Aboriginal population, 79% reported offering culturally sensitive services. Of the shelters that did not report serving a reserve area, 59% offered culturally sensitive services for Aboriginal clients.
Summary
The number of shelters for abused women has continued to increase in recent years, resulting in an increase in the number of beds available. Though transition homes continue to be the most common type of shelter offering services to abused women, the number of second-stage housing facilities and women's emergency shelters has also increased.
In 2009/2010, about 64,500 admissions of women were reported by shelters across Canada, a slight increase from the previous year. Abuse remained the primary motivation for women seeking admission to shelters, though lack of housing and other reasons were also reported relatively frequently. Among those women in shelters for reasons of abuse, the majority have been victimized by a current common-law partner or spouse, and most had not reported the incident to police.
Data source and methodology
The Transition Home Survey (THS) was developed under the federal government's Family Violence Initiative in consultation with provincial and territorial governments and transition home associations. Since 1993, the objectives of the survey have been to collect information on the characteristics of all residential services for abused women and their children during the previous 12 months of operation. In addition, the THS collects information on selected characteristics for the women residing in these shelters on a specified 'snapshot' day.
Included in the scope of the THS are shelters that serve a population broader than abused women, such as shelters admitting men as well as women and shelters admitting people for reasons other than abuse. Facilities that exclusively serve males and shelters that do not provide residential services are not included in the THS. The scope of the THS is limited to those facilities that come to the attention of Statistics Canada through its consultations with provincial and territorial governments and transition home and other associations.
Of the 593 residential facilities providing services to abused women and their children, 518 returned their questionnaires for a response rate of 87%. For those respondents who did not provide their information through the questionnaire, and for those respondents who did not answer some of the key questions on their survey forms, an imputation procedure was used to estimate the missing data.
Detailed data tables
Table 1 Number of shelters, beds and admissions of women, Canada, provinces and territories, 2010
Table 5 Frequency of women's shelter stays, by type of shelter, Canada, April 15, 2010
Table 6 Reasons women seek shelter, Canada, April 15, 2010
Table 8 Services offered by selected type of shelter, Canada, 2010
References
Bisson, Andrew, Carrie Hall, Shirley Li and Ida Trachtenberg. 2010. Aboriginal Statistics at a Glance. Statistics Canada Catalogue no. 89-645-XWE.
(accessed March 30, 2011).
Brennan, Shannon. 2011. "Self-reported spousal violence, 2009." Family Violence in Canada: A Statistical Profile, 2009. Statistics Canada Catalogue no. 85-224-XWE.
(accessed February 18, 2011).
Brennan, Shannon. 2011. "Violent victimization of Aboriginal women in the Canadian provinces, 2009." Juristat. Statistics Canada Catalogue no. 85-002-XWE.
(accessed May 17, 2011).
Department of Justice Canada. 2011. Federal Victims Strategy Evaluation: Final Report. Ottawa, Ontario.
(accessed February 18, 2011).
Perreault, Samuel. 2011. "Violent victimization of Aboriginal people in the Canadian provinces, 2009." Juristat, Vol. 30, no.4. Statistics Canada Catalogue no. 85-002-XWE.
(accessed March 30, 2011).
Sauvé, Julie. 2009. "Victim services in Canada, 2007/2008." Juristat. Vol. 29, no. 4. Statistics Canada Catalogue no. 85-002-X.
(accessed February 18, 2011).
Scrim, Katie. 2010. "Aboriginal victimization in Canada: A summary of the literature." Victims of Crime Research Digest.No. 3.
(accessed February 18, 2011).
Notes
- Shelters were asked to provide 12 months of data corresponding to a standard fiscal year (April 1, 2009 to March 31, 2010), a calendar year, or a 12 month period of their own choosing. In 2009/2010, 82% of shelters responding to the survey reported their annual information based on a standard fiscal year.
- Rates of admissions are calculated on the basis of July 1 population estimates of women aged 15 years and over. Rates of admissions for those who reported spousal abuse are calculated on the basis July 1 population estimates of women aged 15 and over who are married, living in common-law relationships, or are separated or divorced. Different methodologies for the calculation of rates may have been used in the past; thus, comparisons to previous reports should be made with caution.
- About 7 in 10 admissions were for reasons of abuse. In addition, the total number of admissions of women includes women who may have been admitted more than once. Each shelter visit is counted as a separate admission. Not all facilities reported fiscal year admissions data to the Transition Home Survey (THS). The THS is designed to collect information pertaining to residential services for abused women. Though a minority of the facilities responding to the THS offer services to men as well as to women, the focus of this article is on the female clients of shelters. For more information on shelters admitting men, please refer to Text Box 3, "Admissions of men". Many shelters also admit women along with their children. For more information on the admission of children, see Text Box 4, "Admissions of children".
- While the Transition Home Survey (THS) is designed to collect information pertaining to residential services for abused women, shelters responding to the survey may admit women for reasons other than abuse.
- Categories are not mutually exclusive. Respondents were asked to indicate as many reasons for admission as applied in the case of each woman admitted. Therefore, totals do not add to 100%.
- Date modified: