
Police-reported clearance rates in Canada, 2010

Archived Content
Information identified as archived is provided for reference, research or recordkeeping purposes. It is not subject to the Government of Canada Web Standards and has not been altered or updated since it was archived. Please "contact us" to request a format other than those available.
By Tina Hotton Mahony and John Turner
Corrections have been made to this product.
The publication has been reloaded on June 5, 2013.
Please take note of the following change(s):
Note to readers
Due to incorrect reporting by a police service of incidents of child pornography from 2008 to 2011, the data originally contained in this report have been suppressed and revised data were made available on July 25, 2013 with the release of 2012 crime statistics.
We regret any inconvenience this may have caused.
- Clearance rates are steadily increasing
- Violent crimes solved more frequently than property crimes
- Homicide clearance rates declining
- Highest clearance rates reported in the territories and Saskatchewan
- Clearance rates vary across the country
- Clearance rates are higher in smaller communities
- Citizen-based measurement of police performance
- Most Canadians generally satisfied with their personal safety
- Most Canadians satisfied with their local police service
- Summary
- Data Sources
- Detailed data tables
- References
- Notes
Police agencies provide a range of important services to the public, including responding to emergencies, building relationships with local communities, reducing crime and promoting public safety. However, the investigation of criminal offences leading to the identification and apprehension of offenders remains one of the primary functions of police (Paré et al. 2007). The effectiveness of police in performing this function is primarily measured through the clearance rate.
Previous research suggests that the likelihood that a criminal incident is cleared, or solved, by police may be influenced by a number of factors, including the type of offence being investigated, characteristics of the incident, police workload, the size and organizational structure of the local police service, as well as the characteristics of the communities they serve (Paré et al. 2007, Ouimet and Paré 2003).
Investigating and solving crime is one of the primary responsibilities of police services. Deterrence is one of the fundamental principles of law, premised on the idea that if offenders can avoid detection, they may be more likely to commit crime (Apel and Nagin 2011). For this reason, clearance rates have been used as one of many possible ways to measure police performance. Further, clearance rates have often been used by police services, as well as government, when assessing the resource needs of law enforcement (McCormick et al. 2012, Hollins 2007).
However, clearance rates are only one measure of police effectiveness, one which cannot capture the full range of service delivery functions undertaken by police service agencies (Paré et al. 2007, Ouimet and Paré 2003). Other commonly used measures of police performance include: level of crime in the community, offences per officer, response times, budget variance, population per officer (OMBI 2011), citizen satisfaction with local police services and public feelings of safety and security (Swindell and Kelly 2000).
This Juristat examines the options available to police for clearing an incident, clearance rates by type of offence, trends over time, as well as variation in clearance rates across the provinces and territories and police services.
Text box 1
What is a clearance rate?
The clearance rate represents the proportion of criminal incidents solved by the police. Police can clear an incident by charge or by means other than the laying of a charge. For an incident to be cleared by charge, at least one accused must have been identified and either a charge has been laid, or recommended to be laid, against this individual in connection with the incident. For an incident to be cleared otherwise, an accused must be identified and there must be sufficient evidenceNote 1 to lay a charge in connection with the incident, but the accused is processed by other means for one of many reasons.
The most common reasons for clearing an incident by other means include: departmental discretion, the complainant declines to press charges, referral to a diversion program or departmental policy. For example, several of the provisions of the Youth Criminal Justice Act (YCJA) encourage police to consider alternatives to charging youth, such as issuing warnings, cautions or referrals to community programs or extrajudicial sanctions programs.
Less common reasons for clearing an incident by other means include: death of the accused, complainant or witness, committal of the accused to a mental hospital, the accused has diplomatic immunity or is in a foreign country and cannot be returned, the accused is less than 12 years of age, the accused is involved in other incidents or was already sentenced for another offence, the incident was cleared by a lesser statute or by another municipal, provincial or federal agency.
To calculate a clearance rate, the number of incidents that have been "solved" by police is divided by the number of incidents reported to, and substantiated by, police and multiplied by 100. As an example, if a police service reported 200 criminal incidents, 80 of which were cleared by charge, 20 of which were cleared by other means and 100 of which were unsolved, then their clearance rate would be: (80 + 20) / 200 * 100 = 50%.
What is a weighted clearance rate?
Total clearance rates share the same limitation as total crime rates in that overall totals are dominated by high-volume, less-serious offences such as minor thefts, mischief and minor assaults. Many of these less-serious offences which drive the overall clearance rate are often difficult to solve. For example, by the time an incident of graffiti/mischief to property is reported to police, the accused may no longer be present at the crime scene, nor will there likely be any witnesses. In the calculation of the overall clearance rate, all offences are counted equally: the clearance of one mischief incident by police counts the same as the solving of one homicide incident.
To address this limitation, a "weighted" clearance rate was developed, similar to the concept used in the Crime Severity Index. The weighted clearance rate assigns values to crimes according to their seriousness, with more serious crimes being given a higher statistical "weight". For example, the clearing of a homicide, robbery or break-in would represent a greater contribution to the overall weighted clearance rate value than the clearing of a minor theft, mischief or disturbing the peace. The severity of an offence is determined using average sentences handed down by Canadian criminal courts. The more serious the average sentence for an offence, the higher the weight and, in turn, the greater impact on the overall clearance rate.
Unlike the Crime Severity Index, which is indexed to a base year of 100, the weighted clearance rate is expressed as a percentage as is the case for the traditional unweighted clearance rate. It should be noted that, on average, overall weighted clearance rates are slightly lower than overall clearance rates. This is due to the fact that certain serious, relatively high-volume offences such as robbery and break-ins have lower-than-average clearance rates compared with other violent and non-violent crimes.
In this report, the weighted clearance rate is used in most sections, except when examining historical data prior to 1998 (the first year that the weighted clearance rate is available) and when looking at individual offences.
End of text box 1.
Clearance rates are steadily increasing
Police weighted clearance rates have been steadily increasing over the past seven years, from 33.5% in 2003 to 39.4% in 2010 (Chart 1). This time period coincides with decreasing crime rates as well as increasing police strength.
Chart 1
Police-reported weighted clearance rates, Canada, 2000 to 2010

Source: Statistics Canada, Canadian Centre for Justice Statistics, Uniform Crime Reporting Survey.
Virtually all provinces and territories have reported increases in their weighted clearance rate since 2003 (Table 1). The only exception is Newfoundland and Labrador, where the rate has dropped from 37.1% in 2003 to 34.3% in 2010.
In Canada, both the proportion of incidents cleared by charge and the proportion of incidents cleared by means other than the laying of a charge have increased since 2003 (Table 2).
There are a number of factors that may account for changes in the clearance rate over the last decade, including changes in the distribution of crime types as well as in how police services record and count clearances (McCormick et al. 2012, Sakiyama et al. 2010). For example, improvements in the recording of the use of extrajudicial measures in the Uniform Crime Reporting (UCR) survey by some police services after the implementation of the YCJA in 2003 may account for some increases observed among young offenders (Carrington and Schulenberg 2005).
Violent crimes solved more frequently than property crimes
In general, police solve violent crimes much more frequently than they do property crimes. Crimes that involve direct confrontation between the victim and offender are more likely to be cleared because the victim often serves as a witness to help to identify the offender (Paré et al. 2007, Ouimet and Paré 2003). The likelihood that an incident is cleared also varies by the severity of the incident. Serious crimes such as homicide often have specialized units with additional investigative resources.
The level of difficulty in solving violent crime has also been attributed to the type of relationship between the victim and the offender. Previous research suggests that crimes committed by strangers are more difficult to solve than those involving family members or known acquaintances (Paré et al. 2007, Trussler 2010).
In 2010, clearance rates were three times higher for violent crimes (72%) than for property crimes (24%) (Table 3). The increase in overall clearance rates in recent years was seen for both violent and property crimes.
Almost one-half (46%) of violent crimes were cleared by charge and one-quarter (27%) were cleared by other means. In contrast, property crimes were equally likely to be cleared by charge (12%) as to be cleared by other means (12%). The fact that violent crimes are cleared less frequently by other means is to be expected as diversion away from the formal criminal justice system is generally reserved for less serious offences (Carrington and Schulenberg 2005).
Clearance rates are much higher for some crimes than others (Chart 2).Note 2 Among violent crimes, clearance rates ranged from 40% for robbery to 95% for assaults against a peace officer in 2010. Three-quarters of homicides were cleared by police, similar to that for attempted murders, assaults and criminal harassment incidents. The proportion of sexual assaults cleared by police in 2010 was slightly lower, at 64%.
Chart 2
Clearance rate, by selected offence, Canada, 2010

Source: Statistics Canada, Canadian Centre for Justice Statistics, Uniform Crime Reporting Survey.
As mentioned, clearance rates for property crimes were much lower. For example, approximately 1 in 6 break-ins (17%) and 1 in 7 motor vehicle thefts (14%) were cleared by police in 2010. One of the many challenges police officers face when investigating property crime is the lack of witnesses and the timeframe from occurrence to detection.
Homicide clearance rates declining
This section examines clearance rates from the national Homicide Survey, which has collected detailed data on homicide incidents, including clearances, since 1961. This survey is continuously updated with new clearance information, which makes it a more accurate reflection of clearance rates than the UCR survey, which is only revised back one year.Note 3
Although homicide clearance rates have increased in recent years, there has been a noticeable decline over the past 50 years. Homicide clearance rates have dropped to about 75% from around 95% in the mid-1960s (Chart 3). By comparison, the homicide rate peaked in the mid-1970s and has generally been declining since. Some of this drop may be due to the changing nature of the characteristics of homicide incidents. For example, gang-related homicides, which are generally more difficult to solve, increased sharply between 1993 and 2008.
Chart 3
Percentage of homicides cleared by police services, Canada, 1961 to 2010
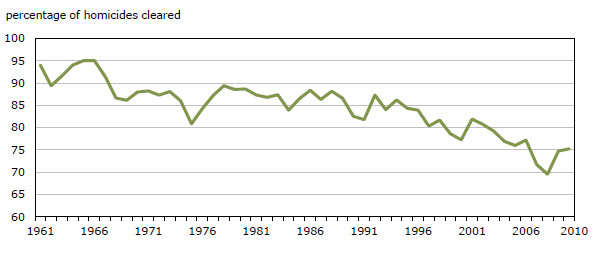
Note: Clearance rates for homicide are slightly lower in the UCR than the Homicide Survey. This is due to the fact that the Homicide Survey continues to receive updates whereas the UCR data are frozen after one year (see Data source section).
Source: Statistics Canada, Canadian Centre for Justice Statistics, Homicide Survey.
The probability of clearing a homicide in Canada may be attributed in part to incident characteristics, with homicides involving firearms, gangs or the drug-trade having a lower probability of being cleared than other types of homicide (Trussler 2010; Dauvergne and Li 2006). For example, between 2000 and 2010, 42% of gang-related homicides were cleared by police, less than half the proportion solved of non-gang related incidents (88%). Similarly, homicides committed with a firearm (56%) were less likely to be cleared by police than non-firearm-related homicides (88%).
Homicides involving female victims were more likely than homicides of male victims to be solved by police (87% versus 72%), as were homicides against children and youth compared to homicides of adults (87% versus 75%). Homicides may be easier to solve when the offenders are family members or otherwise well-known to the victims (Dauvergne and Li 2006, Regoeczi et al. 2000), which is more often the case among female and child victims. Females were also much less likely to be victims of gang-related homicide than males, with females accounting for fewer than 1 in 10 victims of gang-related homicide in 2010 (Hotton Mahony 2011).
Text box 2
Comparing police service clearance rates
Police services may use very different criteria in making the decision as to whether there is sufficient evidence to charge an accused person. Many factors can affect this decision, including internal policies and practices around the recording of minor crimes and differences in reporting technologies.
For example, some police services have adopted telephone and on-line reporting mechanisms intended to increase the ease by which residents can bring criminal incidents to the attention of police. Higher rates of reporting in some jurisdictions may result in an increase in minor offences, that are more difficult to solve, being reported.
Some of the variation in clearance rates may also be attributable to important administrative differences in the way local agencies record and count clearances as well as local resources (McCormick et al. 2012; Hollins 2007).
There are also jurisdictional policies that may directly or indirectly influence clearance rates. For example, provincial policies in New Brunswick, Quebec and British Columbia require screening of police documentation by the Crown Attorney's office prior to laying charges. Although the information reported to the UCR should reflect the recommendations of police prior to Crown screening, knowledge of the higher evidentiary requirementsNote 4 required by prosecutors to proceed with charges may be taken into consideration by police in these jurisdictions (McCormick et al. 2012).
Previous research also suggests that clearance rates should be used cautiously to assess the performance of police departments because they do not take into account case characteristics (Paré et al. 2007). Clearance rates are sensitive to the severity and distribution of crime in the area. Jurisdictions with a higher relative proportion of "easier to solve crimes" such as offences involving known acquaintances and family members will clear more crime than jurisdictions with a lower proportion of these types of offences (Paré et al. 2007, Ouimet and Paré 2003). Targeted enforcement strategies will also impact individual police service clearance rates and, as priorities may be different across communities, clearance rates differ for certain types of offences.
For all the reasons listed above, comparisons of clearance rates among provinces/territories and police services should be done with caution.
End of text box 2.
Highest clearance rates reported in the territories and Saskatchewan
In 2010, police-reported weighted clearance rates were notably higher in the territories than in the provinces (Chart 4). Although all three territories reported slightly below-average cleared by charge rates, they were well above average in clearances by other means (Table 4).
Among the provinces, the weighted clearance rate was highest in Saskatchewan (50.3%) and New Brunswick (45.4%). Saskatchewan also reported the most police officers per 100,000 population as well as the highest Crime Severity Index. The lowest weighted clearance rates were found in British Columbia (29.6%) and Newfoundland and Labrador (34.3%). While British Columbia's clearance rates have been consistently lower than other provinces for many years, research to date has been inconclusive as to determining the reasons behind this pattern.
Chart 4
Police-reported weighted clearance rate, by province and territory, 2010
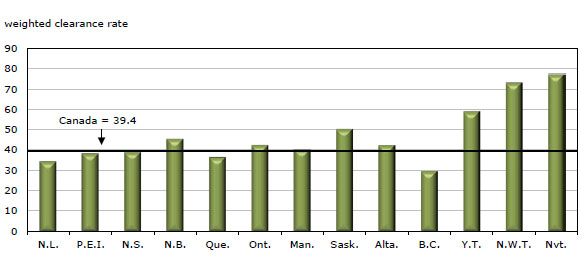
Source: Statistics Canada, Canadian Centre for Justice Statistics, Uniform Crime Reporting Survey.
Clearance rates vary across the country
Clearance rates vary considerably across police services (Table 5). Examining 30 police services serving the largest communities in each province, weighted clearance rates ranged from over 45% in Durham Regional, Codiac Regional, London, York Regional and Saint John to under 30% in Surrey, St. John's, Vancouver and Winnipeg.
Table 6 compares clearance rates for six offences for the same 30 police services. For homicide, Peel Regional and London Police were the only police services (reporting at least 5 homicides in 2010) to have solved all of their homicides. For serious assaults (levels 2 and 3), clearance rates were highest at over 85% in Durham Regional, Laval and Peel Regional Police.
For sexual assaults, clearance rates were highest at over 80% in Laval and Codiac Regional Police, while for robberies, two police services in Atlantic Canada (Saint John and Charlottetown) reported clearance rates of over 70%, well above other police services.
For Canada, charges were laid or recommended by police in about two-thirds (63%) of all solved violent incidents. However, this ratio varied by police service. In particular, Charlottetown and St. John Police both cleared more violent crimes by means other than the laying of a charge than they did by charge.
Examining non-violent crimes, clearance rates for break-ins were highest in London and Ottawa Police at over 30%. For motor vehicle thefts, clearance rates were highest in London and Charlottetown Police at over 34%.
Clearance rates are higher in smaller communities
In 2010, weighted clearance rates were higher among police departments serving smaller populations than those serving larger populations, and this was the case for both violent and property crime. The weighted clearance rate for jurisdictions serving communities between 1,000 and 5,000 residents was 53.1% (Table 7). The weighted clearance rate dropped as the community size increased until reaching 34.8% for the between 250,000 to 500,000 population group. However, the weighted clearance rate did increase slightly to 37.6% for communities over 500,000.
Citizen-based measurement of police performance
It has been stated that the use of clearance rates as a singular measure of police effectiveness fails to capture the range of service delivery functions undertaken by police service agencies (Paré et al. 2007, Ouimet and Paré 2003). As additional measures of police performance, some have suggested citizen-focused measures of success (Swindell and Kelly 2000). These include citizen satisfaction with local police services and public feelings of safety and security, among others.Note 5
Most Canadians generally satisfied with their personal safety
According to data from the General Social Survey (GSS) on Victimization, most Canadians reported feeling satisfied with their personal safety from crime. In 2009, more than 9 in 10 (93%) Canadians reported feeling satisfied with their personal safety, similar to the rate reported in 2004 (94%) (Brennan 2011).
However, levels of satisfaction do vary somewhat across the country. For example, residents living in eastern Canada generally expressed higher levels of satisfaction than those in the western part of the country, which may be attributed in part to higher rates of crime and victimization found in the western provinces (Brennan 2011).
Most Canadians satisfied with their local police service
Respondents to the GSS were also asked to rate their local police services along six dimensions: enforcing laws, responding promptly to calls, being approachable, supplying information on reducing crime, ensuring the safety of citizens, and treating people fairly. In 2009, the survey found that most Canadians generally have positive perceptions of the police in their communities, particularly on measures of approachability and ensuring the safety of citizens.
More than one-half of Canadians provided a positive assessment of the police on all six dimensions (Table 8). The items relating to being approachable and ensuring the safety of citizens (65% and 63% respectively) had the highest proportion of positive response. Fifty-nine percent indicated their local police were doing a good job enforcing the laws and 58% felt police were doing a good job of treating people fairly. A slightly lower proportion (53%) thought the police were doing a good job responding promptly to calls and supplying information on reducing crime (50%).
Perceptions of police differ by province and territory. Compared to the provincial average, residents of western Canada were somewhat less likely to report that local police are doing a good job across all six dimensions, while residents of Atlantic Canada reported above-average satisfaction ratings with their police.
Summary
Canadian police services act on behalf of the government and society to undertake a variety of important tasks, including crime prevention, maintaining the peace, responding to emergencies, detecting crime and enforcing laws, assisting victims of crime, community support and outreach, as well as providing assistance in prosecuting offenders. There are many measures of police performance, of which clearance rates are but one.
This report shows that overall clearance rates have been steadily increasing since 2003, although clearance rates for homicide have generally been declining since the mid-1960s. Clearance rates vary by type of crime. Generally, violent crimes have much higher clearance rates than property crimes.
Clearance rates also vary across the country. The highest clearance rates in 2010 were reported in Saskatchewan and New Brunswick, while the lowest were reported in British Columbia and Newfoundland and Labrador. Also, clearance rates were generally found to be higher in smaller communities than in larger communities.
The latest victimization survey for 2009 data shows that most Canadians generally have positive perceptions of the police in their communities, as well as overall satisfaction with their personal safety from crime.
Data Sources
Homicide Survey
The Homicide Survey has been collecting police-reported data on the characteristics of all homicide incidents, victims and accused persons in Canada since 1961. Whenever a homicide becomes known to police, the investigating police service completes a survey questionnaire, which is then sent to Statistics Canada. Accused characteristics are updated as homicide cases are solved and new information is submitted to the Homicide Survey. For incidents involving more than one accused, only the relationship between the victim and the closest accused is recorded.
The Uniform Crime Reporting (UCR) Survey
The Uniform Crime Reporting (UCR) Survey was established in 1962 with the co-operation and assistance of the Canadian Association of Chiefs of Police. The survey is a compilation of police-reported crimes that have been substantiated through investigation from all federal, provincial and municipal police services in Canada. Coverage of the incident-based version of the survey stands at 99% of the total caseload for all police services in Canada.
In the UCR survey, one incident can involve multiple offences. Counts presented in this article are based upon the most serious offence in the incident in order to allow for enhanced comparability among police services.
Each year, UCR data are "frozen" at the end of May for the production of crime statistics for the preceding calendar year. However, police services continue to send updated data to Statistics Canada after this date for incidents that occurred in previous years. Generally, these revisions constitute new accused records, as incidents are solved and accused persons are identified by police.
Revisions are accepted for a one-year period after the data are initially released. For example, when the 2010 crime statistics are released, the 2009 data are updated with any revisions that have been made between May 2010 and May 2011. The data are revised only once and are then permanently frozen.
The General Social Survey (GSS) on Victimization
In 2009, Statistics Canada conducted the victimization cycle of the General Social Survey for the fifth time. Previous cycles were conducted in 1988, 1993, 1999 and 2004. The objectives of the survey are to: provide estimates of Canadians' personal victimization experiences for eight offence types, examine risk factors associated with victimization, examine reporting rates to police, measure fear of crime and examine public perceptions of crime and the criminal justice system.
The target population included all persons 15 years and older in the 10 Canadian provinces, excluding full-time residents of institutions. The sample in 2009 was approximately 19,500 households. The survey was also conducted in the three Canadian territories using a different sampling design (Perreault and Hotton Mahony 2012). As such, comparisons between provincial and territorial findings should be made with caution.
Respondents in the sample are weighted so that their responses represent the non-institutionalized Canadian population aged 15 years or over in the ten provinces. Each person who responded to the 2009 GSS represented roughly 1,400 people in the Canadian population aged 15 years and over.
As with any household survey, there are some data limitations. The results are based on a sample and are therefore subject to sampling error. This Juristat uses the coefficient of variation (CV) as a measure of the sampling error. Where descriptive statistics and cross-tabular analysis were used, statistically significant differences were determined using 95% confidence intervals. Using the 2009 GSS sample design and sample size, an estimate of a given proportion of the total population, expressed as a percentage is expected to be within 0.95 percentage points of the true proportion 19 times out of 20.
For more information on the sampling design, data collection methodology and response rates please refer to Statistics Canada's website, section "Definitions, data sources and methods".
Detailed data tables
Table 1 Police-reported weighted clearance rate, by province and territory, 2000 to 2010
Table 2 Police-reported detailed clearance rates, Canada, 2000 to 2010
Table 3 Police-reported clearance rates for selected offences, Canada, 2010
Table 4 Police-reported detailed clearance rates, by province and territory, 2010
Table 6 Police-reported clearance rates for selected offences, selected police services, 2010
Table 7 Police-reported weighted clearance rates by size of population policed, Canada, 2010
Table 8 Perceptions of the criminal justice system, by province, 2009
References
Alberta Justice: Government of Alberta. 2008. Crown Prosecutor`s Policy Manual.
(accessed January 3, 2012).
Apel. R. and D.S. Nagin. 2011. "General deterrence: A review of recent evidence in Crime and Public Policy." Edited by J.Q. Wilson and J. Petersilia. Oxford University Press: New York. 2nd edition. pp. 411-436.
Brennan, S. 2011."Canadians' perceptions of personal safety and crime, 2009." Juristat. Statistics Canada Catalogue no. 85-002-XIE. (accessed January 2, 2012).
British Columbia: Criminal Justice Branch, Ministry of Attorney General. 2005. Crown Counsel Policy Manual. (accessed January 3, 2012).
Canadian Centre for Justice Statistics (CCJS) Policing Services Program. 2010. Uniform Crime Reporting Incident-Based Survey Manual. Ottawa: Statistics Canada.
Carrington, P. and J. Schulenberg. 2005. The Impact of the Youth Criminal Justice Act on Police Charging Practices with Young Persons: A Preliminary Statistical Assessment. Report to the Department of Justice Canada. (accessed January 3, 2012).
Dauvergne, M. and G. Li. 2006. "Homicide in Canada, 2005". Juristat. Vol. 26, no. 6. Statistics Canada Catalogue no. 85-002-X.
(accessed January 2, 2012).
Her Majesty's Government. 2009. PSA Delivery Agreement 24: Deliver a More Effective, Transparent and Responsive Criminal Justice System for Victims and the Public.
(accessed January 2, 2012).
Hollins, D. 2007. Strategies for Clearance Rate Improvement in "E Division RCMP". Royal Canadian Mounted Police, Operations Strategy Branch.
Hotton Mahony, T. 2011. "Homicide in Canada, 2010." Juristat. Statistics Canada Catalogue no. 85-002-X. (accessed January 2, 2012).
McCormick, A.V., T. Haarhoff, I.M. Cohen, D. Plecas and K. Burk. 2012. Challenges Associated with Interpreting and Using Police Clearance Rates. University of the Fraser Valley, School of Criminology and Criminal Justice. (accessed January 11, 2012).
Nova Scotia: Public Prosecution Service. 2011. The Decision to Prosecute (Charge Screening). (accessed January 3, 2012).
Ontario Municipal Benchmarking Initiative (OMBI). 2011. 2010 Performance Benchmarking Report. (accessed February 21, 2012).
Ouimet M. and P.P. Paré. 2003. "Modéliser la performance : comment analyser les statistiques policières d'élucidation et d'accusation." Revue Internationale de Criminologie et de Police Technique et Scientifique. Vol. 56: 23-42.
Paré, P.P., R.B. Felson and M. Ouimet. 2007. "Community variation in crime clearance: A multilevel analysis with comments on assessing police performance." Journal of Quantitative Criminology. Vol. 23.
Perreault, S. and T. Hotton Mahony. 2012. "Criminal victimization in the territories, 2009." Juristat. Statistics Canada Catalogue no. 85-002-X. (accessed January 2, 2012).
Regoeczi, W. C., L.W. Kennedy and R.A. Silverman. 2000. "Uncleared Homicides - a Canada/United States Comparison." Homicide Studies. Vol. 4(2):135-161.
Sakiyama, M., T. Miethe and T. Hart. 2010. Clearance rates in Nevada, 1998-2009. Center for the Analysis of Crime Statistics catalogue no. CACS 2010-01-02EN.
Swindell, D., and J.M. Kelly. 2000. "Linking citizen satisfaction data to performance measures: a preliminary evaluation." Public Performance and Management Review. Vol. 24 (1):30-52.
Trussler, T. 2010. "Explaining the changing nature of homicide clearance in Canada." International Criminal Justice Review. Vol. 20(4).
Notes
- According to the UCR Reference Manual (2010) "this evidence must pass the reasonable person test, meaning: confirmation from a reliable source, police information, admission of guilt, physical evidence or other substantiation which would allow for the police service to proceed with a charge. Police may believe an individual is responsible for other incidents, but must have reasonable grounds to proceed and not simply a belief that the accused is responsible".
- UCR data represents crimes that are reported by police service agencies to the Canadian Centre for Justice Statistics. Police agencies may differ in terms of how they apply the UCR guidelines for recording crimes and clearance statistics (McCormick et al. 2012, Hollins 2007). Consequently, the ranking of crimes should be viewed with caution.
- Ongoing updating of records is possible in the Homicide survey due to the relatively low number of incidents as compared to the UCR survey, which has millions of incidents each year.
- For example, Crown Counsel in British Columbia must follow a two-part evidentiary test in their charge assessment. According to the Crown policy manual (British Columbia Criminal Justice Branch 2005), Crown Counsel must "fairly, independently, and objectively examine the available evidence in order to determine: whether there is a substantial likelihood of conviction" (i.e., Crown Counsel is satisfied there is a strong solid case of substance to present to the Court); "and if so, whether a prosecution is required in the public interest". In provinces and territories without prosecutorial screening, whether reasonable grounds exist to lay a charge is made independently by police, without assessment of the evidence by a prosecutor (for example, see Alberta Justice 2008 and Nova Scotia Public Prosecution Service 2011.
- In the United Kingdom, for example, a five-part performance evaluation framework was developed that includes the measurement of public confidence in the fairness and effectiveness of the criminal justice system (CJS) as well as the overall satisfaction of victims and witnesses in their treatment by the CJS (Her Majesty's Government 2009).
- Date modified: