
Criminal victimization in the territories, 2009

Archived Content
Information identified as archived is provided for reference, research or recordkeeping purposes. It is not subject to the Government of Canada Web Standards and has not been altered or updated since it was archived. Please "contact us" to request a format other than those available.
By Samuel Perreault and Tina Hotton Mahony
- Assault most common crime reported in the territories
- Profile of violent incidents and their victims
- Spousal violence
- Profile of household incidents and their victims
- Reporting victimizations to police
- Assistance from formal and informal support systems
- Perceptions of personal safety and neighbourhood crime
- Perceptions of the criminal justice system
- Summary
- Detailed data tables
- Data source
- References
- Notes
The territories account for more than one-third of Canada's total area, spanning the mainland north of the 60th parallel and west of Hudson Bay, as well as the arctic islands. The territories differ from one another in many important respects, including their socio-demographic composition, local languages, cultures and economies (Statistics Canada 2008; Martel and Caron-Malenfant 2007; de Léséleuc and Brzozowski 2006). However, the territories share a number of challenges, including crime rates that are generally higher than in the rest of Canada (Brennan and Dauvergne 2011; Charron et al. 2010; de Léséleuc and Brzozowski 2006).
According to police-reported statistics, rates of violent and property crime tend to be higher on average in the three territories and the western provinces than in the eastern part of the country (Brennan and Dauvergne 2011). However, police-based statistics are limited to those incidents that come to the attention of legal authorities, leaving an important gap in our knowledge of unreported crime. Self-reported victimization surveys have been used to help address this gap by providing some understanding of the number and types of crimes, including those that may not have been reported to police.
In recent years, important gains have been made in the collection of self-reported victimization data in the territories. In 2004, a pilot test was conducted to expand the General Social Survey (GSS) on Victimization to include a sample of the population in Yukon, Northwest Territories and Nunavut. However, data collection in the territories presents its challenges (see Data source section) which, in 2004 resulted in the sample being representative of approximately 60% of the population in the territories. When Statistics Canada administered the next cycle of the GSS on Victimization in 2009, personal interviews were conducted to supplement the standard telephone interviews in the territories.Note 1 Still, collection resulted in lower than expected response rates in Nunavut. It should be noted that collection in Nunavut was limited to the 10 largest communities. As such, data for Nunavut is representative of Nunavut's 10 largest communities only and should be interpreted with caution.
Drawing on the 2009 GSS data, this Juristat article presents information on self-reported incidents of criminal victimization, including spousal violence, in the three territories.Note 2, Note 3 Specifically, it examines the socio-demographic and economic characteristics of those who have been victimized, whether they choose to report these incidents to police, and the use of victims' services. The perceptions of crime and personal safety among residents of the territories are also examined.
Assault most common crime reported in the territories
The GSS measures the extent and nature of eight different types of crime (see Text box 1). In particular, the GSS collects data on three types of violent crimes (sexual assault, robbery and assault), four types of crimes targeting households (break and enter, motor vehicle theft, theft of household property and vandalism) as well as theft of personal property. Overall, about one-third (34%) of residents of the territories aged 15 and over reported at least one criminal incident in the previous 12 months.
In the provinces, both self-reported (Perreault and Brennan 2010) and police-reported data (Brennan and Dauvergne 2011) show that the vast majority of crimes in 2009 were non-violent in nature. The picture drawn from self-reported data in the territories, however, is slightly different. These data show that nearly half (46%) of all self-reported incidents in the territories in 2009 were violent,Note 4 with assault being the most common. Close to 17,700 violent incidents were reported, of which about 8,300 were assaults committed by someone other than a spouse or partner and 3,600Note E: Use with caution were assaults committed by a spouse or partner (current or former). The remaining violent incidents were sexual assaults or robberies (Table 1).
Although crimes that target households may not always be considered as serious as violent crimes, their consequences can be extensive and affect all members of a household (Perreault and Brennan 2010). In 2009, about 13,400 crimes against households were reported in the territories. Among all household crimes, theft of household property was the most common, with nearly 5,400 incidents, or 40% of self-reported household incidents (Table 1). This was followed by vandalism (25%), break and enter (24%) and theft of motor vehicles or their parts (10%Note E: Use with caution).
Text box 1
Measuring and defining criminal victimization in the territories
Criminal victimization data in Canada are collected via the General Social Survey on Victimization, a sample survey that is representative of the non-institutionalized population aged 15 years or over. In 2009, the GSS on Victimization included both a provincial and a territorial component. While the questions were generally the same, the sampling and collection methods used for each component were slightly different. As such, provincial and territorial findings should be compared with caution. For the purpose of this report, general trends were compared but no direct comparisons with numbers were made.
For similar reasons, data for the territories from the 2004 and 2009 cycles of the GSS should not be directly compared (see section on Data source for further information). Also, compared to the provinces, the 2009 sample and response rate in the territories were relatively small. As such, it was not always possible to provide the same level of detail as for the provinces.
One of the major benefits of the GSS is that it captures information on criminal incidents that do not necessarily come to the attention of police. Research has shown that, for a variety of reasons, people may choose not to disclose their victimization experiences to formal authorities (Perreault and Brennan 2010; Mihorean et al. 2001). At the same time, it is important to note that the GSS relies upon the willingness of respondents to report incidents and to recall events accurately, and that these incidents may not have been substantiated by the police.
Information collected by the GSS reflects Canadians' personal victimization experiences of the following eight offences:
| Type of victimization | Description |
|---|---|
| Violent victimization | |
| Sexual assault | Forced sexual activity, an attempt at forced sexual activity, or unwanted sexual touching, grabbing, kissing, or fondling. |
| Robbery | Theft or attempted theft in which the perpetrator had a weapon or there was violence or the threat of violence against the victim. |
| Physical assault | An attack (victim hit, slapped, grabbed, knocked down, or beaten), a face-to-face threat of physical harm, or an incident with a weapon present. |
| Non-violent victimization | |
| Household victimization | |
| Break and enter | Illegal entry or attempted entry into a residence or other building on the victim's property. |
| Motor vehicle/parts theft | Theft or attempted theft of a car, truck, van, motorcycle, moped or other vehicle or part of a motor vehicle. |
| Theft of household property | Theft or attempted theft of household property such as liquor, bicycles, electronic equipment, tools or appliances. |
| Vandalism | Wilful damage of personal or household property. |
| Theft of personal property | Theft or attempted theft of personal property such as money, credit cards, clothing, jewellery, a purse or a wallet (unlike robbery, the perpetrator does not confront the victim). |
End of text box 1.
Rates of victimization similar across the three territories
The extent of victimization can also be expressed as rates, which reflect the number of incidents per 1,000 population (or households). Rates are calculated by dividing the number of incidents that occurred in the 12 months preceding the survey by the total population (or number of households) and multiplying by 1,000. The main advantage of rates is that they take into account situations where a person has been victimized more than once and they allow comparisons to be made between different regions, time periods or sub-groups that have different population sizes.
Rates of violent victimization and household victimization as measured by the GSS were generally similar across the three territories. There was also little variation in the rates of victimization between the capital cities of the three territories (Yellowknife, Whitehorse and Iqaluit) and other areas within the territories (Table 2). For household victimization, however, the rate was slightly higher outside the capital cities (424 incidents per 1,000 households compared to 343 in the three capitals). This was particularly true for break and enters, with a rate of 133 incidents per 1,000 households, compared to 91 for the territories overall.
Profile of violent incidents and their victims
A vast body of research has documented that individuals are not at equal risk of being the victim of a violent crime. A number of factors have been found to be associated with the risk of criminal victimization, including socio-demographic and lifestyle characteristics of the victim as well as the characteristics of the neighbourhood where they reside (Perreault and Brennan 2010; Mihorean et al. 2001).
Violent victimization higher among single people and low-income residents
Overall, the rate of non-spousal violence, namely, violence that is committed by someone other than a current or former spouse or partner, was 190 incidents per 1,000 population for the three territories. According to findings from the 2009 GSS, while the risk of non-spousal violent victimization in the territories was similar for men (201Note E: Use with caution) and women (178Note E: Use with caution), it was higher among those whose marital status was single as well as among those with lower household incomes (Table 3).
More specifically, the rate of victimization among those who were single was 341Note E: Use with caution per 1,000 population, more than three times higher than those who were married or living in a common-law relationship. Additionally, residents of the territories whose annual household income was less than $30,000 had a victimization rate of 522Note E: Use with caution per 1,000 population, more than three times higher than people who reported earning more than $30,000 (Table 3).
Previous research has also found victimization rates to be higher among Aboriginal people than non-Aboriginal people (Perreault 2011; Brennan 2011). This was also true in the territories, where the violent victimization rate among Aboriginal people (252) was higher than among non-Aboriginal people (145Note E: Use with caution) (Table 3).Note 5
Victims report the involvement of alcohol or drugs in most violent incidents
How and where people spend their time can also impact the risk of victimization. For example, previous studies have shown the highest violent victimization rates to be among people who frequently go out at night, use drugs, or consume five or more alcoholic drinks in one sitting (Perreault and Brennan 2010, Mihorean et al. 2001).
According to self-reported information from victims of violent crimes in the territories, more than three-quarters of incidents (78%) were said to be related to alcohol or drug use by the perpetrator (Table 4). This proportion was slightly higher among male victims (89%).Note 6
In addition, alcohol or drug use by victims was found to be a risk factor of violent victimization in the territories. The rate of violent victimization among residents of the territories who drank five or more drinks in one sitting on at least four occasions in the previous month (414Note E: Use with caution) was almost four times higher than the rate for those who had not done so (106Note E: Use with caution). The situation was similar for those who said they had used drugs (regularly or occasionally), with rates of violent victimization four times higher than those who had not used drugs (461Note E: Use with caution and 112 respectively) (Table 3).
Another factor previously found to be associated with higher rates of violent victimization is participation in evening activities outside the home (Perreault and Brennan 2010). This finding held true in the territories, where the rate of violent victimization among those who reported at least 45 evening activities per month was more than double what it was among those who reported less than 20 such activities (334 and 138Note E: Use with caution respectively) (Table 3). This was particularly true for those who, as part of their evening activities, reported going to bars at least once a week. These people reported being victimized at a rate of 335Note E: Use with caution incidents per 1,000, compared with 169Note E: Use with caution for those who said they went to bars less than once a week.Note 7
Victimization lower among people who report a strong sense of belonging to their neighbourhood
GSS respondents were asked a series of questions about their sense of belonging to their community. A strong sense of belonging can, among other things, reflect a high level of social cohesion in the neighbourhood which, in turn, can help to prevent crime (Savoie et al. 2006; Jacob 2006; Sampson and Raudenbush 2004; Morenoff et al. 2001). As well, residents of the territories were asked to indicate whether they perceived certain issues (e.g. noisy neighbours, vandalism) to be a problem in their neighbourhood.
Residents of the territories who said they had a strong sense of belonging to their local community were about three times less likely than those who said their sense of belonging was weak to report having been violently victimized (387Note E: Use with caution versus 135 per 1,000 population). In addition, the violent victimization rate among those who felt they could trust their neighbours "a lot" was about three times lower than the rate for those who felt they could more or less trust people in their neighbourhood (89Note E: Use with caution versus 321Note E: Use with caution per 1,000 population) (Table 5).
On the other hand, residents of the territories who felt that there were problems associated with alcohol and drug use in their neighbourhood were more likely to report having been the victim of a violent crime. More precisely, the violent victimization rate for those who reported people being drunk or rowdy in public as a problem was four times higher than the rate for those who did not perceive such problems in their neighbourhood (400Note E: Use with caution compared with 94Note E: Use with caution per 1,000). Similarly, the violent victimization rate was 346Note E: Use with caution per 1,000 for those who perceived problems related to people using or selling drugs in their neighbourhood, nearly three times higher than the rate for those who did not believe this issue was a big problem (Table 5).
The violent victimization rate was also higher among those who reported problems with noisy neighbours and loud parties (487Note E: Use with caution), people hanging around on the streets (470Note E: Use with caution) and vandalism (336Note E: Use with caution). In comparison, the violent victimization rate among those who did not perceive such problems in their neighbourhood was 161 per 1,000 population or lower (Table 5).
Most violent incidents do not involve weapons and do not result in physical injuries
The severity of violence can be measured in a number of different ways, including the presence of weapons, whether the victim suffered physical injuries and/or required medical attention, as well as short- and long-term emotional and psychological effects.
According to the 2009 GSS results for the territories, a weapon was present in close to one-quarter (24%Note E: Use with caution) of all violent incidents, and more than one-third (36%) of violent incidents resulted in physical injuries (Table 4). Although most violent incidents did not result in physical injuries, most victims (73%) reported having experienced emotional or psychological effects as a result of the incident. Anger was the most common consequence of a violent victimization, having been reported in 35% of such incidents.
Victims of violence generally know their perpetrator
Many studies associate the overall fear of crime with a fear of being assaulted by a stranger (Scott 2003; Janhevich 1998; Lewis and Salem 1986). However, both self-reported and police-reported data have consistently shown that most victims know their perpetrator (Hotton Mahony 2011; Perreault and Brennan 2010; Dauvergne 2010; Janhevich 1998). According to the 2009 GSS results, the same pattern was observed in the territories, with two-thirds (66%Note E: Use with caution) of victims of non-spousal violent crime having known their perpetrator in some way (e.g. friend, acquaintance, family member) (Table 4).
Text box 2
Police-reported crime in the territories
A complementary source of information on crime in Canada can be drawn from police-reported data as collected by the Uniform Crime Reporting (UCR) Survey. The UCR Survey is an annual census of all Criminal Code incidents that have come to the attention of, and have been substantiated by, police services. The UCR Survey allows changes in crime to be tracked over time and is a key source of information on criminal incidents that proceed to formal charges with possible entry into the court and correctional systems.
Data from the UCR Survey can be used to calculate two measures of crime: the traditional crime rate and the Crime Severity Index (CSI). The crime rate measures the volume of crime while the CSI measures the seriousness of crime (for further information, see Brennan and Dauvergne 2011).
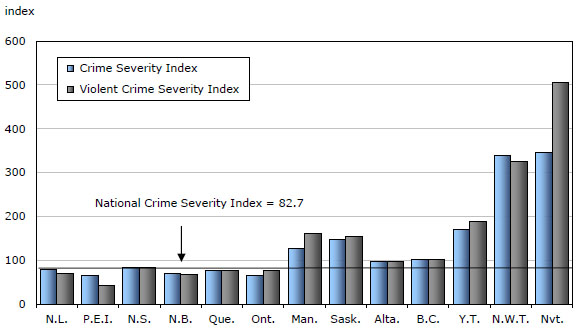
Police-reported data from the 2010 UCR Survey show that crime rates and crime severity were higher in the northern part of the country, particularly the Northwest Territories and Nunavut, relative to the rest of Canada (Brennan and Dauvergne 2011). More specifically, overall CSI values in the Northwest Territories and Nunavut were more than double those in Saskatchewan, the province with the highest CSI value. While the CSI value in Yukon was the lowest of the three territories, it remained higher in comparison to all the provinces. The disparity in the violent CSI value between the provinces and the territories was even greater (Chart 2). For example, the violent CSI value in the Northwest Territories was three times higher than the value in Manitoba, the province with the highest violent CSI value. This finding has been consistent for more than a decade.
Chart 1
Police-reported crime severity indexes, by province and territory, 2010
Source: Statistics Canada, Canadian Centre for Justice Statistics, Uniform Crime Reporting Survey.
End of text box 2.
Spousal violence
Unlike most violent crimes, spousal violence is often part of a pattern of ongoing abuse (Northwest Territories Health and Social Services 2011, CRCVC 2011, INSPQ 2011). As such, incident characteristics, risk factors and consequences for the victims may differ with the type of violence (Otto and Douglas 2010, Appleford 1989). While previous sections focussed on violent incidents committed by someone other than a spouse or common-law partner (current or former), this section focuses on spousal violence.
Research and policy regarding spousal violence have grown tremendously over the past three decades. Until 2004, much of the knowledge of spousal violence in the territories was solely based on official police statistics, which showed rates of spousal violence in the territories to be generally higher than the Canadian average (Johnson 2006). Research based on the 2004 GSS on victimization in the territories also reported higher rates of spousal violence in the territories than in the provinces (de Léséleuc and Brzozowski 2006, Johnson 2006).
Text box 3
Measuring spousal violence in the territories through the GSS
Through the 2009 GSS on Victimization, respondents who were married or living in a common-law relationship at the time of the survey, or had contact with their ex-partner (spouse or common-law) within the previous five years, were asked a series of questions about their experiences with spousal violence in the past 12 months as well as in the past five years.
The questions measure both physical and sexual violence, as defined by the Criminal Code, that could be acted upon by the police. This includes acts such as being threatened with violence, being pushed, grabbed, shoved, slapped, kicked, bit, hit, beaten, choked, threatened with a gun or knife or forced into sexual activity. Respondents were also asked about emotional and financial abuse they had experienced at the hands of a current or ex-partner. While emotional and financial abuse is not used to calculate the overall proportion of spousal violence victims, information about these forms of abuse helps to create a better understanding of the context in which physical and sexual violence may occur.
It is important to note that these data may undercount the number of victims of spousal violence. For instance, for a variety of reasons victims may be reluctant to report such incidents to interviewers. Also, some victims who may be at particular risk of violent victimization by a spouse may not be included in the scope of the survey, namely those residing in an institution, such as a shelter or hospital.
End of text box 3.
Residents of Yukon report lower levels of spousal violence than those in the Northwest Territories and Nunavut
In 2009, 4%Note E: Use with caution of residents of the territories with a current or former spouse or partner reported at least one incident of spousal violence in the previous 12 months, for a total of about 3,700Note E: Use with caution incidents (Table 1). To gain a better picture of spousal violence, respondents were also asked about spousal violence that occurred in the five years preceding the survey. Because of small sample size, this report focuses on spousal violence that occurred in the previous five years.
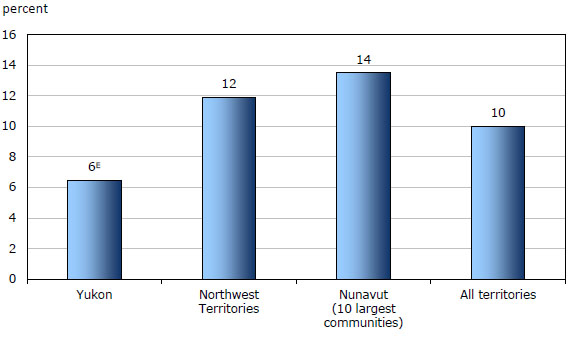
Overall, 1 in 10 (10%) residents of the territories who had a spouse/partner or who had contact with an ex-spouse/partner reported being the victim of spousal violence in the previous five-year period (Chart 2). This proportion, however, was not consistent across the three territories, with Yukon having the lowest proportion of spousal violence, at 6%Note E: Use with caution. This was about half the proportion observed in the Northwest Territories (12%) and Nunavut (14%Note E: Use with caution) (Chart 2). Compared to the other territories, the population in Yukon, who was married or living in a common-law relationship at the time of the survey, or had contact with an ex-partner (spouse or common-law) within the previous five years, included lower proportions of some population groups who tend to report higher proportions of spousal violence, namely young adults and Aboriginal people.
Chart 2
Self-reported spousal violence in the preceding 5 years, by territory, 2009
E use with caution
Note: Percentages are based upon persons who had a spouse/partner or had a contact with an ex spouse/partner in the 5 years preceding the survey.
Source: Statistics Canada, General Social Survey, 2009.
Spousal violence more common among young adults, Aboriginal people and low-income residents
Results from the 2009 GSS showed certain socio-demographic factors to be associated with the risk of spousal violence in the territories. For example, as seen with non-spousal violence, having a household income below $30,000 was associated with a higher proportion of spousal violence. Residents of the territories living in a household in that income group were about five times more likely to report spousal violence in the past 5 years than those earning $100,000 or more (25%Note E: Use with caution compared with 5%Note E: Use with caution). Similarly, those without a high school diploma and those whose main activity was not working at a paid job were also more likely to report spousal violence (Table 6).
These results differ from GSS results observed in the provinces, where these characteristics were found to have little impact on the risk of experiencing spousal violence (Brennan 2011, Johnson 2006, Gannon and Mihorean 2005). However, similar to provincial findings, higher proportions of spousal violence were found among younger residents and among Aboriginal people. Among those aged 15 to 34 who had a spouse or partner (current or former) in the previous five years, 1 in 5 (20%Note E: Use with caution) reported having experienced spousal violence. This compares to about 1 in 20 (5%Note E: Use with caution) among those aged 45 to 54. Similarly, 17% of Aboriginal people were victims of spousal violence in the past 5 years, compared with 6%Note E: Use with caution of non-Aboriginal people (Table 6).
Similar proportions of spousal violence among men and women in the territories
Previous studies indicate that males and females are at similar risk of experiencing spousal violence (Brennan 2010, Gannon and Mihorean 2005, Statistics Canada 2001). According to results from the 2009 GSS, this is also the case in the territories, where 10% of both men and women reported having experienced spousal violence in the previous five years (Table 6).
In the provinces, it was found that although the proportions of both sexes who were victims of spousal violence were similar, women were more likely to suffer the most severe types of spousal violence (Brennan and Dauvergne 2011).Note 8 In the territories, more than three-quarters (78%) of those who suffered the most severe forms of spousal violence were females.
Previous research suggests that while the prevalence of spousal violence may be similar for men and women, the consequences of violence are generally greater for women (Brennan 2011).In the territories,about one-half of female victims (51%Note E: Use with caution) said they had feared for their lives as a result of the violence by their spouse, while most male victims (92%) did not. However, due to the relatively small sample size in the territories, it was not possible to determine if there was a statistically significant difference between the proportions of men and women who reported sustaining injuries.
Most spouses or partners were drinking during incidents of spousal violence
Alcohol and drug use were often involved in situations of spousal violence in the territories. More specifically, more than two-thirds (65%Note E: Use with caution) of victims indicated that their current or former spouse had been drinking during the violent incidents (Table 7).
GSS respondents were also asked about their own alcohol and drug use. Heavy drinking and drug use were found to be associated with higher proportions of spousal violence victimization. One-quarter (25%Note E: Use with caution) of those who reported using drugs (regularly or occasionally) and over 1 in 5 (22%) of those who reported that they had five or more drinks in one sitting at least once in the previous month also reported having been the victim of spousal violence. In comparison, these proportions were 8% and 5% respectively among those who did not report such behaviours (Table 6).
In addition, the GSS asked all respondents, regardless of whether they had been a victim or not, about the monthly alcohol and drug use of their current spouse or partner. Over 1 in 10 (12%Note E: Use with caution) people whose current spouse or partner had 5 drinks or more in one sitting on at least one occasion in the month preceding the survey reported suffering violence at the hands of that spouse. This proportion rose to 17%Note E: Use with caution when both partners had drunk heavily on at least one occasion during that month, but was relatively low (4%Note E: Use with caution) among couples who reported no heavy drinking. Violence was also more common among those whose partners used drugs (occasionally or regularly) (24%Note E: Use with caution) compared with those who never used drugs (4%Note E: Use with caution).
Severity of spousal violence tends to increase with the frequency of incidents
Spousal violence often follows a pattern of on-going abuse (Northwest Territories Health and Social Services 2011, CRCVC 2011, INSPQ 2011). According to 2009 GSS results in the territories, close to one-half of victims (45%) in the territories reported multiple incidents of physical or sexual violence by a current or former spouse in the previous five years. In addition, about three-quarters (77%) of all victims of spousal violence also reported psychological or financial abuse (Table 7). This compares to 14% among those who did not experience spousal violence in the past five years.
The severity of spousal violence tends to increase with the number of incidents. About two-thirds (65%Note E: Use with caution) of those who were victims of 10 or more incidents reported experiencing the most severe forms of spousal violence.Note 9 In comparison, this was the case for about one-third (28%Note E: Use with caution) of people who had been victims of four or fewer incidents.
About 4 in 10 spousal violence victims suffered injuries
Spousal violence can have far-reaching health consequences, including physical injury and psychological distress (Brennan 2010). According to the GSS, 42% of residents of the territories who experienced spousal violence in the five years preceding the survey reported that they had sustained an injury, of which 31%Note E: Use with caution required medical attention. Similarly, about one-quarter (26%Note E: Use with caution) of victims found it difficult to carry out their everyday activities as a result of the violence.
Many emotional consequences were also associated with spousal violence. The most common was feeling angry (30%Note E: Use with caution), followed by feeling hurt or disappointed (15%Note E: Use with caution), and having depression or anxiety attacks (15%Note E: Use with caution). Moreover, 4 in 10 spousal violence victims (39%Note E: Use with caution) with children in the household reported that their children had witnessed the violence (Table 7).
Profile of household incidents and their victims
Previous studies show that some households are more at risk of being the victim of a household crime (Perreault and Brennan 2010; Gannon and Mihorean 2005). This risk is related to several factors such as socio-economic characteristics of households and neighbourhood characteristics. The GSS collects information on many of these factors.
Household victimization rates higher among those reporting social disorder in their neighbourhood
Overall, the rate of household victimization in the territories, which includes break and enter, motor vehicle theft, theft of household property and vandalism, was 379 incidents per 1,000 households in 2009 (Table 1).
This rate differed depending on some neighbourhood characteristics. Those who reported signs of social disorder in their neighbourhood were more likely to report that their household had been victimized. For example, higher rates were found among those who reported problems with noisy neighbours and loud parties (657 per 1,000), people hanging around on the streets (608) or people using or selling drugs (523) (Table 8).
Other neighbourhood characteristics were also found to be associated with lower rates of household victimization. In particular, the household victimization rate was lower among those who believed their neighbours were likely to call the police if they witnessed what seemed like criminal behaviour in the neighbourhood—352 compared with 595 among those who said their neighbours were unlikely to call the police (Table 8). Outside capital cities, it was also found that those who perceived their neighbourhood to be a place where neighbours help each other were less likely to report being the victim of a household crime, at 379 incidents per 1,000 compared with 841Note E: Use with caution among those who did not share this opinion.
Households of three or more people at greater risk of being victimized
GSS results from the provinces have shown that larger households and those with higher incomes tend to have higher victimization rates (Perreault and Brennan 2010). A household's size and income can be indicators of the quantity and value of the goods it possesses, and as such, its attractiveness for potential offenders (Perreault and Brennan 2010). In the territories, households with three or more members were more likely than smaller households to report having been the victim of a household crime, with a rate of 462 incidents per 1,000 households, compared with 303 for households with one member (Table 9).
However, unlike the findings at the provincial level, in the territories there was no difference in the rates of household victimization associated with income (Table 9). The only exception was with break and enter, which was higher among households with incomes lower than $60,000 (157Note E: Use with caution per 1,000 households) than those with incomes of $60,000 and over (63Note E: Use with caution per 1,000 households).
In the provinces, it was also found that those who had recently moved to an area were more at risk of being victimized (Perreault and Brennan 2010). Nevertheless, self-reported data show the opposite to be true in the territories, with a rate of 453 among those who had lived in their dwelling for at least five years, compared with 289 among those who had lived in their dwelling less than five years (Table 9).
More than one-half of household crimes resulted in losses of $200 or more
Although crimes that target households may not always be considered as serious as violent crimes, they often result in financial loss to victims. In 2009, more than one-half (54%) of incidents in the territories caused losses of $200 or more for the victims, almost all of whom (96%) did not obtain any reimbursement through insurance or any other compensation. The proportion of incidents resulting in losses of $200 or more was lower in Yukon (38%) than in the Northwest Territories (62%) and Nunavut (71%).
In addition to financial losses, in close to one-quarter (24%) of household incidents, the victim took some time off from their everyday activities as a result of the incident. Emotional consequences were also reported by many victims of a household crime. The most common emotional reactions were feeling angry (39% of incidents) and feeling upset, frustrated or confused (17%Note E: Use with caution). In contrast, less than 1 in 5 incidents (18%Note E: Use with caution) were reported as not affecting victims much.
Reporting victimizations to police
The decision to contact police in response to victimization is personal and often involves weighing many factors. In some cases, victims may not perceive the incident to be serious enough to warrant the attention of police authorities. Other victims of household or property theft may choose not to involve the police unless the monetary value is high enough to pursue an insurance claim.
Household and violent crimes in the territories equally likely to be reported to police
In the GSS, respondents who identified being a victim of crimeNote 10 in the past 12 months were asked whether or not the incident came to the attention of police. In 2009, 3 in 10 incidents in (30%) in the territories were reported to police authorities. This figure was similar in the provinces, where 31% of incidents were reported to police services (Perreault and Brennan 2010). In the territories, violent incidentsNote 11 (32%), household crimes (30%), and incidents of theft of personal property (27%Note E: Use with caution) were equally likely to be reported to police (Table 10).Note 12 However, non-violent crimes in the territories were more likely to be reported to police when there was a police detachment in the community compared with those without a local police presence (36% and 16%Note E: Use with caution respectively).
Among the individual offences, the sample size was not large enough to report the number of robberies, sexual assaults or motor vehicle/parts theft that were reported to police (See "data limitations" for more information). Among other crimes, 42% of incidents of vandalism were reported to police, followed by break and enter (31%Note E: Use with caution) and theft of household property (18%Note E: Use with caution). In addition, approximately 39%Note E: Use with caution of physical assaults were reported to police (Table 10). In the majority (71%) of incidents reported to police, it was the victim who reported the incident.
Among victims of violent crime who did not report the incident to police, most indicated that they chose to deal with the incident in some other way (61%). Many others specified that they did not think the incident was important enough to warrant contacting the police (53%Note E: Use with caution), did not want police involved (51%Note E: Use with caution), and/or felt that it was a personal matter that did not concern police (48%Note E: Use with caution). For victims of household crime, the two most common explanations for not reporting to police were that the police could not do anything about the incident (66%) and the incident was not important enough to the victim (60%).
More than one-half of spousal violence victims reported that police found out about the violence
Victims of spousal violence in the past five years were asked whether or not the police had found out about the violence.Note 13 The 2009 GSS data for the territories show that about half (51%) of victims of spousal violence in the past five years had contact with police as a result of the violence. This was higher than the rate of police contact in the provinces (22%) in 2009 (Brennan 2011). Previous research from 2004 also showed higher rates of police contact among victims of spousal violence in the territories than in the provinces (Johnson 2006).
The higher prevalence of victims in contact with police services among victims of spousal violence in the territories relative to the provinces may reflect a number of factors, including the availability of police as a local resource. In 2009, the concentration of police per capita ranged from 350 to 462 per 100,000 population in the territories, compared with 220 or less in the provinces (Burczycka 2010).
Among victims who had contact with police as a result of spousal violence in the past five years, just over half (52%Note E: Use with caution) personally reported the violence to police. Among Aboriginal victims of spousal violence in the territories, 69% had contact with police as a result of the violence. When asked what factors victims of spousal violence took into consideration in their decision to contact police services, stopping the violence/receiving protection was the most commonly cited reason.
Victims of spousal violence who reported the violence to police were asked what actions police took in response to the incident. In most instances, victims indicated that the police visited the scene (86%), conducted an investigation or made a report (81%), gave a warning to the accused (78%), and/or took the accused away (53%Note E: Use with caution).Note 14 For those victims who had contact with police as a result of the violence, 7 in 10 (71%) reported being satisfied with the police response.
Assistance from formal and informal support systems
Previous studies show that victims often rely on the support of a variety of formal and informal support systems to help them cope with their victimization (AuCoin and Beauchamp 2007). That said, providing support services to victims of crime can be particularly challenging in the vast and thinly populated territories in northern Canada (Johnson 2006). In the three territories, formal support systems, such as victim crisis centres, counselling services, shelters, and other community-based services, were used by about 1 in 3 (28%Note E: Use with caution) victims of spousal violence.
According to results of the 2009/2010 Transition Home Survey,Note 15 the number of women admitted to shelters for reasons of abuse was higher than the national average in the territories. According to a snapshot of shelter use on April 15, 2010, the rate of shelter use was highest in Nunavut (350 per 100,000 population), followed by Yukon (85) and Northwest Territories (58). In contrast, the national average was 25 per 100,000 population (Burczycka 2010).
Victims of spousal violence, like those who experienced other types of crime,Note 16 were most likely to turn to informal support systems. More than one-half of spousal violence victims turned to a family member (58%) and/or a friend or neighbour (55%) for support or guidance. Overall, female victims of spousal violence were more likely than male victims to talk to someone about the violence (88% and 58%Note E: Use with caution, respectively).
Perceptions of personal safety and neighbourhood crime
Vast majority of residents satisfied with their personal safety from crime
The 2009 GSS found that most residents of the provinces were satisfied with their personal safety from crime (Perreault and Brennan 2010), a finding that held true in the territories. Overall, more than 9 in 10 residents of the territories reported being satisfied with their personal safety, a finding that was similar for females (90%) and males (92%) (Table 11).
When asked about engaging in specific activities, such as walking alone after dark and being home alone in the evening or night, females were more likely than males to express concern. For example, only 33% of females reported feeling very safe walking alone after dark, compared with 58% of males (Table 11). These differences were observed in both the Aboriginal and non-Aboriginal populations, and in each of the three territories. These findings are consistent with previous research that has shown a greater fear of crime among women, which some have attributed to their specific feelings of vulnerability to sexual violence (Dobbs et al. 2009, Lane et al. 2009, Ferraro 1995).
A slightly higher proportion of Nunavut (9%) and Yukon (9%Note E: Use with caution) residents reported feeling dissatisfied with their safety from crime than residents of the Northwest Territories (4%) (Table 11). Aboriginal people were somewhat less likely than non-Aboriginal people to report feeling very satisfied with their personal safety (43% compared with 55%).
Majority of residents of the territories believed crime in their neighbourhood was lower than elsewhere in Canada
When asked how they thought the level of crime in their neighbourhood compared with other neighbourhoods in Canada, most residents of the territories perceived it to be lower (56%) or the same (27%). About 13% thought crime was higher in their neighbourhood than elsewhere in Canada, with non-Aboriginal people being more likely than Aboriginal people to perceive higher neighbourhood crime levels (15% and 9%Note E: Use with caution respectively).
There were small differences in the perception of neighbourhood crime between the territories. For example, residents of Nunavut (47%) were somewhat less likely than residents of the Northwest Territories (61%) and Yukon (56%) to think crime was lower in their neighbourhood than elsewhere in Canada (Table 11).
Signs of physical and social disorder in the neighbourhood reported by residents
Respondents of the GSS were asked a series of questions about the extent of physical and social disorderNote 17 in their neighbourhood. Signs of physical disorder, such as litter on the streets or vandalism may reflect that the neighbourhood is uncared for and/or lacks surveillance (Keown 2008). Similarly, signs of social disorder, such as public drinking, drug use, and loitering may cause some residents to feel uneasy with their personal safety from crime. If these concerns proliferate over time, residents may have a lower sense of attachment to their communities, alter their behaviour, or move away (Keown 2008).
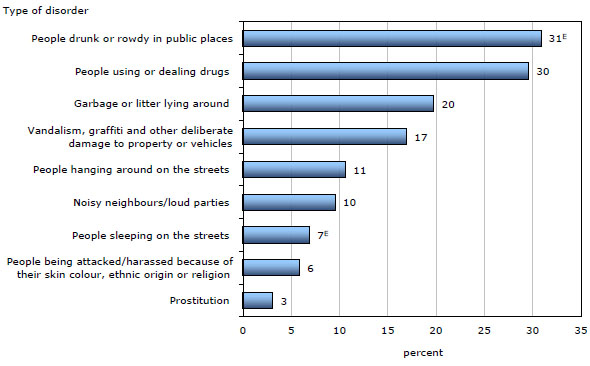
Among the nine types of physical and social disorder measured by the GSS, the most commonly identified included: drunk or rowdy people in public places (31%), people using or dealing drugs (30%), garbage and litter lying around (20%), vandalism, graffiti and other deliberate damage to property of vehicles (17%) (Chart 3).
Chart 3
Self-reported perceptions of neighbourhood social and physical disorder, Canada's territories, 2009
E use with caution
Note: The categories "Don't know" and "Not stated" are included in the calculation of percentages.
Source: Statistics Canada, General Social Survey, 2009.
Overall perceptions of neighbourhood physical and social disorder were generally similar across the territories; however, there were a few exceptions. For example, Nunavut residents were two times more likely to report a problem with garbage/litter (32%) than residents of Yukon (16%) and the Northwest Territories (18%). On the other hand, residents of the Northwest Territories (11%) were more likely to report a problem with noisy neighbours than Nunavut residents (6%Note E: Use with caution).
Previous research suggests that residents of urban areas, particularly those close to the city centre, and those living in areas with high-density housing, are more likely to perceive disorder in their neighbourhoods (Keown 2008). In the territories, residents living in the capital cities of Whitehorse, Yellowknife and Iqaluit were more likely than people living in other areas to report a problem with people sleeping on the streets (10%Note E: Use with caution compared with 4%Note E: Use with caution). On the other hand, a slightly lower proportion of those living in the capitals reported a problem with noisy neighbours (7% versus 12%) or a problem with people using or dealing drugs in the neighbourhood (25% versus 34%).
Territorial residents who perceived physical and social disorder to be a problem in their area were also more likely to report a series of other concerns including high local crime relative to other neighbourhoods in Canada, overall dissatisfaction with their personal safety, fear of becoming a victim of crime, and a low sense of belonging to their community. For example, the proportion of residents who thought crime was higher in their neighbourhood than in other neighbourhoods in Canada was four times higher among those who reported neighbourhood problems with public drug use and drunkenness (27% and 29%) than those who did not (6%Note E: Use with caution and 5% respectively) (Table 12).
Residents who reported a problem with noisy neighbours or loud parties were two times more likely to report feeling a low sense of belonging to their local community (30%Note E: Use with caution) than those who did not identify these as local problems (15%). Similarly, residents who thought that there was a problem with graffiti or other deliberate damage to their neighbourhoods were more likely to report low community belonging (26%Note E: Use with caution compared with 14%).
Perceptions of the criminal justice system
As part of the 2009 GSS, respondents were asked a series of questions about how well they thought their local police, criminal courts, prison and parole systems were doing in a number of areas. This information may be of particular interest to criminal justice practitioners and policy makers, as it can help inform decisions on training, resource allocation, and the need for public outreach and education.
Most residents of the territories thought their local police were doing a good job
Overall, most residents of the provinces had a positive opinion of their local police service (Statistics Canada 2011), and this was also true in the territories. More than three-quarters of residents of the territories thought that their local police were doing a good or average job in all categories. Overall, people were most critical of police efforts in supplying crime prevention information, treating people fairly, and responding promptly to calls. Perceptions of police were generally similar across the three territories (Table 13).
Consistent with research in the provinces (Perreault 2011), Aboriginal people in the territories were somewhat more likely than non-Aboriginal people to report being dissatisfied with police. For example, Aboriginal people were less likely than non-Aboriginal people to indicate that the local police were doing a good or average job of supplying information on reducing crime (63% versus 84%), of responding promptly to calls (66% versus 80%), and of treating victims fairly (72% versus 83%).
Residents who had contact with police in the past year were somewhat more critical of police
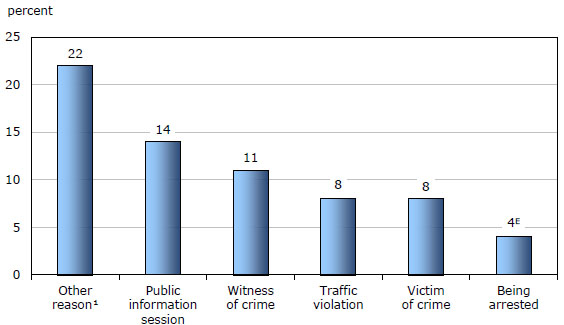
According to GSS data, close to one-half of residents of the territories (44%) were in contact with police in the previous 12 months. The most common reasons for police contact included attending a public information session (14%), as a witness of crime (11%), for a traffic violation (8%) or as a victim of crime (8%) (Chart 4).Note 18
Chart 4
Self-reported contact with police, Canada's territories, 2009
E use with caution
1. Includes contact with police for work, an accident or other reasons unspecified.
Note: The categories "Don't know" and "Not stated" are included in the calculation of percentages. Totals will not add to 100% due to multiple responses.
Source: Statistics Canada, General Social Survey, 2009.
Previous experiences with the criminal justice system may shape a person's opinion of how well the system is operating (AuCoin and Beauchamp 2007). Past research suggests that victims of crime, particularly violent crime, are more likely than non-victims to report dissatisfaction with police (AuCoin and Beauchamp 2007). Residents of the territories who had contact with policeNote 19 in the past year were somewhat more likely than non-victims to report that the police were doing a poor job in particular tasks, such as enforcing the law (13% versus 8%Note E: Use with caution) and treating people fairly (19% versus 12%).
Residents of the territories more critical of the courts and correctional systems than the police
As in the provinces (Statistics Canada 2011), residents of the territories were more critical of the courts than of their local police service. While most thought the courts were doing a good (42%) or average job (37%) ensuring a fair trial for the accused, close to one-third (31%) believed they were doing a poor job providing justice quickly and one-quarter (25%) thought they were doing a poor job helping victims. Perceptions of the courts were generally similar across the three territories, with only a few exceptions. For example, residents of Nunavut were more likely to report the courts were doing a good job of helping the victim than Yukon residents (37% versus 20%) (Table 13).
Similar to those who had previous contact with police, respondents who had contact with the courts at some point in their lives were slightly more critical of the courts than those without a personal experience with the courts. For example, people who had contact with the courts were more likely to indicate that the courts were doing a poor job providing justice quickly and helping victims (44% and 33% respectively) than those who had no contact with the court system (23% and 20% respectively).
Victims of crime generally receptive to victim-offender reconciliation programs
In the 2009 GSS, victims of crime in the Northwest Territories and NunavutNote 20 were asked how willing they would be to participate in a program where the victim and the offender meet to discuss a fair resolution to the crime. Most victims of crime were interested in participating in a victim-offender reconciliation program.
There were no differences between Northwest Territories and Nunavut, with 53% of crime victims reporting interest in a reconciliation program in both territories. Approximately one-half of all victims of non-spousal violent crime (50%) and household crime (48%) reported being interested in participating in a reconciliation program. The proportion was even higher for victims of theft of personal property (63%). A similar proportion of Aboriginal (53%) and non-Aboriginal (51%) victims reported some interest in reconciliation.
Summary
In 2009, 34% of residents of the territories reported having been the victim of at least one criminal incident in the 12 months preceding the survey, with assault being the most common offence. Victimization rates were usually similar in the three territories, with the exception of spousal violence, which was lower in Yukon.
Single people and low-income residents were more likely than their counterparts to report having been the victim of a violent incident. Also, young adults and Aboriginal people were more likely to have been the victim of spousal violence in the previous five years. Most victims of a violent incident in the territories said they knew their perpetrator and that the incident could be related to their alcohol or drug use. Most incidents were not reported to police, with 30% of both violent crimes (non-spousal) and household crimes having been reported. About one-half of all victims of spousal violence said the police had been contacted at least once.
Despite higher victimization rates compared with the provinces and relatively high proportions of residents reporting signs of social disorder in their neighbourhood, such as people using or selling drugs, most residents of the territories reported being satisfied with their personal safety from crime. Moreover, close to 9 in 10 (88%) residents of the territories believed the police were doing an average or good job in ensuring the safety of citizens.
Detailed data tables
Table 10 Self-reported victimizations reported to police, Canada's territories, 2009
Table 11 Perceptions of crime and feelings of safety from crime, by sex, by territory, 2009
Table 13 Perceptions of the criminal justice system, Canada's territories, 2009
Data source
Methodology
In 2009, Statistics Canada conducted the victimization cycle of the General Social Survey for the fifth time. Previous cycles were conducted in 1988, 1993, 1999 and 2004. The objectives of the survey are to provide estimates of Canadians' personal experiences of eight offence types, examine risk factors associated with victimization, examine reporting rates to police, measure the nature and extent of spousal violence, measure fear of crime and examine public perceptions of crime and the criminal justice system.
The 1999 and 2004 GSS also included a test collection of telephone survey data in the territories. The 2009 survey on victimization was also conducted in Yukon, Northwest Territories and Nunavut using a different sampling design.
Sampling
The target population included all persons 15 years and older in the three territories, excluding full-time residents of institutions. The sample for the victimization survey in the territories was drawn from an area frame of households which had completed the 2007-2008 Canadian Community Health Survey (CCHS) or the 2007-2009 Labour Force Survey (LFS). The sample unit was the dwelling. The communities covered represent over 90% of the population aged 15 and over in the Yukon and Northwest Territories. In Nunavut, the 10 largest communities eligible for sampling cover about 70% of the target population (these include Iqaluit, Rankin Inlet, Cambridge Bay, Kugluktuk, Baker Lake, Arviat, Pangnirtung, Cape Dorset, Igloolik and Pond Inlet).
Once a household was contacted an individual 15 years or older was randomly selected to respond to the survey. Respondents were interviewed in the official language of their choice (those who could not speak English or French were considered as non-response). The sample in 2009 was approximately 1,094 respondents, a slightly smaller sample than in 2004 (1,290).
Data collection
Data collection took place from September to December 2009 inclusively.
The method of collection was a mixture of telephone (CATI) and personal interviews (CAPI). All cases started as CATI at the regional office and could be transferred to a CAPI-interviewer depending on the community and collection constraints. It should be noted that some cases could be assigned to CAPI for the purpose of contacting the household, but the interview was completed by CATI. A typical interview lasted approximately 45 minutes.
Response rates
Of the 2,235 households selected for the 2009 GSS sample in the territories, 1,094 usable responses were obtained. This represents a response rate of 50.7% overall (54.4% in Yukon, 54.7% in Northwest Territories and 38.7% in Nunavut's 10 largest communities). Types of non-response included respondents who refused to participate, could not be reached, or could not speak English or French. Respondents in the sample were weighted so that their responses represent the non-institutionalized populations in Yukon and Northwest Territories aged 15 years or over. The estimates from Nunavut are weighted to the population aged 15 years and over in the 10 largest communities.
Compared with other areas in Canada, conducting surveys in the territories poses unique challenges, including incomplete telephone service, language difficulties, high population mobility and the remoteness of many communities. Collection in Nunavut's 10 largest communities was especially challenging and resulted in undercoverage of the Inuit population and lower response rates than those in Yukon and the Northwest Territories. Results from Nunavut, therefore, should be used with caution.
Data limitations
As with any household survey, there are some data limitations. The results are based on a sample and are therefore subject to sampling error. Somewhat different results might have been obtained if the entire population had been surveyed. This Juristat uses the coefficient of variation (CV) as a measure of the sampling error. Any estimate that has a high CV (over 33.3%) has not been published because the estimate is too unreliable. In these cases, the symbol 'F' is used in place of an estimate in the figures and data tables. An estimate that has a CV between 16.6% and 33.3% should be used with caution and the symbol 'E' is referenced with the estimate. Unless otherwise stated, statistically significant differences were determined using 95% confidence intervals. Using the 2009 GSS sample design and sample size in the territories, an estimate of a given proportion of the total population, expressed as a percentage is expected to be within 4.1 percentage points of the true proportion 19 times out of 20.
References
Appleford, B. 1989. Family Violence Review: Prevention and Treatment of Abusive Behaviour. Prepared by Appleford Associates for Correctional Services Canada.
(accessed November 24, 2011).
AuCoin, K. and D. Beauchamp. 2007. "Impacts and consequences of victimization, GSS 2004." Juristat. Vol. 27, no. 1. Statistics Canada Catalogue no. 85-002-XIE.
(accessed November 29, 2011)
Brennan, S. 2011. "Violent victimization of Aboriginal women in the Canadian provinces, 2009." Juristat. Statistics Canada catalogue no. 85-002-X.
(accessed November 29, 2011).
Brennan, S. 2010. "Self-reported spousal violence, 2009." Family Violence in Canada – A Statistical Profile. Statistics Canada Catalogue no. 85-224-X.
(accessed November 29, 2011).
Brennan, S. and M. Dauvergne. 2011. "Police-reported crime statistics in Canada, 2010." Juristat. Statistics Canada Catalogue no. 85-002-X.
(accessed November 29, 2011).
Burczycka, M. 2010. Police Resources in Canada, 2010. Statistics Canada Catalogue no. 85-225-X. Ottawa.
(accessed November 25, 2011).
Canadian Resource Centre for Victims of Crime (CRCVC). 2011. Spousal Abuse
(accessed October 24, 2011).
Charron, M., C. Penney, and S. Senécal. 2010. Police-reported crime in Inuit Nunangat. Statistics Canada Catalogue no. 85-561-M. Ottawa. Crime and Justice Research Paper Series, no. 20.
(accessed November 25, 2011).
Dauvergne, M. 2010. "Knives and violent crime in Canada, 2008." Juristat.Vol. 30, no. 1. Statistics Canada Catalogue no. 85-002-X.
(accessed November 25, 2011).
de Léséleuc, S. and J.-A. Brzozowski. 2006. Victimization and Offending in Canada's Territories, 2004 and 2005. Statistics Canada Catalogue no. 85F0033MWE. Ottawa. Canadian Centre for Justice Statistics Profile Series, no. 11.
(accessed November 25, 2011).
Dobbs, R.R., C.A. Waid, and T. O'Connor Shelley. 2009. "Explaining fear of crime as fear of rape among college females: an examination of multiple campuses in the United States." International Journal of Social Inquiry. Vol. 2(2): 105-122.
Ferraro, K.F. 1995. Fear of Crime: Interpreting Victimization. New York, NY: State University of New York Press.
Gannon, M. and A. Taylor-Butts. 2006. Canadians' Use of Crime Prevention Measures. Statistics Canada Catalogue no. 85F0033MIE. Ottawa. Canadian Centre for Justice Statistics Profile Series, no. 12.
(accessed November 25, 2011).
Gannon, M. and K. Mihorean. 2005. "Criminal victimization in Canada, 2004." Juristat, Vol. 25, no. 7. Statistics Canada Catalogue no. 85-002-X.
(accessed November 25, 2011).
Hotton Mahony, T. 2011. "Homicide in Canada, 2010." Juristat. Statistics Canada Catalogue no. 85-002-X.
(accessed November 25, 2011).
Innes, M. 2000. "Signal crime and signal disorders: notes on deviance as communicative action." The British Journal of Sociology. 55(3): 335-355.
Institut national de santé publique du Québec (INSPQ). 2011. "Trousse média sur la violence conjugale."
(accessed October 24, 2011).
Jacob, J.C. 2006. "Male and female youth crime in Canadian communities: assessing the applicability of social disorganization theory." Canadian Journal of Criminology and Criminal Justice. Vol. 48, no. 1. p. 31 to 60.
Janhevich, D.E. 1998. "Violence committed by strangers." Juristat.Vol. 18, no. 9. Statistics Canada Catalogue no. 85-002-X.
(accessed November 25, 2011).
Johnson, H. 2006. Measuring Violence Against Women: Statistical Trends 2006. Statistics Canada Catalogue no. 85-570-XIE. Ottawa.
(accessed November 25, 2011).
Johnson, H. and M. Dawson. 2011. Violence Against Women in Canada: Research and Policy Perspectives. Don Mills: Oxford University Press.
Keown, L. 2010. "Precautions taken to avoid victimization: a gender perspective." Canadian Social Trends. No. 89. Statistics Canada Catalogue no. 11-008-X.
(accessed November 25, 2011).
Keown, L. 2008. "Life in metropolitan areas: a profile of perceptions of incivility in the metropolitan landscape." Canadian Social Trends. No. 86. Statistics Canada Catalogue no. 11-008-X. (accessed November 25, 2011).
Lane, J., A.R. Grover, and S. Dahod. 2009. "Fear of violent crime among men and women on campus: the impact of perceived risk and fear of sexual assault." Violence and Victims. Vol. 24(2): 172-192.
Lewis. D.A. and G. Salem. 1986. Fear of Crime: Incivility and the Production of a Social Problem. 146 pages. New Jersey: Transaction New Brunswick.
Martel, L. and É. Caron-Malenfant. 2007. Portrait of the Canadian Population in 2006, by Age and Sex, 2006 Census. Statistics Canada Catalogue no. 97-551-X. Ottawa:
Mihorean, K., S. Besserer, D. Hendrick, J.-A. Brzozowski, C. Trainor and S. Ogg. 2001. A Profile of Criminal Victimization: Results of the 1999 General Social Survey. Statistics Canada Catalogue no. 85-553-XIE. Ottawa.
(accessed November 25, 2011).
Morenoff, J.D., R.J. Sampson and S.W. Raudenbush. 2001. "Neighbourhood inequality, collective efficacy and the spatial dynamics of urban violence." Criminology. Vol. 39, no. 3. p. 517 to 559.
Northwest Territories Health and Social Services. 2011. "Cycle of Violence Spousal Relationship."
(accessed October 24, 2011).
Otto, R.K. and K.S. Douglas. 2010. Handbook of Violence Risk Assessment. New York: Routledge, Taylor and Francis Group.
Perreault, S. 2011. "Violent victimization of Aboriginal people in the Canadian provinces, 2009." Juristat. March. Statistics Canada Catalogue no. 85-002-X.
(accessed November 25, 2011).
Perreault, S. and S. Brennan. 2010. "Criminal victimization in Canada, 2009." Juristat. Vol.30, no. 2. Statistics Canada Catalogue no. 85-002-X.
(accessed November 25, 2011).
Sampson, R. J. and S.W. Raudenbush. 2004. "Seeing disorder: neighbourhood stigma and the social construction of "broken windows"." Social Psychology Quarterly. 67(4): 319-342.
Savoie, J., F. Bédard and K. Collins. 2006. Neighbourhood characteristics and the distribution of crime on the Island of Montréal. Statistics Canada Catalogue no. 85-561-MIE. Crime and Justice Research Paper Series, no. 7.
(accessed November 25, 2011).
Scott, H. 2003. "Stranger danger: explaining women's fear of crime." Western Criminology Review. Vol. 4, no. 3, pp. 203-214.
Statistics Canada. 2011. Special tabulation. 2009 General Social Survey.
Statistics Canada. 2008. Aboriginal Peoples in Canada in 2006: Inuit, Métis and First Nations, 2006 Census. Statistics Canada Catalogue no. 97-558-X. Ottawa.
(accessed November 25, 2011).
Statistics Canada. 2001.Women in Canada. Statistics Canada Catalogue no. 85F0033MIE. Ottawa. Canadian Centre for Justice Statistics Profile Series, no. 10.
(accessed November 25, 2011).
Notes
E use with caution
- Because a different mode of data collection was used in the territories in 2009, comparisons to results from the provinces should be made with caution. Results from 2004 for the territories should not be compared to 2009 results.
- Due to small sample sizes, it was necessary to combine data from the territories in some sections of this article.
- Unless otherwise stated, differences presented in this reported are statistically significant at p<0.05.
- Includes incidents of sexual assault and assault committed by a spouse or partner (current or former); and incidents of sexual assault, robbery and assault committed by someone other than a spouse or partner. Subsequently, spousal and non-spousal violence will be analyzed separately (see Spousal violence section for more details).
- Difference was significant at p<0.1 but not p<0.05.
- Difference was significant at p<0.1 but not p<0.05.
- Difference was significant at p<0.1 but not p<0.05.
- Includes forced into sexual activity, threatened/used gun or knife, choked and/or beaten.
- Includes forced into sexual activity, threatened/used gun or knife, choked and/or beaten.
- Excludes spousal physical and sexual assault.
- Includes non-spousal assault, sexual assault and robbery.
- There were no statistically significant differences in the proportions of victimization incidents reported to police in the Northwest Territories (34%) than in Nunavut (29%) or Yukon (27%Note E: Use with caution).
- Victims who indicated they were in contact with police as result of violence that occurred in the past 5 years were then asked if the police learned about the violence from the respondent or some other way
- The sample size was not large enough to report the number of cases in which the spouse was arrested or charged by police.
- The Transition Home Survey (THS) is conducted every two years and collects information on the characteristics of all residential services for abused women and their children during the previous 12 months of operation. In addition, the THS collects information on selected characteristics for the women residing in these shelters on a specified 'snapshot' day.
- Among victims of non-spousal violent crimes and household crimes, more than one-half of victims turned to a family member for support (62%) and/or talked to a friend or neighbour (55%).
- Perceptions of neighbourhood disorder, like perceptions of neighbourhood crime, capture respondents' beliefs that incivilities or crime in their local communities have moved beyond what is deemed acceptable or normal. These are subjective measures that are contingent on many factors, including individual personality and typical local patterns of behaviour (Keown 2008; Innes 2000; Sampson and Raudenbush 2004). For example, certain types of behaviours such as "hanging out" and hearing "loud music" may be ordinary occurrences in central urban areas at certain points in the day, but may be unusual in suburban or rural areas. These "thresholds" will vary from person to person, and neighbourhood to neighbourhood, but what is measured in this context is whether or not the behaviours have reached a point of concern, potentially leading to dissatisfaction among local residents and affecting their overall health and well-being.
- Another 26% of respondents had contact with police for a variety of other reasons including being arrested (4%Note E: Use with caution).
- Respondents may have had contact with police for a number of different reasons; including a traffic violation, as a victim or witness of crime, being arrested, attending a public information session, or other reason. The sample was not large enough to report on perceptions of the criminal justice system among victims of crime in the territories.
- This question was not asked of Yukon residents because victim-offender reconciliation programs were not available in that territory at the time of the survey.
- Date modified: