
Police-reported crime statistics in Canada, 2010

Archived Content
Information identified as archived is provided for reference, research or recordkeeping purposes. It is not subject to the Government of Canada Web Standards and has not been altered or updated since it was archived. Please "contact us" to request a format other than those available.
By Shannon Brennan and Mia Dauvergne
- Police-reported crime reaches its lowest level since the early 1970's
- Crime rates and severity decline across most of the country
- Canada's largest metropolitan areas report declines in crime severity
- Violent crime
- Non-violent crime
- Youth crime
- Factors affecting police-reported crime statistics
- Summary
- Data source
- Detailed data tables
- References
- Notes
Text begins
One way of measuring crime in Canada is through the use of police-reported data. Every year, Statistics Canada conducts the Uniform Crime Reporting (UCR) Survey, which has collected data on all criminal incidents known to, and substantiated by, Canadian police services since 1962. These data conform to a nationally approved set of common crime categories and definitions that have been developed in co-operation with the Canadian Association of Chiefs of Police.
This article presents findings from the 2010 UCR Survey. It examines overall trends in the volume and severity of crime for both violent and non-violent offences at the national, provincial/territorial, and census metropolitan area levels. In addition, this article explores changes in the number and rate of individual offences reported by police, for certain violent (e.g. homicide and robbery) and non-violent crimes (e.g., break and enter and motor vehicle theft). Finally, information pertaining to trends in the volume and severity of youth crime are presented.
Police-reported crime reaches its lowest level since the early 1970's
The police-reported crime rate, which measures the overall volume of crime, continued to decline in 2010 (down 5%), reaching its lowest level since 1973 (Chart 1). In total, Canadian police services reported close to 2.1 million Criminal Code incidents (excluding traffic), approximately 77,000 fewer than in 2009 (Table 1a). Decreases among property crimes, namely theft under $5,000 (-23,000 incidents), mischief (-22,500 incidents), motor vehicle thefts (-15,300 incidents), and break and enters (-9,200 incidents), accounted for the majority of the decline.
Chart 1
Police-reported crime rates, Canada, 1962 to 2010

Note: Information presented in this graph represents data from the UCR Aggregate (UCR1) Survey and allow for historical comparisons to be made back to 1962. As such, these data may differ slightly from data presented elsewhere in this article which are based upon newer UCR2 Survey definitions of crime categories.
Source: Statistics Canada, Canadian Centre for Justice Statistics, Uniform Crime Reporting Survey.
In addition to measuring the volume of crime, police-reported data enable the severity of crime to be measured, through the use of the Crime Severity Index (CSI) (see Text box 1). Since 1998, the first year in which CSI data are available, the index for total crime has declined in all but one year. In 2010, the severity of police-reported crime fell 6%, and was 23% lower than a decade before (Table 1b, Chart 2).
Chart 2
Police-reported crime severity indexes, Canada, 2000 to 2010
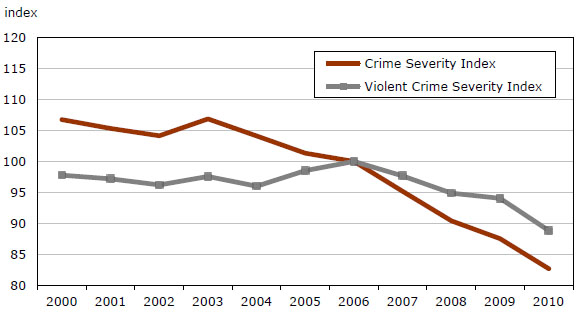
Note: Indexes have been standardized to a base year of 2006 which is equal to 100.
Source: Statistics Canada, Canadian Centre for Justice Statistics, Uniform Crime Reporting Survey.
Text box 1
Explaining the traditional crime rate and the Crime Severity Index
In Canada, there are two complementary ways police-reported crime can be measured: the traditional crime rate and the Crime Severity Index (CSI). The crime rate measures the volume of crime while the Crime Severity Index measures the seriousness of crime.
Crime rate: The police-reported crime rate is based upon all criminal incidents, excluding Criminal Code traffic offences, drug offences and other federal statute offences, as well as provincial statute offences. Traffic offences are not included in the calculation of the crime rate since charging practices for these types of offences differ, not only between police services, but also within police services and from one year to the next. Thus, including these high-volume offences would lead to artificial fluctuations in crime rates. Other federal statute offences are not included since these types of offences are not part of the Criminal Code, but are one of many federal statute offences which generally fall under the enforcement of a variety of federal agencies such as the Canada Revenue Agency or Citizenship and Immigration Canada.
The crime rate is calculated by summing criminal incidents (excluding traffic offences as well as other provincial and federal statute offences) reported to the police and dividing by the population. In this calculation, all offences are counted equally; for example, one incident of murder is counted in the same way as one incident of bicycle theft. As such, the crime rate tends to be driven by high-volume, less serious offences, such as minor thefts and mischief.
The crime rate is expressed as a rate per 100,000 population. In addition to the overall crime rate, there are three sub-totals: violent, property and other Criminal Code, each of which is available from 1962 to present.
Separate rates for overall, violent, property and other Criminal Code offences are also available for youth. However, while crime rates in general are based upon counts of incidents, youth crime rates are based upon counts of individuals aged 12 to 17 years.
Crime Severity Index: The Crime Severity Index (CSI) not only takes into account the volume of crime but also the seriousness of crime. In the calculation of the CSI, each offence is assigned a weight, derived from average sentences handed down by criminal courts. The more serious the average sentence, the higher the weight for that offence. As a result, more serious offences have a greater impact on changes in the index.
All offences, including traffic offences as well as other provincial and federal statute offences, are included in the CSI. Because these types of offences are typically minor in nature and carry relatively low weights, their impact on the CSI values tend to be negligible. The CSI is calculated by summing the weighted offences and dividing by the population. The base year for the CSI is 2006, with an Index of "100".
In addition to the overall CSI, there is a violent CSI and a non-violent CSI. Each of these indexes is available from 1998 to present.
Using the same basic concept of weighting offences according to their seriousness, there is also a CSI specific to youth. As with the youth crime rate, counts are based upon the number of youth (12 to 17 years) accused of crime rather than the number of incidents. As is the case for the CSI in general, there is a youth overall CSI, a youth violent CSI and a youth non-violent CSI, each of which is available from 1998 to present.
For more information on the Crime Severity Index, see "Measuring Crime in Canada: Introducing the Crime Severity Index and Improvements to the Uniform Crime Reporting Survey" (Wallace et al. 2009) and "The Methodology of the Police-Reported Crime Severity Index" (Babyak et al. 2009).
End of text box 1.
Crime rates and severity decline across most of the country
In 2010, both the volume and severity of crime reported by police declined or remained stable across most of the country. Among the provinces, Alberta and British Columbia reported the largest declines. The crime rate in both provinces decreased by 6% (Table 2a), while the CSI dropped 8% in Alberta and 7% in British Columbia (Table 2b).
The only jurisdictions to see an increase in both the volume and severity of crime in 2010 were Newfoundland and Labrador, the Northwest Territories and Nunavut. The crime rate also rose slightly in Nova Scotia; however, the Crime Severity Index reported by police in this province remained stable.
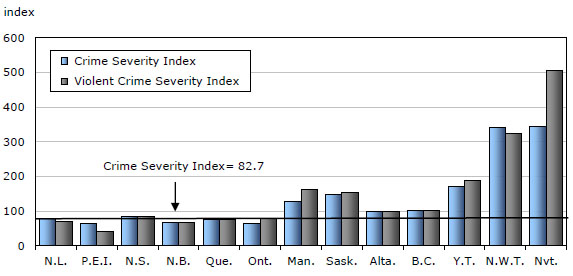
Similar to previous years, police-reported crime rates and crime severity in 2010 were substantially higher in the northern part of the country, particularly the Northwest Territories and Nunavut, relative to the rest of the country (Chart 3).
Chart 3
Police-reported crime severity indexes, by province and territory, 2010
Source: Statistics Canada, Canadian Centre for Justice Statistics, Uniform Crime Reporting Survey.
Among the provinces, those in the west reported higher crime rates and greater crime severity than those in the east, similar to the pattern seen over many years. For example, as has been the case since 1998, Saskatchewan's CSI in 2010 was the highest among the provinces, followed by Manitoba, British Columbia and Alberta. Nova Scotia was the only eastern province whose CSI in 2010 was above the national index.
Canada's largest metropolitan areas report declines in crime severity
Similar to findings at the provincial level, the volume and severity of crime fell or remained stable in virtually all census metropolitan areas (CMAs)1 in 2010, including Canada's ten largest cities. That said, there were a few smaller CMAs that did show increases in 2010, most notably, St. John's where the rate rose 7% and the CSI rose 12% (Table 3).
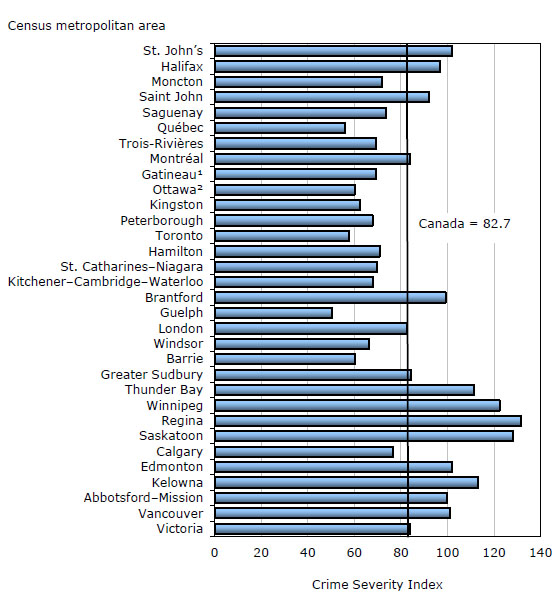
As has been the case since 1998, Regina reported the highest CSI in 2010, followed by Saskatoon, Winnipeg and Kelowna. These same cities were also among those with the highest overall crime rates, despite seeing declines from the previous year. Calgary was the only western CMA where the CSI and crime rate were below those at the national level (Chart 4).
Chart 4
Police-reported Crime Severity Index, by census metropolitan area, 2010
1. Gatineau refers to the Quebec part of the Ottawa–Gatineau CMA.
2. Ottawa refers to the Ontario part of the Ottawa–Gatineau CMA.
Note: The Oshawa census metropolitan area (CMA) is excluded from this chart due to the incongruity between the police service jurisdictional boundaries and the CMA boundaries.
The Sherbrooke CMA is excluded due to the unavailability of data in 2010.
Source: Statistics Canada, Canadian Centre for Justice Statistics, Uniform Crime Reporting Survey.
In contrast, Guelph reported the lowest CSI for the fourth year in a row. Guelph's index was followed by Québec and Toronto whose indexes have been among the lowest since 1998, the first year for which these data are available.
Police-reported CSI values are also available for the approximately 240 police services policing at least one population centre over 10,000 population (Statistics Canada 2011). Among these centres, the highest CSI value was reported in North Battleford, Saskatchewan for the second year in a row, followed by Thompson, Manitoba. The lowest CSI values were generally found in Ontario, with Amherstburg and Meaford reporting the lowest values.
Text box 2
Measuring crime with the General Social Survey on Victimization
Another source of information on the nature and extent of crime in Canada is the General Social Survey (GSS) on Victimization. The GSS is conducted every five years and collects self-reported data from Canadians (aged 15 years and older) on their perceptions of criminal victimization for eight offences: sexual assault, robbery, physical assault, break and enter, theft of motor vehicles or their parts, theft of household property, theft of personal property and vandalism.
One of the benefits of the GSS is that it collects information on crime that is not reported to police which, in 2009 (the latest year of available statistics), was estimated at about two-thirds of all criminal victimizations. A drawback of the GSS is that it relies upon respondents to accurately recall and report events which may not always conform to the legal definitions of a crime. For further information on the results from the 2009 GSS, see "Criminal victimization in Canada, 2009" (Perreault and Brennan 2010).
End of text box 2.
Violent crime
Police report the largest drop in violent crime severity since 1999
In 2010, both the volume and severity of police-reported violent crime declined. The rate of violent crime fell 3% from 2009 (Table 1a) while the decline in the violent CSI was more notable, down 6% (Table 1b). This marked the fourth consecutive decline in the violent CSI and the largest drop seen in more than a decade.
Overall, violent crimes accounted for just over one in five (21%) offences. In 2010, police reported over 437,000 violent incidents, about 7,200 fewer than the previous year (Table 4). Among the violent crimes that saw a decline in the rate were attempted murder (-14%), homicide (-10%), robbery (-7%) and serious assault (-5%). In contrast, increases were reported among firearm offences (+11%), criminal harassment (+5%), all levels of sexual assault (+5%), and abduction (+1%).
Almost every province showed a decrease in the severity of violent crime reported by police in 2010. The only exception was in Newfoundland and Labrador, where police reported a 13% increase in the violent CSI. This increase was due primarily to a 37% increase in robbery. Despite a notable decrease from 2009, Manitoba (-8%) continued to report the highest violent CSI of all the provinces, while Prince Edward Island reported the lowest (Table 2b, Chart 3).
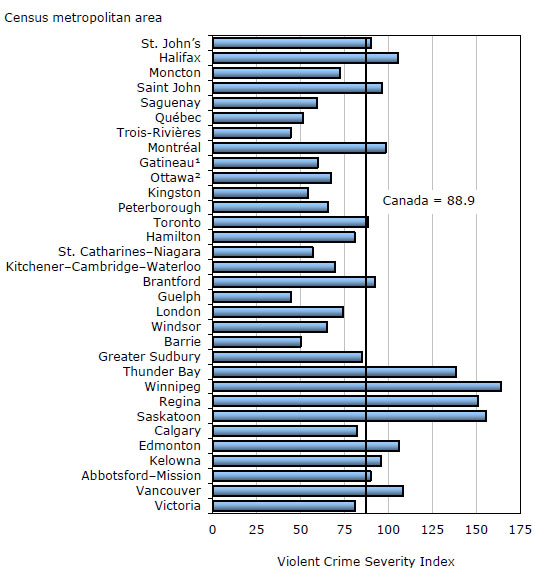
Similar to previous years, Winnipeg reported the highest violent CSI among the census metropolitan areas, despite experiencing a 13% drop since 2009 (Table 3, Chart 5). Many other CMAs also reported substantial decreases in violent crime severity, the largest of which were in Abbotsford–Mission (-24%), Kingston (-22%) and Gatineau (-20%). In contrast, the largest increase was in St. John's (+29%).
Chart 5
Police-reported violent Crime Severity Index, by census metropolitan area, 2010
1. Gatineau refers to the Quebec part of the Ottawa–Gatineau CMA.
2. Ottawa refers to the Ontario part of the Ottawa–Gatineau CMA.
Note: The Oshawa census metropolitan area (CMA) is excluded from this chart due to the incongruity between the police service jurisdictional boundaries and the CMA boundaries.
The Sherbrooke CMA is excluded due to the unavailability of data in 2010.
Source: Statistics Canada, Canadian Centre for Justice Statistics, Uniform Crime Reporting Survey.
Homicide rate reaches its lowest point since the mid–1960s
Homicide is one of the few types of violent crime that almost invariably comes to the attention of police and, as such, is generally recognized as a country's barometer of violence (Marshall and Block 2004). Following a period of relative stability over the past decade, the homicide rate fell 10% in 2010 (Chart 6). Police reported 554 homicides in 2010 (Table 4), 56 fewer than the year before, marking the lowest homicide rate in Canada since 1966.
Chart 6
Attempted murder and homicide, police-reported rates, Canada, 1980 to 2010
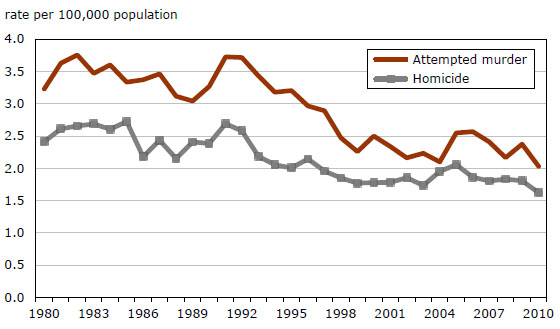
Source: Statistics Canada, Canadian Centre for Justice Statistics, Uniform Crime Reporting Survey.
The drop in homicide was driven primarily by a decrease in British Columbia (Table 5). With 35 fewer homicides in 2010 than in 2009, the rate in British Columbia was at its lowest point since recording began in the early 1960s. Quebec's rate was also at its lowest point since the 1960s, continuing the gradual decline seen in this province over the past 25 years.
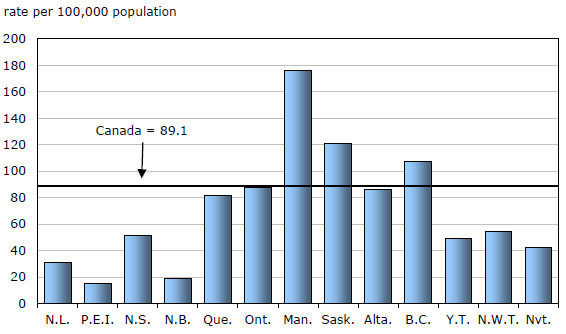
Although there were fewer homicides in Manitoba in 2010 compared to the previous year, the province reported the highest homicide rate among all provinces for the fourth consecutive year (Chart 7).
Chart 7
Homicide, police-reported rate, by province and territory, 2010
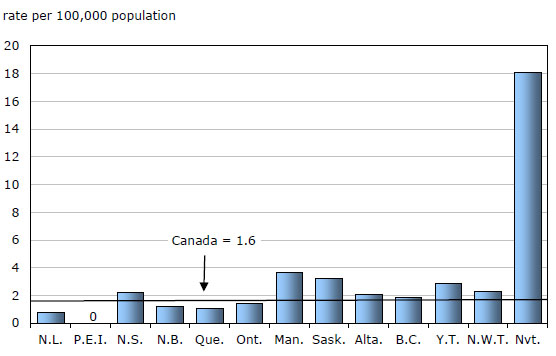
Source: Statistics Canada, Canadian Centre for Justice Statistics, Uniform Crime Reporting Survey.
With 5 homicides in 2010, Thunder Bay reported the highest homicide rate among all CMAs. The next highest rates were in Saskatoon and Regina (Table 6).
For the first time since CMA statistics became available in 1981, Windsor reported no homicides. There were also no homicides in Trois-Rivières, Saguenay and Guelph. In addition, with 36 homicides, the 2010 rate in Vancouver reached its lowest level since CMA statistics became available.
Similar to homicide, the number of attempted murders also declined in 2010, down 14% from the previous year. Police reported 693 attempted murders, 108 fewer than in 2009, marking the lowest rate for this offence in more than 30 years. While the rate of attempted murder has remained higher than the rate of homicide since the 1980s, these two offences have continually displayed similar trends over time (Chart 6).
Aggravated assault and assault with a weapon decrease in 2010
In general, assaults are the most common type of violent crime committed in Canada. In 2010, police reported just under 250,000 assaults, accounting for almost 6 in 10 violent crimes. Of these, most were classified as common assaults (level 1), the least serious form in which little or no injury was caused to the victim. Over the past decade, common assaults have gradually declined, including a 5% decrease in 2010.
There are two other more serious types of assault, namely, assault with a weapon or causing bodily harm (level 2) and aggravated assault whereby the victim is wounded, maimed or disfigured (level 3). Following a 25-year period during which there was an upward trend in the rate of level 2 and 3 assaults, the combined rate in 2010 dropped for the third year in a row, down 5% from the previous year (Chart 8).
Chart 8
Serious assault (levels 2 and 3), police-reported rate, Canada, 1983 to 2010
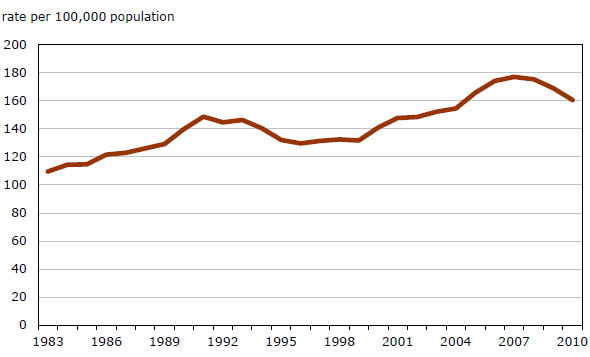
Note: Trend data begin in 1983 when legislation affecting the classification of assault came into effect.
Source: Statistics Canada, Canadian Centre for Justice Statistics, Uniform Crime Reporting Survey.
Saskatchewan and Manitoba reported the highest rates of serious assault (levels 2 and 3) among the provinces, with rates more than double those in most other provinces (Table 5). With the exception of Prince Edward Island (+6%) and Quebec (which remained stable), every province reported a decrease in the rate of serious assault (levels 2 and 3) in 2010, with Nova Scotia (-21%) and New Brunswick (-15%) recording the largest declines.
Another type of assault involves those against police officers.2 Assaults of this nature have been steadily rising over the past 10 years, including a 45% increase in 2010.
Recent changes in the rates of assault may be partially explained by the introduction of legislation in 2009 which created new categories for level 2 and 3 assaults against police officers. Incidents that may have been previously counted as level 2 and 3 assault in general may now be classified as an assault against a police officer. As such, comparisons of these data to previous years should be interpreted with caution.
Police report an increase in sexual assaults for the first time since 2005
Similar to physical assaults, sexual assaults are also differentiated based on the severity of the incident. Police reported over 22,000 sexual assaults in 2010, the vast majority (97%) of which were classified as level 1, the least serious of the three forms of sexual assault (Table 4).
For the first time since 2005, police reported an increase in the rate of sexual assault, up by 5% overall. While increases were seen among all three levels, the rise in the overall rate was driven primarily by an increase in level 1 sexual assaults.
It should be noted that police-reported data likely under-estimate the true extent of sexual assault in Canada, as these types of offences are particularly unlikely to be reported to police. According to self-reported victimization data from the most recent General Social Survey, close to 9 in 10 sexual assaults were never brought to the attention of the police (Perreault and Brennan 2010). The most common reasons for not reporting sexual offences to police include feeling that the incident was not important enough, feeling that it was a private matter and dealing with the situation in another way (Statistics Canada 2011).
Police-reported robbery rates continue to decline
The rate of robbery continued to decline in 2010, continuing the general downward trend seen over the past decade (Chart 9). Overall, police reported just over 30,000 robberies, down 7% from 2009.
Chart 9
Robbery, police-reported rate, Canada, 1980 to 2010
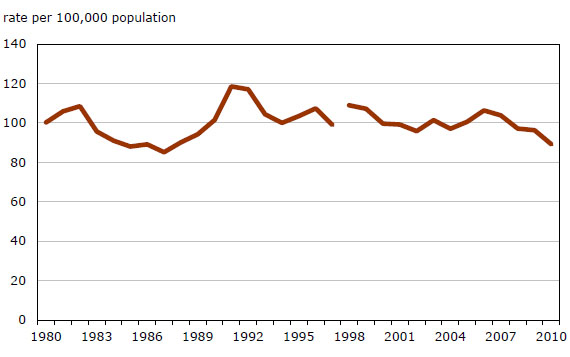
Note: Revisions have been applied to robbery data back to 1998. As a result, there is a break in the data series between 1997 and 1998.
Source: Statistics Canada, Canadian Centre for Justice Statistics, Uniform Crime Reporting Survey.
Police-reported robbery rates declined or remained stable across most of the country, with the exception of Newfoundland and Labrador, Prince Edward Island, the Yukon and the Northwest Territories. Unlike other forms of violent crime, robbery rates in the territories have historically been among the lowest in the country. This continued to be the case in 2010, despite increases in the Northwest Territories and Yukon (Chart 10).
Chart 10
Robbery, police-reported rate, by province and territory, 2010
Source: Statistics Canada, Canadian Centre for Justice Statistics, Uniform Crime Reporting Survey.
Overall, the majority of Canada's census metropolitan areas reported decreases in robbery rates in 2010. Despite a 13% drop in 2010, Winnipeg continued to have the highest rate of robbery in the country. Of the CMAs that reported an increase in robbery rates, St. John's and Brantford saw the highest jumps, at over 25% from the year before (Table 6).
Non-violent crime
Severity of non-violent crime continues to decrease
Similar to previous years, most (79%) crimes reported by police in 2010 were non-violent in nature. Theft under $5,000, mischief, and break and enters accounted for close to two-thirds of all non-violent offences.
Non-violent crime includes both property offences and other non-violent Criminal Code offences. In 2010, the rate of property crime decreased by 6%, marking the seventh consecutive decline while the rate of other Criminal Code offences remained stable. The severity of non-violent crime fell 6% over the previous year and was 27% lower than a decade ago.
Every province showed a decrease in the severity of non–violent crime in 2010, with the exception of Newfoundland and Labrador (+10%), Nova Scotia (+2%) and Prince Edward Island (+1%). Saskatchewan continued to report the highest non-violent CSI, while Ontario continued to report the lowest (Table 2b).
Police-reported break-ins continue to decline
With close to 200,000 break-ins in 2010, this offence was one of the most common property crimes reported by police, accounting for 15% of all property-related incidents. The rate of break-ins has steadily declined since peaking in the 1990's (Chart 11). More specifically, between 2000 and 2010, the rate dropped by 40%, including a 6% decline between 2009 and 2010 (Table 4).
Chart 11
Break and enter and motor vehicle theft, police-reported rates, Canada, 1980 to 2010
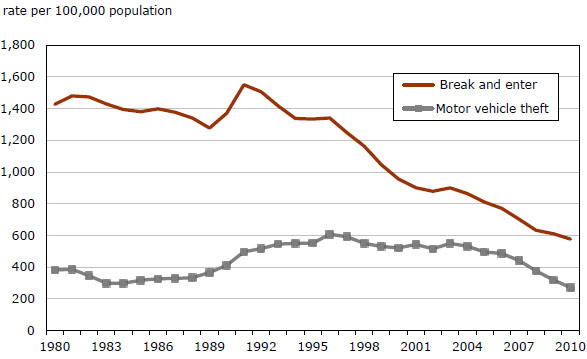
Source: Statistics Canada, Canadian Centre for Justice Statistics, Uniform Crime Reporting Survey.
The decrease in break-ins may be partially explained by an increase in the use of home security devices, such as alarm systems and motion detectors (Gannon and Taylor-Butts 2006). Moreover, it is also possible that rising insurance deductibles could result in fewer incidents being reported to police (Fedorowycz 2004).
In 2010, 6 in 10 (61%) break-ins were residential, while 28% were commercial and 11% were at another location such as a school, shed or detached garage. Break-ins to residences decreased by 4% while break-ins to businesses declined by 13%.
For the most part, the rate of breaks-ins decreased across the country, with the exception of the Atlantic provinces, each of which saw an increase from the previous year. Among the provinces, Saskatchewan continued to report the highest rate of break-ins, while Ontario reported the lowest (Chart 12).
Chart 12
Break and enter, police-reported rate, by province and territory, 2010
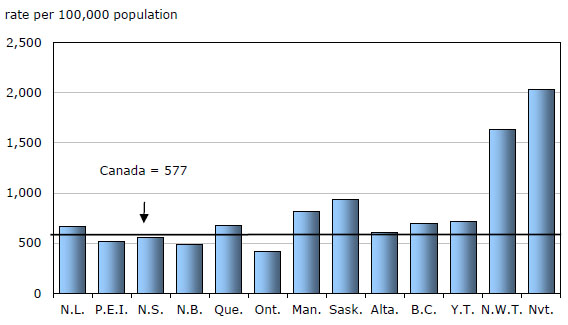
Source: Statistics Canada, Canadian Centre for Justice Statistics, Uniform Crime Reporting Survey.
Among CMAs, Saskatoon reported the highest rate of break-ins, despite experiencing a slight decline from 2009 (-2%). For the third year in a row, Toronto reported the lowest rate of break-ins. Unlike the overall decline in the rate of break and enter seen at the national level, a number of CMAs reported increases, with the largest in Greater Sudbury (45%) (Table 6).
Motor vehicle thefts decline for 7th consecutive year
Overall, police reported close to 93,000 motor vehicle thefts in 2010, or roughly 254 stolen vehicles each day. The rate of motor vehicle theft has been gradually declining since peaking in the mid-1990s. In 2010, the rate of motor vehicle theft was 15% lower than the year before and 48% lower than 10 years earlier (Chart 11, Table 4).
The overall decrease in motor vehicle thefts may be partially attributed to the use of anti-theft devices such as car alarms, specialized task forces and targeted initiatives such as the "bait car" program (Dauvergne 2008).
Newfoundland and Labrador was the only province to report an increase in motor vehicle theft, up 30% from 2009 to 2010. Conversely, the largest decrease was reported in Prince Edward Island, down 30% (Table 5).
With a 15% drop in 2010, Manitoba did not lead the provinces in the rate of motor vehicle theft for the first time in more than a decade. Despite an 8% drop in 2010, Saskatchewan reported the highest rate of motor vehicle theft among the provinces, followed by Manitoba and Alberta (Chart 13).
Chart 13
Motor vehicle theft, police-reported rate, by province and territory, 2010
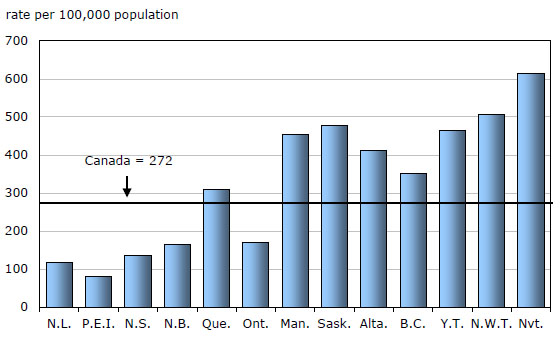
Source: Statistics Canada, Canadian Centre for Justice Statistics, Uniform Crime Reporting Survey.
The decrease in Manitoba was largely the result of fewer motor vehicle thefts in Winnipeg, where police recorded the fourth consecutive double-digit decrease in the rate. Decreases in Winnipeg coincide with the implementation of a multi-agency auto theft prevention strategy that began in 2005 (Linden and Munn-Venn 2008).
The drop in motor vehicle thefts occurred in virtually every CMA across the country. Only three CMAs reported an increase in 2010, most notably St. John's, up 66% (Table 6).
Police-reported incidents of impaired driving decrease for first time in four years
In 2010, police reported about 84,400 incidents of impaired driving (Table 4). The number of impaired driving offences reported by police can be influenced by many factors including legislative changes, enforcement practices (e.g. increased use of roadside checks) and changing attitudes on drinking and driving.
The 2010 rate of impaired driving was down 6% from the previous year, representing the first decrease in this offence since 2006 (Chart 14). The rate of impaired driving has been generally declining since peaking in 1981.
Chart 14
Drug offences and impaired driving, police-reported rates, Canada, 1980 to 2010
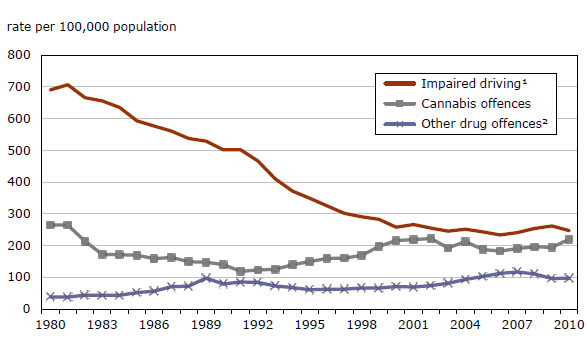
1. Includes alcohol and/or drug impaired operation of a vehicle, alcohol and/or drug impaired operation of a vehicle causing death or bodily harm, failure or refusal to comply with testing for the presence of alcohol or drugs and failure or refusal to provide a breath or blood sample.
2. Includes possession, trafficking or distribution of cocaine, heroin and all other illegal drugs not otherwise specified.
Source: Statistics Canada, Canadian Centre for Justice Statistics, Uniform Crime Reporting Survey.
Seven provinces and territories reported increases in their rate of impaired driving, most notably Newfoundland and Labrador where the rate rose by 22% from 2009 (Table 5). The largest decreases in rates were seen in Nunavut (-38%) and Manitoba (-18%).
The number of incidents of impaired driving in 2010 includes 160 incidents of impaired operation of a motor vehicle causing death, about the same as in 2009. It also includes 817 incidents of impaired operation of a motor vehicle causing bodily harm, 90 fewer than in 2009.
In July 2008, legislation came into effect enabling police to conduct mandatory roadside tests and assessments of suspected drug-impaired drivers. In 2010, police reported 1,616 incidents of drug-impaired driving (161 fewer than in 2009), accounting for about 2% of all impaired driving offences.
Drug offences continue to increase in 2010
Drug crimes fall under the authority of the Controlled Drugs and Substances Act and include possession, trafficking, importing, exporting and production-related offences. In 2010, there were almost 108,600 police-reported drug crimes in Canada (Table 4), about half (52%) of which were for possession of cannabis.
Between 2009 and 2010, the rate of drug crime increased 10%, continuing a general trend that began in the early 1990s (Chart 14). The rising trend in the rate of drug crime coincides with a decreasing trend in the overall crime rate. Previous research suggests that increases in drug crime rates may be influenced by police practices that focus more law enforcement efforts on addressing this type of offence when time, resources and priorities permit (Dauvergne 2009).
The overall increase in the rate of drug crime was driven by cannabis offences, up 13% between 2009 and 2010. The rate of cocaine offences fell for the third year in a row, down 5% from the year before.
As has been the case for many years, the highest provincial drug crime rate in 2010 was in British Columbia, particularly for cannabis offences. That said, the rates of cannabis-related crime in the Northwest Territories and Nunavut were about two and a half to three times higher than the rate in British Columbia (Table 5).
Youth crime
In Canada, separate justice systems exist for youth (12 to 17 years) and adults (18 years and older) accused of crime. The rationale for the two systems is based upon the premise that, although youth should be held accountable for the crimes they commit, they lack the maturity of adults to fully understand the nature of their actions (Department of Justice 2009). This section focuses on the nature and extent of crime committed by youth.
Youth less likely to be charged by police than in the past
Crimes tend to be disproportionately committed by youth and young adults (Chart 15). In 2010, the rate of those accused of a Criminal Code offence peaked at 18 years of age and generally decreased with increasing age.
Chart 15
Persons accused of crime, by age, Canada, 2010
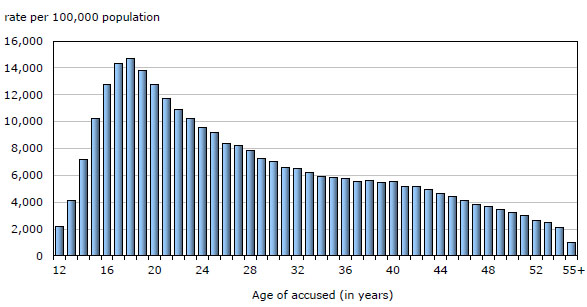
Note: Includes persons who were formally charged by police (or recommended for charging) as well as those who were dealt with by means other than the formal laying of a charge (e.g. diversion programs).
Source: Statistics Canada, Canadian Centre for Justice Statistics, Uniform Crime Reporting Survey.
Police identified nearly 153,000 youth accused of a crime in 2010. The number of youth accused includes those who were charged (or recommended for charging) by police and those who were dealt with by means other than the formal laying of a charge. Examples of those 'not charged' include youth diverted from the formal criminal justice system through the use of warnings, cautions and referrals to community programs.
Historically, youth charged (or recommended for charging) by police outnumbered those who were dealt with by means other than the formal laying of a charge. However, beginning in 2003, this trend reversed and, since then, more youth have been diverted than formally charged (Chart 16). For example, in 2010, 42% of youth accused were formally charged by police while the remaining 58% were diverted by other means. This change corresponds to the year in which the Youth Criminal Justice Act was implemented and clear objectives for the use of extrajudicial measures (i.e. informal sanctions) for youth were established.
Chart 16
Youth accused of crime, by clearance status, Canada, 2000 to 2010
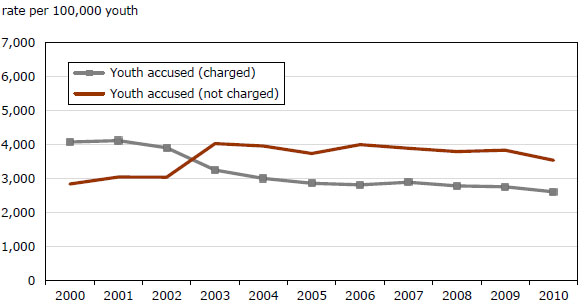
Source: Statistics Canada, Canadian Centre for Justice Statistics, Uniform Crime Reporting Survey.
Youth crime declines in 2010
Similar to the trend in overall crime, the rate of crime committed by youth has been generally declining over the past decade. The 2010 youth crime rate fell 7% from the year before and was 11% lower than a decade ago (Table 7a).
The severity of youth crime has also declined over the past 10 years, including a 6% drop in 2010 (Chart 17, Table 7b). However, the severity of youth violent crime has not seen the same decrease. Despite a 4% drop between 2009 and 2010, the youth violent CSI was 5% higher than in 2000.
Chart 17
Police-reported youth crime severity indexes, Canada, 2000 to 2010
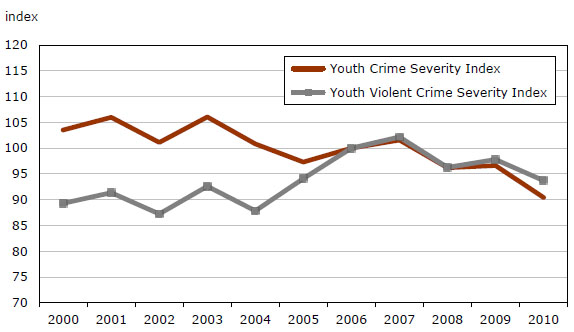
Note: Indexes have been standardized to a base year of 2006 which is equal to 100.
Source: Statistics Canada, Canadian Centre for Justice Statistics, Uniform Crime Reporting Survey.
There were 56 youth accused of homicide in 2010, 23 fewer than in 2009, resulting in a 29% drop in the rate. Declines were also seen in the rates of youth accused of motor vehicle thefts (-14%), serious assault (-12%) and break–ins (-10%) (Table 8). Robbery, up 2%, was one of the few crimes committed by youth to increase in 2010.
Decreases in the severity of youth crime in 2010 were reported in every province and territory without exception. The youth CSI was lowest in Quebec, followed by Prince Edward Island and British Columbia (Table 9). The rate of youth crime also declined across the country with the exception of the Northwest Territories and Nunavut which each reported small increases.
Factors affecting police-reported crime statistics
Many factors can influence police-reported crime statistics. These may include, though are certainly not limited to, changes in various demographic, social and economic factors; public reporting practices to police; technological advancements; legislative amendments; and local police service policies and practices.
More specifically, demographic changes in the age structure of the population, particularly among higher-risk (15 to 24 years) and lower-risk (over 50 years) offender groups can influence the volume of crime that is committed (Blonigen 2010). Other social and economic factors such as shifts in inflation, alcohol consumption and unemployment rates have also been found to be associated with certain crime patterns (Pottie-Bunge, Johnson and Baldé 2005). Some studies have found an association between neighbourhood crime rates and access to socio-economic resources (Charron 2009; Savoie 2008).
Societal responses and perceptions of certain crimes, such as sexual assault or spousal violence, can also lead to differences in reporting rates to police (Bowles et al. 2009). Also, technological change can create new opportunities for crime or even new types of crime (e.g. cyber crime) (Nuth 2008). Similarly, changes to the criminal justice system, such as the introduction of a new offence, can impact the number of police-reported criminal incidents.
Differences in local police service policies and procedures can also affect crime statistics. Some police services maintain call centres to receive and record criminal incidents, while others require victims to report crimes in person. The ease of public reporting can impact whether a criminal incident becomes known to police and subsequently reported to Statistics Canada through the UCR Survey.
Summary
The downward trend in police-reported crime continued in 2010 with decreases reported across the country, with the exception of Newfoundland and Labrador, the Northwest Territories and Nunavut. Canada's crime rate was at its lowest point since the early 1970s while the severity of crime was at its lowest point since 1998, the first year in which data for this measure are available. Police reported decreases across most crime categories, with few exceptions. The homicide rate, considered to be a country's barometer of violence, was at its lowest point since the mid-1960s. Youth crime also fell in 2010 in both volume and severity.
Data source
Uniform Crime Reporting (UCR) Survey
The Uniform Crime Reporting (UCR) Survey was established in 1962 with the co-operation and assistance of the Canadian Association of Chiefs of Police. The survey is a compilation of police-reported crimes that have been substantiated through investigation from all federal, provincial and municipal police services in Canada.
Coverage of the UCR aggregate data reflects virtually 100% of the total caseload for all police services in Canada. One incident can involve multiple offences. Counts presented in this article are based upon the most serious offence in the incident in order to allow for enhanced comparability among police services. Counts based upon all violations are available upon request.
Each year, the UCR database is "frozen" at the end of May for the production of crime statistics for the preceding calendar year. However, police services continue to send updated data to Statistics Canada after this date for incidents that occurred in previous years. Generally, these revisions constitute new accused records, as incidents are solved and accused persons are identified by police. However, in some cases, new incidents may be added and previously reported incidents may be deleted as new information becomes known.
Revisions are accepted for a one-year period after the data are initially released. For example, when the 2010 crime statistics are released, the 2009 data are updated with any revisions that have been made between May 2010 and May 2011. The data are revised only once and are then permanently frozen.
Over the past 10 years, the number of incidents in the previous year has been revised downward three times and upward seven times, with an average change of 0.2%. For accused persons, there has been an average upward revision of about 1% to the previous year's data.
Detailed data tables
Table 1a Police-reported crime rate, Canada, 2000 to 2010
Table 1b Police-reported crime severity indexes, Canada, 2000 to 2010
Table 2a Police-reported crime rate, by province and territory, 2010
Table 2b Police-reported crime severity indexes, by province and territory, 2010
Table 3 Police-reported crime severity indexes, by census metropolitan area, 2010
Table 4 Police-reported crime for selected offences, Canada, 2009 and 2010
Table 5 Police-reported crime for selected offences, by province and territory, 2010
Table 6 Police-reported crime for selected offences, by census metropolitan area, 2010
Table 7a Youth accused of police-reported crime, Canada, 2000 to 2010
Table 7b Police-reported youth crime severity indexes, Canada, 2000 to 2010
Table 8 Police-reported youth crime for selected offences, by province and territory, 2010
Table 9 Police-reported youth crime severity indexes, by province and territory, 2010
References
Babyak, Colin, Asma Alavi, Krista Collins, Amanda Halladay and Dawn Tapper. 2009. The Methodology of the Police-Reported Crime Severity Index. Statistics Canada, Household Surveys Methods Division. HSMD-2009-006E/F. Ottawa.
Blonigen, DM. 2010. "Explaining the relationship between age and crime: Contributions from the developmental literature on personality." Clinical psychology review. Vol. 30, no. 1. p. 89-100.
Bowles, Roger, Marcia Garcia Reyes and Nuno Garoupa. 2009. "Crime reporting decisions and the costs of crime." European Journal on Criminal Policy and Research. Vol. 15, no. 4. p. 365-377.
Charron, Mathieu. 2009. Neighbourhood characteristics and the distribution of police-reported crime in the city of Toronto. Statistics Canada Catalogue no. 85-561-MIE. Ottawa. Crime and Justice Research Paper Series, no. 18.
(accessed on May 6, 2011).
Dauvergne, Mia. 2009. "Trends in police–reported drug offences in Canada." Juristat. Vol. 29, no. 2. Statistics Canada Catalogue no. 85-002-X.
(accessed May 6, 2011).
Dauvergne, Mia. 2008. "Motor vehicle theft in Canada, 2007." Juristat. Vol. 28, no. 10. Statistics Canada Catalogue no. 85-002-X.
(accessed on May 6, 2011).
Department of Justice, 2009. "The Youth Criminal Justice Act: Summary and background". (accessed on May 6, 2011).
Fedorowycz, Orest. 2004. "Breaking and entering in Canada–2002." Juristat. Vol. 24, no. 5. Statistics Canada Catalogue no. 85-002-XIE.
(accessed on May 6, 2011).
Gannon, Maire and Andrea Taylor-Butts. 2006. Canadians' use of crime prevention measures, 2004. Statistics Canada Catalogue no. 85F0033MIE. Ottawa. Canadian Centre for Justice Statistics Profile Series, no. 12.
(accessed on May 6, 2011).
Linden, Rick and Trefor Munn-Venn. 2008. Making Communities Safer: Lessons Learned Combating Auto Theft in Winnipeg. Conference Board of Canada, National Security and Public Safety. Ottawa.
Marshall, Ineke and Carolyn Block. 2004. "Maximizing the availability of cross-national data on homicide." Homicide Studies. Vol. 8, no. 3. p. 267-310.
Nuth, Maryke. 2008. "Taking advantage of new technologies: For and against crime." Computer Law and Security Report. Vol. 24, no. 5. p. 437-446.
Perreault, Samuel and Shannon Brennan. 2010. "Criminal victimization in Canada, 2009." Juristat. Vol. 30, no. 2. Statistics Canada Catalogue no. 85-002-X.
(accessed May 6, 2011).
Pottie-Bunge, Valerie, Holly Johnson and Thierno Baldé. 2005. Exploring crime patterns in Canada. Statistics Canada Catalogue no. 85-561-MIE. Ottawa.Crime and Justice Research Paper Series, no. 5.
(accessed on May 6, 2011).
Savoie, Josée. 2008. Neighbourhood characteristics and the distribution of crime: Edmonton, Halifax and Thunder Bay. Statistics Canada Catalogue no. 85-561-MIE. Ottawa.Crime and Justice Research Paper Series, no. 10.
(accessed on May 6, 2011).
Statistics Canada, 2011. Special tabulation, based on 2009 General Social Survey.
Statistics Canada. 2011. "Crime Severity Index values for 238 police services policing communities over 10,000 population, 2010". July 21, 2011.
(accessed on July 21, 2011).
Wallace, Marnie, John Turner, Colin Babyak and Anthony Matarazzo. 2009. Measuring Crime in Canada: Introducing the Crime Severity Index and Improvements to the Uniform Crime Reporting Survey. Statistics Canada Catalogue no. 85-004-X. Ottawa.
(accessed on May 6, 2011).
Notes
1. A census metropolitan area (CMA) consists of one or more neighbouring municipalities situated around a major urban core. A CMA must have a total population of at least 100,000 of which 50,000 or more live in the urban core. To be included in the CMA, other adjacent municipalities must have a high degree of integration with the central urban area, as measured by commuting flows derived from census data. A CMA typically comprises more than one police service.
2.Includes any person employed for the preservation and maintenance of the public peace or for the service or execution of civil process, such as police officers, wardens, bailiff constables or mayors.
- Date modified: