
4 Data exploration
4.7 Answers
Text begins
Topic navigation
-
- This is a continuous variable.
- This is a discrete variable.
- This is a discrete variable.
- This is a continuous variable.
- The exact age is a continuous variable, but age is often rounded down to the closest integer. In this case, it would be a discrete variable.
- This is a discrete variable.
- This is a continuous variable.
- This is a continuous variable.
- This is a continuous variable.
- This is a discrete variable.
-
-
Table 4.7.1
Answer for 2a
Table summary
This table displays the results of Answer for 2a. The information is grouped by Number of customers (x) (appearing as row headers), Frequency (f) (appearing as column headers).Number of customers (x) Frequency (f) 20 2 21 7 22 4 23 3 24 5 25 2 26 2 Total 25 - The observation that occurs the most frequently is 21.
-
Table 4.7.2
Answer for 2c
Table summary
This table displays the results of Answer for 2c. The information is grouped by Number of customers (x) (appearing as row headers), Frequency (f), Relative frequency and Percentage frequency (appearing as column headers).Number of customers (x) Frequency (f) Relative frequency Percentage frequency 20 2 0.08 8 21 7 0.28 28 22 4 0.16 16 23 3 0.12 12 24 5 0.20 20 25 2 0.08 8 26 2 0.08 8 Total 25 1.00 100
-
-
- Answer:
Table 4.7.3
Answer for 3a
Table summary
This table displays the results of Answer for 3a. The information is grouped by Score (x) (appearing as row headers), Frequency (f) (appearing as column headers).Score (x) Frequency (f) 1 2 2 3 3 4 4 4 5 4 6 2 7 10 8 3 9 6 10 2 Total 40 - mean = 5.9, median = 7, mode = 7
- The median is higher than the mean because most of the observations have high values. The mean is influenced by the lower scores. The mode is equal to the median.
- Answer:
-
- 113
- 78
- 153, 182, 226.5, 260, 266
-
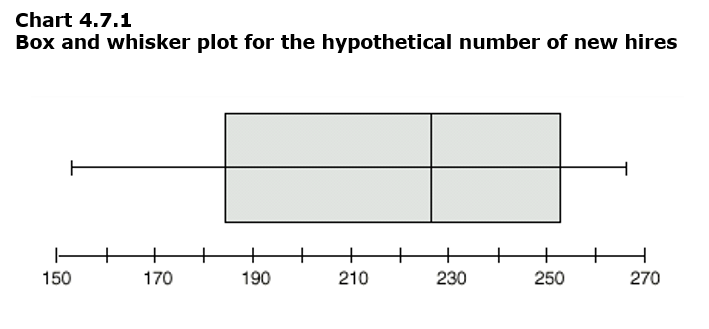
Data table for Chart 4.7.1
Data table for chart 4.7.1
Table summary
This table displays the results of Data table for chart 4.7.1. The information is grouped by Measurement (appearing as row headers), Value (appearing as column headers).Measurement Value Minimum 153 Lower quartile (Q1) 182 Median (Q2) 226.5 Upper quartile (Q3) 260 Maximum 266
- Date modified: