
What is a Digital Object Identifier (DOI)?
A Digital Object Identifier (DOI) is a unique alphanumeric string assigned to datasets and scientific journals. It provides a permanent access to our datasets and facilitates identification and citation within a digital environment.
How do I find the data I am used to getting from the previous website?
New products links redirect users from bookmarked content to the equivalent new content. Old catalogue product numbers and CANSIM table numbers are searchable and link to the latest content. As well, all site content, new and old, is available through the site search. A concordance table between old CANSIM table numbers and new table numbers is available online. A video is available for users to help them navigate the website and find the information they need: How to use the data tables.
How do I add/remove data from my data table?
- Once in your table, select 'Add/Remove data' button.
- Here you can add or remove items from selected tabs (for example, Geography), then selecting or deselecting the items you want added or removed.
- If you want to add or remove reference periods then select the 'Reference period' tab and select your time range.
- If you want to customize your layout then select the 'Customize Layout' tab and you will see you can change the layout of your table by selecting column or row for each one.
- When you are done with your changes, then select the 'Apply' button and your results will appear in the table below.
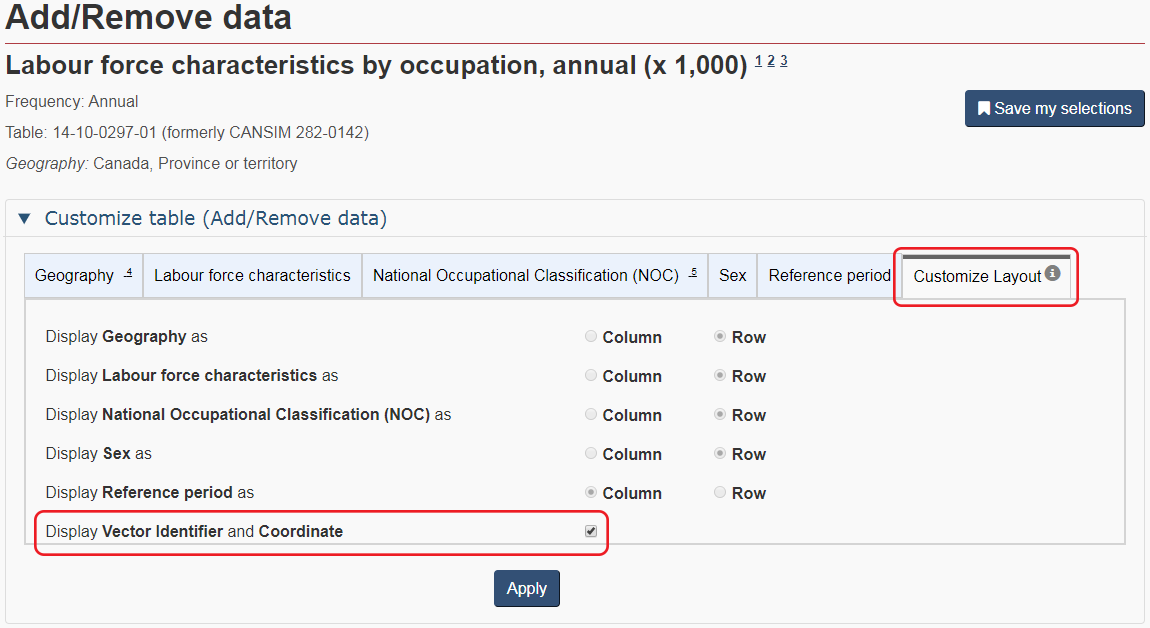
How do I display vectors and coordinates onscreen in data tables?
From the Add/Remove data feature, select the Customize Layout tab and then choose Display Vector Identifier and Coordinate. Please note that with this selection, the other customize layout options are disabled and all dimensions, except the reference period, are displayed as rows.
When you are done with your changes, then select the 'Apply' button and your results will appear in the table below.
How are data organized and presented on the site?
Statistics Canada data can be accessed under the subjects, data, geography, census program and surveys and statistical programs sections. They have been organized by sub-category, including tables and profiles. Data tables now offer a consistent presentation across all subjects.
The data table does not display the latest data – how do I refresh the data table to reflect the latest modifications or additions?
In the event that we experience difficulties with our web site and the presentation of our data tables, we suggest that you may have to click CNTL + F5 to refresh your display to update the data inside the table.
Where are the CANSIM tables?
CANSIM tables have been replaced by data tables with the same or similar content that have a consistent presentation and that will be dynamically updated as new results are released.
You can find a former CANSIM table by using the "Filter results by keyword(s)" option to type the number of the corresponding data table (e.g. 282-0023 and not CANSIM 282-0023). Redirects have also been implemented from former content to the equivalent new content. A concordance table between old CANSIM table numbers and new table numbers is available online.
Where are the Summary Tables?
Summary tables have been replaced by data tables with the same or similar content that have a consistent presentation and that will be dynamically updated upon the release of new results. For our most commonly used tables, redirects have been implemented from former content to the equivalent new content.
How have the table titles changed?
Simpler titles provide greater clarity about the primary focus and components of the table. Users can find additional information in the table descriptions.
Will the tables and other information products be assigned new identification numbers?
We now have new product identification numbers. The first 2 digits represent the main subject (for example, 12 for International Trade 12-XX-XXXX-XX). The next 2 digits represent the type of product. For example, all data tables are assigned a 10. Publications are assigned either a 20, 26, or 28. A public use micro-data file is assigned a 25.
For data tables and publications the subsequent 4 digits are used for internal purposes. They are assigned sequentially and in some specific cases, different views were created for the same data series. The final 2 digits at the end reflects this situation.
| Subject | Code |
|---|---|
| Agriculture and food | 32 |
| Business and consumer services and culture | 21 |
| Business performance and ownership | 33 |
| Children and youth | 42 |
| Construction | 34 |
| Crime and justice | 35 |
| Digital economy and society | 22 |
| Economic accounts | 36 |
| Education, training and learning | 37 |
| Energy | 25 |
| Environment | 38 |
| Families and households | 39 |
| Government | 10 |
| Health | 13 |
| Housing | 46 |
| Immigration and ethnocultural diversity | 43 |
| Income, pensions, spending and wealth | 11 |
| Indigenous peoples | 41 |
| International trade | 12 |
| Labour | 14 |
| Languages | 15 |
| Manufacturing | 16 |
| Population and demography | 17 |
| Prices and price indexes | 18 |
| Retail and wholesale | 20 |
| Science and technology | 27 |
| Seniors and aging | 44 |
| Society and community | 45 |
| Statistical methods | 19 |
| Transportation | 23 |
| Travel and tourism | 24 |
How has the data presentation changed from CANSIM?
Each table is initially presented with drop-down filters that allow users to quickly navigate to the data points of interest. Further customization is possible using the Add/remove data button. Users also have the option to pivot table rows and columns, using the customize layout button.
Where did the footnotes at the bottom of the CANSIM tables go?
Users are able to click on a note in a table to see the note content displayed as an overlay. When customizing a table, notes are now renumbered automatically. If the download as displayed function is used, all the notes will appear at the bottom of the table. When users download the entire dataset, all notes are provided in a separate metadata file which downloads along with the data file.
Which data download options are available?
Users are able to download data in different output formats. On the website, users have the option to download data as displayed on the screen, download an entire table or receive information through web data services. In terms of output formats to download an entire table, Statistics Canada is moving away from proprietary output formats (like Beyond 20/20 IVT format) to support non-proprietary, open, output formats such as CSV or SDMX.
Additional fields have been added to the output files. In addition, when users download the entire dataset, all notes are provided in a separate metadata file, which downloads along with the data file. The sort order within the data files has been modified from previous CSV outputs. Data will now be sorted by ref_date in ascending order. Should you require further details about upcoming changes to the output files, please e-mail statcan.od-services-bds-services.statcan@statcan.gc.ca.
Users can also retrieve data in English or French formats. CSV and Semicolon-Separated Values (SCSV) files are produced differently depending on the language. In French, the comma is used to indicate decimals; a different separator (a semicolon) must therefore be used. SCSV files retrieved in French will parse correctly only if the Regional Settings are set to French.
How do I download my data table?
- Once you have retrieved your table, you can download data multiple ways.
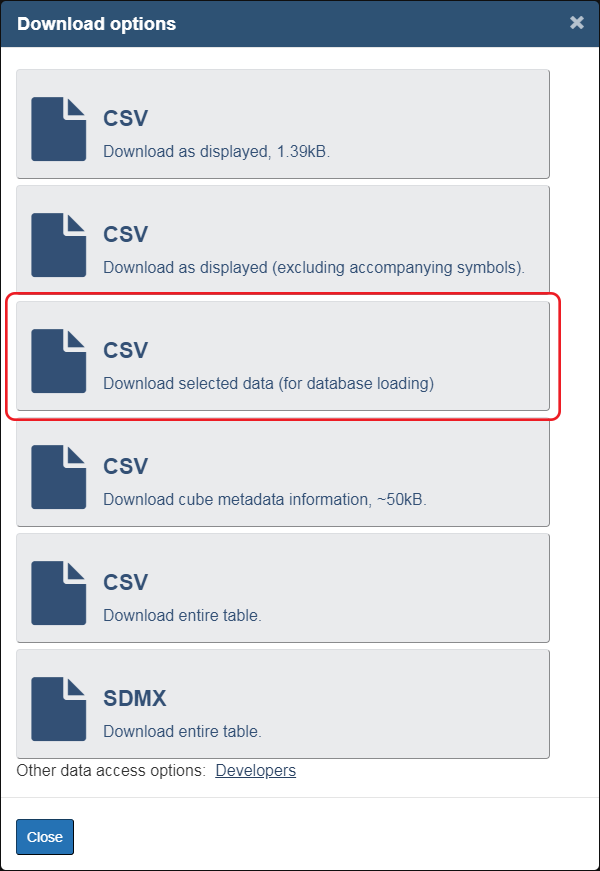
- If you want to download data when you have initially first retrieved your table, then select the 'Download options' button. You can Download as displayed (in .CSV format), Download as displayed (excluding accompanying symbols) (in .CSV format), Download entire table (in .CSV format), or Download entire table (in SDMX format).
- If you want to download data after you have used Add/Remove data, then select the 'Download options' button after you have selected the 'Apply' button and you will get the same download options to choose from.
- It is also possible to save a customized selection of a particular data table in the same format that is used for the "full table download" files.
- For more detailed information please see Full Table Download (CSV) User Guide.
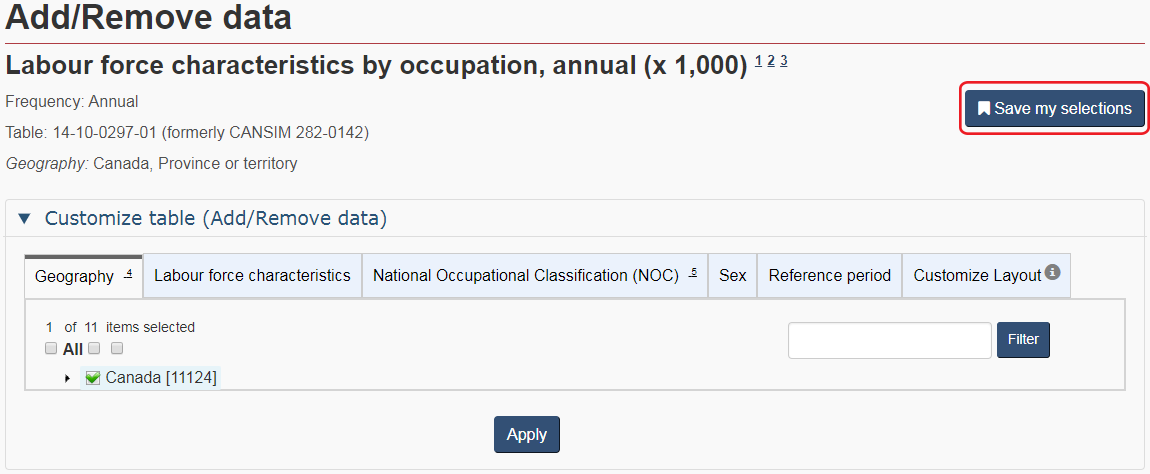
How do I save my selections after I have customized my data tables?
We have also added a feature which allows users to save or share their customized view of a data table. After using the drop down menus, or the more advance features found under 'add/remove data', users are now able to use this 'Save my selections' feature.
Are less data available to the public?
All the content previously residing on the official Statistics Canada website has been integrated into the new product line.
Where did the CANSIM manipulate feature go?
Given the very limited use of this functionality, the feature itself was discontinued but we will continue to support the most commonly used calculations, including the percentage change between years.
Is there a plan to offer dynamic charts and thematic maps?
Yes. More dynamic charts and thematic maps are planned for the future.
Are the data available through Open Government affected by changes to the Statistics Canada website?
Statistics Canada's new way of publishing data on its website automatically populates the federal Open Data portal, Open Government, with records from Statistics Canada's data products. Therefore, information like titles, descriptions and keywords are quickly transferred to Open Government and are found on the Open Data portal as soon as the data are published.
Are any new services being offered?
Web data services/API (Application Programming Interface) are now available for our complete data holdings. These services are available to sophisticated data users wanting to program a direct automated harvesting of data.
Are there any improvements to search?
New ways to search content include a "Filter results by keyword(s)" option and other filters to narrow down results.
Can I still find data using vectors?
It is still possible to search tables using former CANSIM vectors by typing the specific vector number(s) using the Search by vector feature located within the Data way in.
How can I search by vector?
- Select the Search by vector button
- Select the amount of reference periods you want from the 'Select latest reference period(s) drop down (1, 2, 3, 4, 5, 12, 25, 50, 100, 150, or 200).
- Enter in your vector number(s) including the letter 'v' which precedes the actual vector number. You can separate vector numbers by a comma (,).
- Select the search button.
- Your search results will appear below in a table format with the Vector, Frequency, Title, Description, Reference Period, Unit of Measure, Value and Source (Product ID).
- NOTE: The available download options are as displayed and no symbols, both available in .CSV format.
How do I find data for a particular region or area?
The Geography page lets users access data for particular regions or areas. A new mapping tool provides results from all data sources, where available, and covers all surveys and statistical programs including the census and the National Household Survey.
Where can I find related information about a product?
Publications such as data tables and catalogue pages have a section at the bottom called "Related information" where users will find what the product may replace, information about the source, related products and subject/keywords, etc.
What if I have questions or comments?
Please visit the Contact us page for any questions or comments.