
Modelling SARS-CoV-2 Dynamics to Forecast PPE Demand
By: Jihoon Choi, Deirdre Hennessy and Joel Barnes, Statistics Canada
Personal protective equipment (PPE) has become an important part of the lives of all Canadians as the pandemic changed the way we interact with one another and protect ourselves. The rapid rise of the novel coronavirus, severe acute respiratory syndrome coronavirus 2 (SARS-CoV-2), also referred to as COVID-19, has put unprecedented demands on the Government of Canada to provide timely, accurate and relevant information to inform decision-making around a host of public health issues, including PPE procurement and deployment of PPE to the provinces and territories.
The global pandemic caused by SARS-CoV-2, poses a serious public health concern for Canadians.Footnote 1 As of October 2021, over 1.71 million diagnosed cases have been reported in Canada, meaning it is essential that Canadians have access to PPE when they need it.
PPE refers to commodities such as masks, gloves and gowns that are worn to provide protection against potential exposure to infectious pathogens. The pandemic has brought severe stress to the supply chains for PPE in Canada, causing a significant disruption in supply among sectors where PPE stocks are essential (e.g., hospitals, long-term care facilities).Footnote 2 For this reason, forecasts on the pandemic trajectory and its effect on the supply, demand and inventory of PPE have become a crucial element in decision-making.Footnote 3, Footnote 4
Epidemiological models can contribute valuable insights in public health decision-making by generating a number of 'what-if' scenarios under different assumptions. Furthermore, it can help estimate how different public health intervention measures can affect the outcome of the epidemic (i.e. deciding the critical timing to introduce lockdowns/reopening in each provinces).Footnote 5 Different variations of epidemiological models exist and many of these are compartmental models where the population is divided into multiple compartments and are moved from one compartment to another at a defined rate.Footnote 6
The Susceptible-Infectious-Recovered (SIR) model is one of the most basic forms of a compartmental model (Figure 1). This model consists of three compartments, where S is the number of susceptible individuals, I is the number of infected individuals and R is the number of recovered (and immune) individuals.
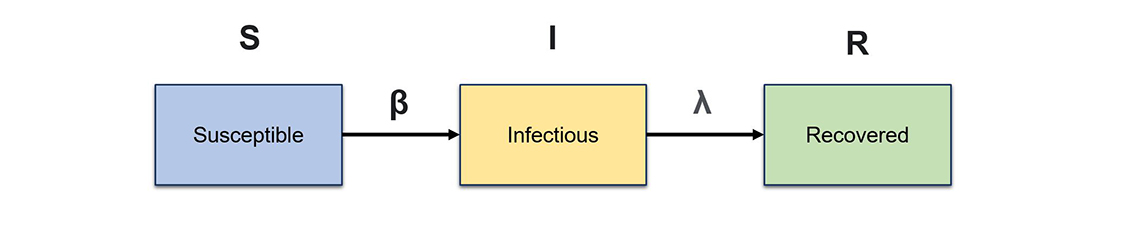
Figure 1 – Structure of a basic epidemiological model.
Description - Figure 1
The base structure of the SIR model. The initial population starts in the susceptible compartment and flows into the infectious compartment at an infection rate β, then moves into the recovered compartment at a recovery rate defined by λ.
Figure 1 shows the base structure of the SIR model. The initial population starts in the susceptible compartment and flows into the infectious compartment at an infection rate β, then moves into the recovered compartment at a recovery rate defined by λ.
The origin of compartmental models in epidemiology dates back to the early 20th century. Specifically, the foundation was built based on the theorem outlined by Ronald Ross, William Hamer, Anderson McKendrick and William Kermack, along with important influences from a statistical perspective by John Brownlee.Footnote 7 Since their development, compartmental models have proven useful in modelling for numerous communicable diseases, such as malaria and plague.Footnote 8, Footnote 9
As the SARS-CoV-2 outbreak became a serious public health concern for Canadians, Health Canada commissioned the Data Science Division (DScD) and the Health Analysis Division (HAD) at Statistics Canada to create an epidemiological model that could forecast the trajectories of the outbreak in Canadian provinces. The forecasted cases and hospitalizations produced from the epidemiological model are used in the PPE Project to estimate the PPE demand in various sectors across the provinces. The PPE Project aims to inform decisions related to procurement, allocation and domestic production investment in PPE through evidence-based reports on the current status and projections of PPE supply and demand, in diverse epidemiological scenarios.
Creating the initial model for PPE demand: Susceptible – Infected – Recovered – Death (SIRD) model
The initial SIRD model first used Bayesian methods to estimate the number of active infections in Canadian communities based on SARS-CoV-2 mortalities. The number of total SARS-CoV-2 infections (diagnosed and undiagnosed) were reverse-estimated from SARS-CoV-2 fatalities by province and territory, using a similar method to that used by Flaxman et al.Footnote 10 Estimated number of infections, deaths and recoveries were fed into a simple compartmental model, composed of four compartments. The first three compartments are equivalent to the base SIR model (Susceptible, Infected and Recovered), but this model has an additional compartment D, which represents the population in deceased state (Figure 2).
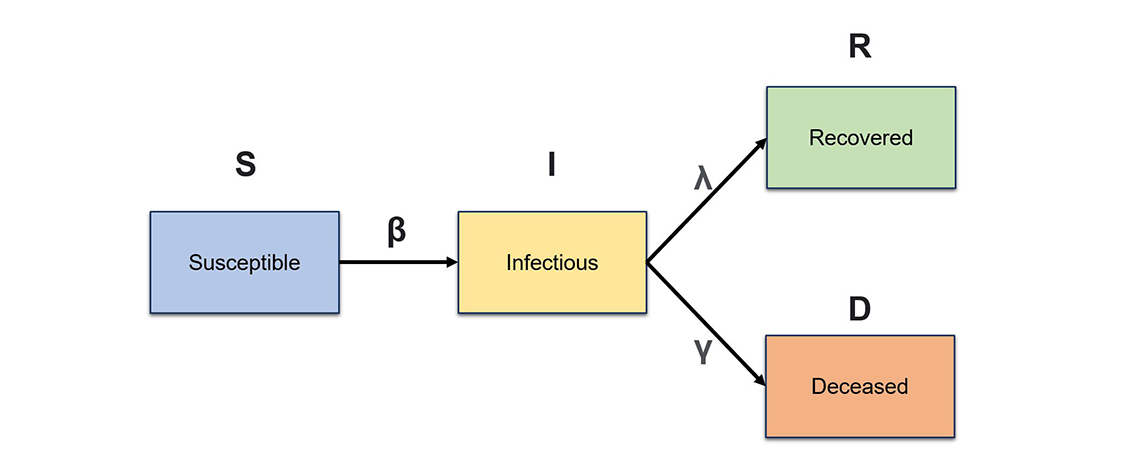
Figure 2 – Structure of a SIRD epidemiological model.
Description - Figure 2
The base structure of SIRD (Susceptible – Infected – Recovered – Death) model. The initial population starts in the susceptible compartment and flows into the infectious compartment at an infection rate β, then moves into the recovered compartment at a recovery rate defined by λ or into the deceased compartment at a mortality rate defined by γ.
Figure 2 shows the base structure of SIRD (Susceptible – Infected – Recovered – Death) model. The initial population starts in the susceptible compartment and flows into the infectious compartment at an infection rate β, then moves into the recovered compartment at a recovery rate defined by λ or into the deceased compartment at a mortality rate defined by γ.
This model also produced a dynamic historical Reproduction Number, R(t). The R(t) is an important concept in infectious disease epidemiology, providing information about the transmission potential of an infectious agent. In other words, it shows how contagious an infectious disease is at time t in the study population. Generally, if R(t) is greater than 1, the disease will start to propagate in the population, whereas if R(t) is less than 1, the number of new cases will decrease.
R(t) is often estimated from observing the number of new infections across a time period. However, the number of SARS-CoV-2 cases was not traced accurately in the beginning of the pandemic, due to a limitation in resources such as insufficient availability of testing kits.Footnote 11 As a workaround, the SIRD model estimated the historical R(t) from the number of SARS-CoV-2 fatalities, which was a much more reliable measure than actual case counts during the initial periods of the outbreak. An infection fatality rate (IFR) for SARS-CoV-2 from the research literature was used to backwards-compute the historical R(t).
To forecast the future R(t), the team generated different pandemic scenarios each with varying assumptions about public health intervention measures in effect:
- The SARS-CoV-2 containment scenario—attempts to model a situation where strict public health intervention measures are in place (i.e., lockdowns). Under this scenario, R(t) is always kept under 1.
- The Resurgence Best Estimate scenario—allows the epidemic to resurge in tandem with the reopening of the economy and allows the R(t) to stay high.
- The Peaks and Valleys Scenario—allows the epidemic to resurge in tandem with the reopening of the economy until hospital intensive care unit (ICU) occupancy reached 30% of the provincial maximum. Then an intervention plan is triggered to bring the R(t) back down to lockdown level.
The SIRD model was used as the main epidemiological model for the PPE project until the beginning of 2021. The model has shown decent accuracy in forecasting the pandemic during the initial phase of the outbreak. However, this model had a number of limitations. In particular, it did not take age structure of the population into account. These limitations led to the creation of another version of the epidemiological model with additional compartments that can take more complex characteristics of the pandemic into consideration.
The current model: Susceptible – Exposed – Infected – Recovered – Deceased – Vaccinated (SEIRDV) model
Early in the pandemic, DScD and HAD at Statistics Canada worked with the Public Health Agency of Canada (PHAC) to develop an age-structured, multi-compartmental SIR model. This collaboration yielded the SEIRDV model, which was adapted by the Statistics Canada PPE epidemiological team, in collaboration with Health Canada, for use in the main PPE demand and supply model. This model has been used as the main epidemiological model in the PPE project since January 2021 (Figure 3).
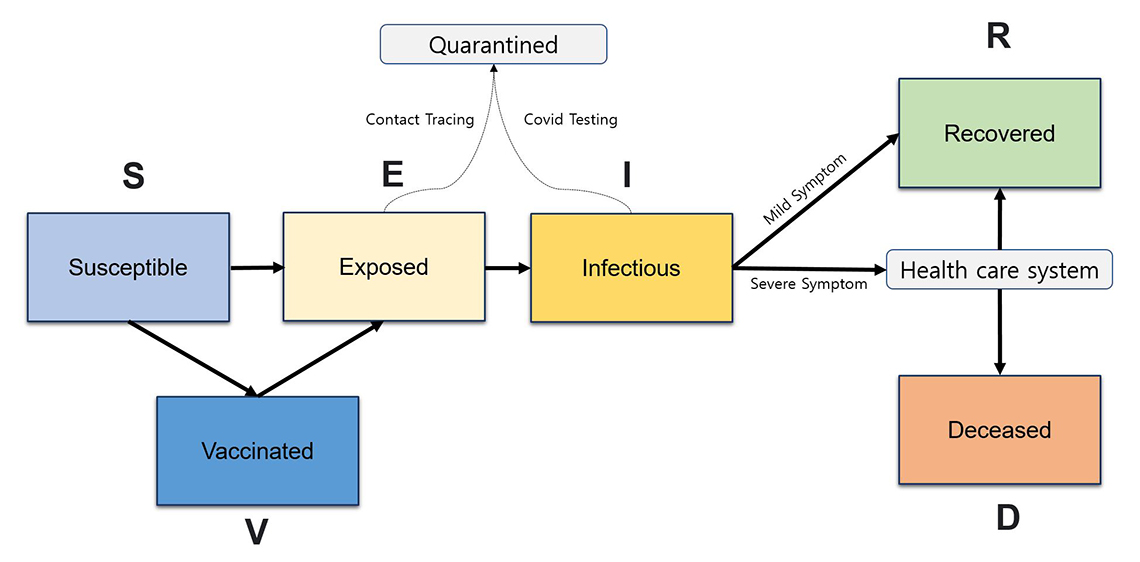
Figure 3 – Simplified structure of a SEIRDV epidemiological model.
Description - Figure 3
A simplified structure of the SEIRDV (Susceptible – Exposed – Infected – Recovered – Death – Vaccinated) model. The population starts in the susceptible compartment, and then can flow into exposed and infectious compartments upon contracting the disease. Individuals whose infections have been detected are sent to the quarantine path and will have a reduced likelihood of spreading the disease to others. Upon infection, individuals with severe symptoms will seek medical attention. The severely symptomatic population can end in two terminal states: deceased or recovered.
Figure 3 shows a simplified structure of the SEIRDV (Susceptible – Exposed – Infected – Recovered – Death – Vaccinated) model. The population starts in the susceptible compartment and then can flow into exposed and infectious compartments upon contracting the disease. Some of these infections are detected from contact-tracing efforts or SARS-CoV-2 testing. Individuals whose infections have been detected are sent to the quarantine path and will have a reduced likelihood of spreading the disease to others. Upon infection, individuals with severe symptoms will seek medical attention. The severely symptomatic population can end in two terminal states: deceased or recovered. People who are only mildly symptomatic or asymptomatic will flow into the recovered compartment over time. In addition, the population can be vaccinated in this model. If an individual is vaccinated, their chances of flowing into the infection compartments are reduced by the protection rate of the vaccine. Similarly, the vaccinated population has a reduced probability of developing severe cases, and therefore, of flowing into the health care system (i.e. Hospital/ICU).
The four major modifications made by introducing the SEIRDV model are:
1. The model allows the study population to be age stratified
In the SEIRDV model, the population is divided into six distinct age groups (0-9 years, 10-19 years, 20-39 years, 40-59 years, 60-74 years, 75+ years), which allows different parameters to be set for each age group and to take age-related differences into account.
For instance, reports show that younger age groups have a reduced likelihood of hospitalization and mortality compared to older age groups.Footnote 12 Since the SEIRDV model allows users to set different flow rates for each age group, it is capable of modelling this effect.
Similarly, certain age groups are known to interact at a higher frequency than others (i.e., parents with their children) and therefore have increased chances of transmitting the disease to each other. In the SEIRDV model, this effect can be taken into account by using an interaction matrix that models the average contact rate between two age groups.
2. Estimation of the transmission rate (β) has been improved
Instead of relying on a single measure, such as R(t), to estimate the transmission rate, the model now uses three different parameters to calculate the rate of transmission.
First is β, which in this model represents the "probability of transmission upon contact". This number is estimated from literature and calibrated in accordance with the dominant strain of SARS-CoV-2 in each province. This measure is multiplied by a contact matrix, which is a numeric matrix that illustrates the average number of contacts that people in each age group make with another age group. Lastly, a contact multiplier is applied to take variances in contact rates into account. When different public health intervention measures are in effect (e.g., lockdowns), the rate of contact among the population will change accordingly. These variances are captured by calibrating the contact-multiplier to the reported number of daily active cases in each province every week.
3. The effect of vaccination is taken into consideration
Two main effects of vaccination are a reduction in the stress on the health care system (by providing protection against developing a severe case requiring hospitalization) and transmission of the disease within the community (by providing protection against infection, ultimately promoting herd immunity). The current design of the SEIRDV model takes this into account by introducing a distinct vaccination pathway. The vaccinated population will flow into this pathway, where they will have reduced chances of contracting the disease as well as reduced likelihood of developing a severe symptom requiring hospitalization.
The model also takes into account the two-dose vaccination plan set out by the National Advisory Committee on Immunization. The vaccination data were retrieved from PHAC and COVID-19 Canada Open Data Working Group (CCODWG) to estimate the number of doses that can be given out each day per province. In addition, the different rates of protection given by the two-stage vaccination plan were modelled by dividing our vaccination path into four distinctive compartments. This process is summarized in Figure 4.
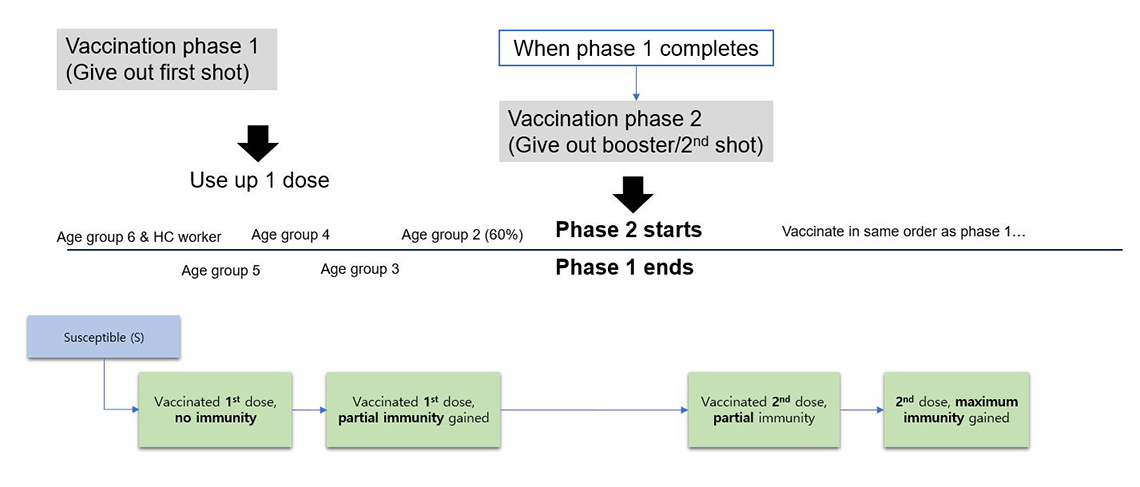
Figure 4 – Design of the vaccination compartment
Description - Figure 4
Demonstrates how a population is divided into age groups, with vaccines distributed from oldest to youngest with accommodation for some high risk groups of all ages. The groups flow through first and second doses on their way to full vaccination.
The study population is divided into six distinct age groups (0-9 years, 10-19 years, 20-39 years, 40-59 years, 60-74 years, 75+ years) and vaccines are distributed in the order of older to younger age groups, while distributing a small number of doses to an age group that represents the health care professionals in the early phase. Upon receiving the first dose, the freshly vaccinated population flows into the first vaccination compartment which represents the population who have received their vaccine but have not had the chance to develop any immunity yet. Then this population flows into the second vaccination compartment after a set period, at which point they develop a partial protection against SARS-CoV-2. The population stays in this compartment until phase 1 (i.e. giving out first dose) completes. Once phase 2 of the vaccination plan starts, the population flows into the third vaccination compartment where they receive their second dose, then flows into the last vaccination compartment where they develop the maximum immunity that they can gain from the vaccination.
4. Impact of variant of concern (VOC) can be modelled
A number of different strains of SARS-CoV-2 have been sequenced around the world as a result of viral mutation, some having shown higher rates of transmission or mortality.Footnote 13 These variants are called variants of concern (VOC) and became a crucial factor to consider in epidemiological modelling of SARS-CoV-2. The SEIRDV model is capable of modelling these by altering the probability of transmission (β) to model the increased transmission rate, as well as altering the flow into the hospitalization or the deceased compartment to model the effect of increased symptom-severity of the variant. Using this mechanism, the team has successfully modelled the effect of the B.1.1.7 (Alpha) variant in our model.
Conclusion
Through continuous development, enhancement and calibration efforts, the epidemiological model has yielded a valuable contribution in modelling the trend of the SARS-CoV-2 pandemic in Canada. Specifically, findings from this model have allowed the PPE Project to estimate the PPE demand across Canadian provinces to ensure that all sectors acquire sufficient PPE stocks in advance of large outbreaks.
Furthermore, this article demonstrates how applications of data science, combined with statistics, computer science and epidemiology, can be utilized in public health planning as well as decision making for resource requirements during the COVID-19 pandemic.
How was this achieved?
- By using open-source software
The SEIRDV model is programmed R and the core methodology of the model has been published in an open access journal (Assessing the impact of varying levels of case detection and contact tracing on COVID-19 transmission in Canada during lifting of restrictive closures using a dynamic compartmental model) and R package, which is available on the Statistics Canada GitHub account. - By adapting various development platforms to construct our model
The team used multiple platforms and programming languages for development, including: R and Python to develop the main model, SQL to construct and revise databases and tables, Power BI and R Shiny for visualization and product delivery and Azure Data Factory for pipeline construction and management. - By optimizing and automating the pipeline for maximum efficiency
All modelling tasks were parallelized to utilize the power of multi-core processing. The team also automated many of the procedures, including construction of reports, sensitivity analysis and quality assurance tests.
Areas of further study
Given that SARS-CoV-2 is still an on-going pandemic, there may be more work that needs to be done. Some potential future areas of study include:
- New variants
With the high rate of mutation observed in the SARS-CoV-2 strain, new variants are constantly sequenced around the world. While the effect of the B.1.1.7 variant has been considered in the model, there are still several other VOCs that may need to considered (e.g., Delta variant). The team is closely monitoring the spread of VOCs across the country to determine if other variants need to be taken into account in the model. - Waning immunity
Studies have shown that immunity gained from vaccination (or infection) does not last indefinitely. Immunity will wane over time, causing a progressive loss of protective antibodies. This phenomenon is called waning immunity. This will need to be taken into account in the model to prepare for a future scenario, such as when a large portion of the population will require another dose of vaccination to maintain their immunity.
The PPE epidemiological modelling team:
Jihoon Choi (DScD), Deirdre Hennessy (HAD), Joel Barnes (HAD).
Project team and contributors:
Rubab Arim, Statistics Canada; Kayle Hatt, Health Canada
- Date modified: