Monthly Survey of Food Services and Drinking Places: CVs for Total Sales by Geography - April 2026

CVs for Total sales by geography
GeographyMonth
202504202505202506202507202508202509202510202511202512202601202602202603202604
percentage
Canada0.130.150.050.050.060.060.080.070.090.120.100.110.18
Newfoundland and Labrador0.70.460.260.200.200.280.310.320.450.530.460.690.89
Prince Edward Island0.460.570.390.40.340.450.591.171.171.701.441.241.77
Nova Scotia0.640.430.200.170.190.240.250.600.430.380.360.840.69
New Brunswick0.390.330.240.190.210.350.390.820.360.470.411.040.75
Quebec0.490.220.080.080.170.150.270.170.180.280.240.260.33
Ontario0.190.330.090.070.090.100.130.120.160.200.160.160.22
Manitoba0.340.410.240.230.220.340.370.590.520.690.610.831.02
Saskatchewan0.410.360.390.540.260.400.350.690.460.531.111.301.69
Alberta0.320.320.150.190.160.160.170.200.230.320.210.280.57
British Columbia0.160.190.100.160.120.120.130.170.190.250.200.260.41
Yukon Territory0.981.200.911.031.071.321.642.062.182.842.742.753.68
Northwest Territories2.1716.362.511.181.291.171.292.172.342.842.602.6313.55
Nunavut62.264.172.142.6747.682.722.4064.641.902.852.593.883.73

Summary of the Evaluation of the Education Statistics Program

The Education Statistics Program (ESP) and the Canadian Centre for Education Statistics (CCES) were established to support the production of high-quality and comparable Canadian education data. The CCES provides several nationally and internationally comparable indicators used to inform policy development, support research and provide a clearer understanding of the state of education in Canada.

Because education is a provincial and territorial responsibility, pan-Canadian education statistics rely on coordination rather than centralized authority. The resulting governance model is collaborative and multi-layered, involving federal, provincial, territorial (FPT) and international partners. The CCES relies on these governance structures to set priorities, address methodological issues and guide emerging initiatives that shape the ESP's delivery.

The objective of the evaluation is to provide a neutral, evidence-based assessment of the ESP's ongoing relevance and performance, including how well the program meets evolving information needs and contributes to the availability of high-quality education-related statistical information. The scope covers statistical data and insights in five thematic areas: early childhood learning, elementary and secondary education, postsecondary education, adult learning, and integrated education information.

Key findings, considerations and recommendation

ESP coverage provides a comprehensive and coordinated picture of education in Canada and aligns closely with user needs. The ESP's statistical data and insights are widely viewed as useful, offering national-level information across all learning pillars from integrated data sources and platforms such as the Education and Labour Market Longitudinal Platform (ELMLP).  Ongoing collaboration with education partners also helps ensure alignment with evolving needs and priorities.

Some coverage gaps remain, particularly in areas requiring more disaggregated data. The ESP's ability to address these gaps is influenced by several factors, including its reliance on FPT-driven priorities and data availability, the variety of surveys funded by one sponsor (Employment and Social Development Canada), and data from other sources (e.g., the Census of Population), all of which limit the program's responsiveness to emerging or specialized needs. Nevertheless, targeted efforts and partnerships have enabled new statistical data. Given the strong interest in integrated information, further integration of data sources, particularly through the ELMLP, could enhance the relevance of education statistical data and insights.

Overall, the ESP continues to provide high-quality statistical information, though its effective use is affected by several factors consistent with broader trends observed in other official statistics programs. Jurisdictional differences in data collection and reporting, along with declining response rates for certain voluntary surveys, present comparability and accuracy challenges. Timeliness issues and the complexity of accessing information, particularly through the ELMLP, also limit broader use of data in planning, policy and program contexts.

Pan‑Canadian governance structures support collaboration but face constraints. Reduced activity within senior-level governance forums has limited opportunities for priority setting, and the ability to advance shared priorities is affected by differing jurisdictional capacities, mandates and authority levels. While progress has been made in some areas through working-level coordination, advancement is more limited for initiatives without established governance mechanisms, including those related to the ELMLP.

The CCES's involvement across the education and labour market domains positions it well to support coordination. However, when multiple divisions interact with the same stakeholders, roles and points of contact can be unclear. Strengthening internal coordination would help ensure a more consistent stakeholder experience.

Budget pressures and reliance on a single major cost-recovery funder create vulnerabilities for long-term planning and the ability to address emerging needs. The discontinuation of funded products has contributed to coverage gaps noted by users. Workforce sustainability, particularly in areas requiring specialized expertise, further highlight the importance of succession planning and knowledge transfer practices to maintain program continuity and resilience.

Management considerations

To help strengthen pan-Canadian governance and support a more responsive delivery of education-related statistical information, the evaluation identified a few considerations that the assistant chief statistician (ACS), Social, Health and Labour Statistics (Field 8), may wish to reflect on.

At the strategic level, opportunities were noted for the CCES to leverage its unique position to foster more effective coordination and information sharing across FPT partners. Strengthening these practices could help address evolving information needs, including those related to timeliness and data gaps. For instance, management could explore opportunities to support the Strategic Management Committee's governance role in ways that would allow emerging priorities and issues to be reviewed more regularly and reflected in strategic direction and oversight.

In addition, given upcoming organizational changes and some stakeholders' lack of clarity regarding the respective roles of multiple divisions, management may wish to consider measures to clarify key points of contact and reinforce cross-divisional coordination. These steps could support greater transparency and contribute to a more consistent stakeholder experience and understanding.

Recommendation

Given the ELMLP's potential to increase data sources, broaden and deepen coverage, expand partnerships and user groups, and diversify funding, a formal recommendation focused on strengthening the platform was identified.

The ACS of Field 8 should ensure that the ELMLP's governance, engagement and analytical capacity are strengthened. Key actions should include

  1. revisiting the establishment of a governance body (e.g., composition, operations) and updating it to ensure appropriate representation and fit for purpose
  2. improving data users' and stakeholders' awareness of, and engagement with, the ELMLP to further support platform use and data interpretation
  3. continuing to work with stakeholders to prioritize integrated and analytical products that reflect the needs and priorities of data users, such as longitudinal data.

Evaluation of the Education Statistics Program

Evaluation Division
March 2026

Table of contents

The report in short

The Education Statistics Program (ESP) and the Canadian Centre for Education Statistics (CCES) were established to support the production of high-quality and comparable Canadian education data. The CCES provides several nationally and internationally comparable indicators used to inform policy development, support research and provide a clearer understanding of the state of education in Canada.

Because education is a provincial and territorial responsibility, pan-Canadian education statistics rely on coordination rather than centralized authority. The resulting governance model is collaborative and multi-layered, involving federal, provincial, territorial (FPT) and international partners. The CCES relies on these governance structures to set priorities, address methodological issues and guide emerging initiatives that shape the ESP's delivery.

The objective of the evaluation is to provide a neutral, evidence-based assessment of the ESP's ongoing relevance and performance, including how well the program meets evolving information needs and contributes to the availability of high-quality education-related statistical information. The scope covers statistical data and insights in five thematic areas: early childhood learning, elementary and secondary education, postsecondary education, adult learning, and integrated education information.

Key findings, considerations and recommendation

ESP coverage provides a comprehensive and coordinated picture of education in Canada and aligns closely with user needs. The ESP's statistical data and insights are widely viewed as useful, offering national-level information across all learning pillars from integrated data sources and platforms such as the Education and Labour Market Longitudinal Platform (ELMLP).Footnote 1 Ongoing collaboration with education partners also helps ensure alignment with evolving needs and priorities.

Some coverage gaps remain, particularly in areas requiring more disaggregated data. The ESP's ability to address these gaps is influenced by several factors, including its reliance on FPT-driven priorities and data availability, the variety of surveys funded by one sponsor (Employment and Social Development Canada), and data from other sources (e.g., the Census of Population), all of which limit the program's responsiveness to emerging or specialized needs. Nevertheless, targeted efforts and partnerships have enabled new statistical data. Given the strong interest in integrated information, further integration of data sources, particularly through the ELMLP, could enhance the relevance of education statistical data and insights.

Overall, the ESP continues to provide high-quality statistical information, though its effective use is affected by several factors consistent with broader trends observed in other official statistics programs. Jurisdictional differences in data collection and reporting, along with declining response rates for certain voluntary surveys, present comparability and accuracy challenges. Timeliness issues and the complexity of accessing information, particularly through the ELMLP, also limit broader use of data in planning, policy and program contexts.

Pan‑Canadian governance structures support collaboration but face constraints. Reduced activity within senior-level governance forums has limited opportunities for priority setting, and the ability to advance shared priorities is affected by differing jurisdictional capacities, mandates and authority levels. While progress has been made in some areas through working-level coordination, advancement is more limited for initiatives without established governance mechanisms, including those related to the ELMLP.

The CCES's involvement across the education and labour market domains positions it well to support coordination. However, when multiple divisions interact with the same stakeholders, roles and points of contact can be unclear. Strengthening internal coordination would help ensure a more consistent stakeholder experience.

Budget pressures and reliance on a single major cost-recovery funder create vulnerabilities for long-term planning and the ability to address emerging needs. The discontinuation of funded products has contributed to coverage gaps noted by users. Workforce sustainability, particularly in areas requiring specialized expertise, further highlight the importance of succession planning and knowledge transfer practices to maintain program continuity and resilience.

Management considerations

To help strengthen pan-Canadian governance and support a more responsive delivery of education-related statistical information, the evaluation identified a few considerations that the assistant chief statistician (ACS), Social, Health and Labour Statistics (Field 8), may wish to reflect on.

At the strategic level, opportunities were noted for the CCES to leverage its unique position to foster more effective coordination and information sharing across FPT partners. Strengthening these practices could help address evolving information needs, including those related to timeliness and data gaps. For instance, management could explore opportunities to support the Strategic Management Committee's governance role in ways that would allow emerging priorities and issues to be reviewed more regularly and reflected in strategic direction and oversight.

In addition, given upcoming organizational changes and some stakeholders' lack of clarity regarding the respective roles of multiple divisions, management may wish to consider measures to clarify key points of contact and reinforce cross-divisional coordination. These steps could support greater transparency and contribute to a more consistent stakeholder experience and understanding.

Recommendation

Given the ELMLP's potential to increase data sources, broaden and deepen coverage, expand partnerships and user groups, and diversify funding, a formal recommendation focused on strengthening the platform was identified.

The ACS of Field 8 should ensure that the ELMLP's governance, engagement and analytical capacity are strengthened. Key actions should include

  1. revisiting the establishment of a governance body (e.g., composition, operations) and updating it to ensure appropriate representation and fit for purpose
  2. improving data users' and stakeholders' awareness of, and engagement with, the ELMLP to further support platform use and data interpretation
  3. continuing to work with stakeholders to prioritize integrated and analytical products that reflect the needs and priorities of data users, such as longitudinal data.

Acronyms and abbreviations

ACS

Assistant chief statistician

CCES

Canadian Centre for Education Statistics

CESC

Canadian Education Statistics Council

CMEC

Council of Ministers of Education, Canada

CSELCC

Canadian Survey on Early Learning and Child Care

DG

Director general

EDI

Equity, diversity and inclusion

ELMLP

Education and Labour Market Longitudinal Platform

ESDC

Employment and Social Development Canada

ESES

Elementary-Secondary Education Survey

ESP

Education Statistics Program

Field 8

Social, Health and Labour Statistics Field

FINCOL

Financial Information of Colleges

FINESS

Financial Information of Elementary and Secondary Schools

FINUNI

Financial Information of Universities Survey

FPT

Federal, provincial and territorial

K-12

Kindergarten to Grade 12

NAS

National Apprenticeship Survey

NGS

National Graduates Survey

OECD

Organisation for Economic Co-operation and Development

PCAP

Pan-Canadian Assessment Program

PCEIP

Pan-Canadian Education Indicators Program

PIAAC

Programme for the International Assessment of Adult Competencies

PISA

Programme for International Student Assessment

PSIS

Postsecondary Student Information System

RAIS

Registered Apprenticeship Information System

SAEP

Survey of Approaches to Educational Planning

SELCCA

Survey on Early Learning and Child Care Arrangements

SMC

Strategic Management Committee

SPFR

Survey of Postsecondary Faculty and Researchers

STEM

Science, technology, engineering and mathematics

TLAC

Tuition and Living Accommodation Costs

UCASS

University and College Academic Staff System

What is covered

Background

Overview of the Education Statistics Program

In Canada, education is a provincial and territorial responsibility. At the same time, comparable pan-Canadian information is essential to support federal, provincial and territorial (FPT) coordination; inform policy development; and meet national and international reporting commitments. To support this need, pan-Canadian governance bodies and working-level committees help set priorities, make decisions, and coordinate processes that ensure coherent and comparable education statistics. It is within this context that the Canadian Centre for Education Statistics (CCES) delivers the Education Statistics Program (ESP) as part of Statistics Canada's mandate.

The CCES serves as Statistics Canada's centre of expertise for education, training and learning statistics. It provides several national indicators and contributes to internationally comparable pan-Canadian measures. CCES data products are widely used to inform policy, support research and provide insights into Canada's education landscape. Its activities are funded through Statistics Canada's ongoing operating budget for education and social statistics, supplemented by cost-recovery funding. From fiscal years 2020/2021 to 2024/2025, CCES expenditures totalled $40 million.

Within Statistics Canada, several divisions collaborate to ensure alignment of education-related priorities and to leverage complementary expertise. While the CCES leads the coordination and delivery of core education statistics, other divisions also produce education-related information as part of their mandates. For example, the Economic and Social Analysis and Modelling Division and the Health Analysis and Modelling Division produce analytical products that integrate education variables, strengthening analysis across interconnected domains such as education, health, family well-being and the labour market. Major data sources, such as the Census of Population, the Labour Force Survey and the Indigenous Peoples Survey, also contribute education-related content that is disseminated both within and outside the CCES.

Governance of education statistics in Canada

Governance of education in Canada is inherently multi‑layered and complex. Because authority rests with the provinces and territories, producing national-level education statistics depends on coordination rather than centralized control. Pan‑Canadian governance mechanisms provide structured forums for jurisdictions to collaborate on shared priorities, address cross‑jurisdictional challenges and coordinate responses to national issues. These mechanisms also help present a unified Canadian voice in international education forums and support more harmonized policy approaches across Canada's decentralized landscape.

At the pan-Canadian level, the Council of Ministers of Education, Canada (CMEC) serves as the main intergovernmental forum through which the provinces and territories collaborate on shared education priorities and coordinate national and international engagements. CMEC activities are supported by the CMEC Secretariat, which manages intergovernmental meetings and communications, and by the Advisory Committee of Deputy Ministers of Education, which provides strategic advice and raises issues requiring ministerial attention.

CMEC also oversees data and research activities that inform education policy across Canada. Many of these initiatives are delivered through the Canadian Education Statistics Council (CESC), a partnership between CMEC and Statistics Canada. As one of the primary governance bodies for pan-Canadian education statistics, it is composed of deputy-level members and provides strategic oversight on national objectives, priorities, methodologies, data needs and budget planning to support coherent and comparable education statistics across jurisdictions.

The Strategic Management Committee (SMC) reports to CESC, and this committee includes representatives from provincial and territorial education ministries, CMEC, and the CCES. Co-chaired by CMEC and Statistics Canada, the SMC meets twice each year and serves as the operational arm of CESC. It facilitates information sharing, supports indicator development and methodological discussions, and keeps partners informed of ongoing and planned initiatives. Several working groups report to the SMC, enabling coordination across related pan-Canadian and international projects.

Internationally, Canada's education statistics are shaped by participation in multilateral initiatives, particularly those led by the Organisation for Economic Co-operation and Development (OECD). CMEC and Employment and Social Development Canada (ESDC) coordinate Canada's engagement on these committees, with Statistics Canada contributing technical and analytical expertise to ensure high-quality, internationally comparable education data.

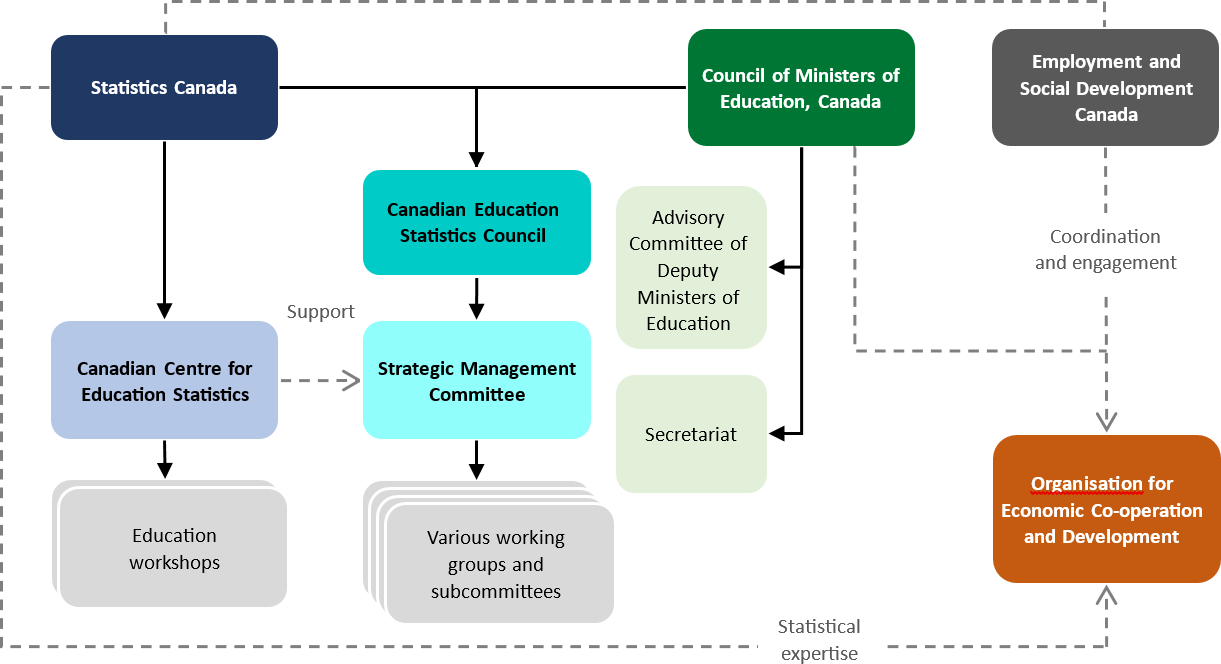
Through these mechanisms and its close relationship with ESDC, the CCES contributes to harmonized pan‑Canadian data collection, supports the development of shared indicators and helps ensure that national statistical outputs are aligned with broader intergovernmental priorities. Figure 1 provides a simplified view of the governance structure referenced in this evaluation and does not reflect its full complexity.

Figure 1. Pan-Canadian governance framework for education statistics (simplified)
Figure 1
Description - Figure 1

Figure 1 shows the main organizations and committees referenced in the evaluation that are involved in pan-Canadian education statistics and how they relate to each other. The figure is simplified and is intended to be read from top to bottom, moving from pan-Canadian education leadership to education statistics governance, operational committees, and supporting units. It also includes an international component describing Canada's engagement with the Organisation for Economic Co-operation and Development (OECD). The overall graphic suggests that Statistics Canada and CMEC are central coordinating bodies.

Top of the diagram (pan-Canadian education leadership)

  • Statistics Canada is shown at the top left. A horizontal line connects Statistics Canada to the Council of Ministers of Education, Canada (CMEC) near the top centre, and continues to Employment and Social Development Canada at the top right..
  • The Council of Ministers of Education, Canada (CMEC) is shown at the top centre as the overarching pan-Canadian education body. Two connected supporting bodies are places below it: the CMEC Secretariat and the Advisory Committee of Deputy Ministers of Education, which support CMEC.

Middle of the diagram (education statistics governance partnership)

  • Below CMEC is the Canadian Education Statistics Council (CESC), which is a partnership between CMEC and Statistics Canada and is shown as the primary governance body for pan-Canadian education statistics.

Lower part of the diagram (operational committee structure and support)

  • Below the CESC is the Education Strategic Management Committee (SMC), which oversees working groups and subcommittees, which report to, and are shown under, the SMC.
  • Below Statistics Canada, the Canadian Centre for Education Statistics (CCES), a division of Statistics Canada, is shown as supporting the SMC. The accompanying text also notes that CCES delivers workshops.

International component (OECD engagement)

  • In the international component, the figure shows how Canadian partners engage with the Organisation for Economic Co-operation and Development (OECD).
  • CMEC and Employment and Social Development Canada (ESDC) are shown as coordinating Canada's participation in OECD-led multilateral initiatives.
  • Statistics Canada is shown as supporting this work by contributing statistical expertise to the OECD and by supporting ESDC.

About the evaluation

Authority

The evaluation was conducted in accordance with the Treasury Board Policy on Results and Statistics Canada's Risk-Based Audit and Evaluation Plan (2025/2026 to 2029/2030).

Objective and scope

The objective of the evaluation is to provide a neutral, evidence-based assessment of the ESP's ongoing relevance and performance, including how well the program meets evolving information needs and contributes to the availability of high-quality education-related statistical information.

The scope, determined in consultation with the CCES as the office of primary interest, covered statistical data and insights organized under the following five thematic areas:

  1. early childhood learning
  2. elementary and secondary education
  3. postsecondary education
  4. adult learning
  5. integrated education information.

These thematic areas align with the four pillars of learning in the CMEC Framework for Statistics on Learning and Education in Canada, with an additional category of integrated education information that cuts across all four pillars. The list of surveys and administrative data collections that underpin these data and insights, and that were included in the evaluation scope, is provided in Appendix A.

The evaluation was conducted from August to November 2025.

Approach and methodology

The evaluation was guided by the following two questions:

  1. How well does the ESP's coverage align with key statistical information needs and priorities?
  2. How effectively does the ESP deliver high-quality education-related statistical information?

More information about the evaluation questions and related indicators can be found in Appendix B.

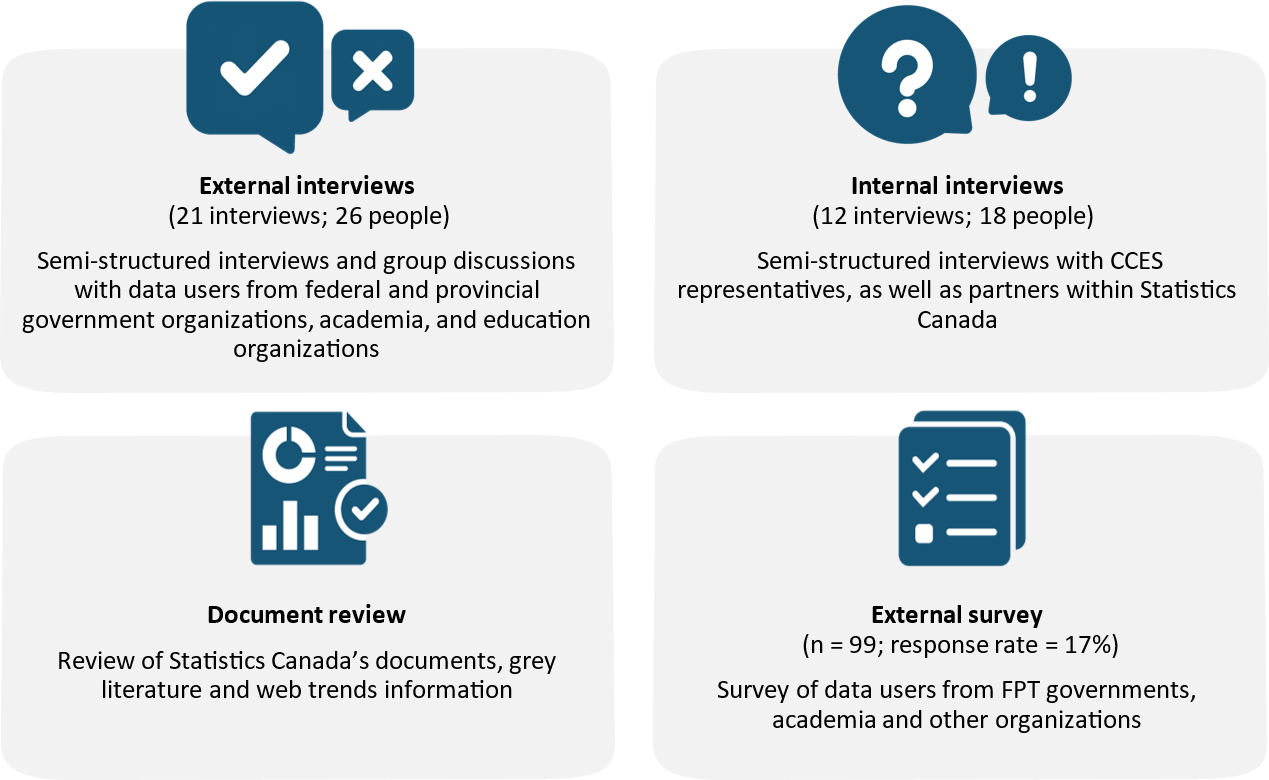
The data collection methods outlined in Figure 2 were used. The findings outlined in this report are based on the triangulation of these data collection methods.

Figure 2. Data collection methods
Figure 2
Description - Figure 2

Figure 2 outlines the methods used by the evaluation for data collection.

  • External Interviews: These are semi-structured interviews and group discussions with data users from federal and provincial government organizations, academia, and education organizations. A total of 21 external interviews with 26 people were conducted.
  • Internal Interviews: These are semi-structured interviews with CCES representatives, as well as partners within Statistics Canada. A total of 12 internal interviews with 18 people were conducted.
  • Document Review: Review of Statistics Canada's documents, grey literature and web trends information
  • External Survey: A survey of data users from FPT governments, academia and other organizations. The data user survey was sent to 99 users, with a response rate of 17%.

Three main limitations were identified, and mitigation strategies were employed, as outlined in Table 1.

Table 1 Limitations and mitigation strategies
LimitationsMitigation strategies
The perspectives gathered through external interviews may not be fully representative.External interviewees were selected using specific criteria to maximize strategic reach for the interviews and to ensure participation from key users and stakeholders relevant to the evaluation scope. Multiple recruitment strategies were used. Evaluators were able to find consistent overall patterns.
Self-report bias can occur in internal interviews, where individuals reporting on their own activities may portray them in a more positive light.To the extent possible, feedback and reflections on activities were sought from a range of perspectives. A review of program documents also supported a balanced perspective.
The survey of users had low uptake (response rate = 17%, n = 99), and, therefore, findings from the survey may not be fully representative of the entire user group population.The evaluation included interviews with users across population groups to establish a more representative sample. Purposeful sampling of interviewees aimed to gather feedback from diverse users.

What we learned

Relevance

How well does the ESP's coverage align with key statistical information needs and priorities?

ESP coverage provides a comprehensive and coordinated picture of the education system in Canada and aligns well with the information needs and priorities of data users. The ESP's statistical data and insights are widely viewed as useful and provide national-level information for all pillars of lifelong learning, information that would otherwise not be available to most users. This is achieved by integrating multiple data sources and leveraging a platform that links datasets to support cross-cutting analysis. Ongoing collaboration and consultation with education partners further help ensure that ESP coverage remains aligned with the evolving needs and shifting priorities of data users. However, some coverage gaps remain, particularly in areas requiring more disaggregated data. The ESP's ability to address these gaps is limited by its reliance on FPT-driven priorities, data availability and (largely federal) funding, which hinder its capacity to respond rapidly to emerging needs or specific research interests. Nevertheless, ongoing efforts and collaborative partnerships have enabled the ESP to adapt where possible and introduce new statistical data. Given the strong interest in integrated information to support analysis and policy decision making, greater integration of data sources like the Education and Labour Market Longitudinal Platform (ELMLP) would further enhance the relevance of education statistical data and insights.

The ESP's coverage follows the CMEC framework and has expanded over time to include a mix of surveys, administrative data and integrated initiatives that together provide a comprehensive picture of education in Canada.

ESP statistical data and insights are guided by the CMEC Framework for Statistics on Learning and Education in Canada, which provides a common structure across jurisdictions to support coherence and comparability in education statistics. The framework organizes education statistics into four lifelong learning pillars: early childhood learning and development, elementary and secondary schooling, postsecondary education, and adult learning and skills development.

The ESP comprises a mix of surveys and administrative data collections that have evolved over time and operate on different collection cycles. The mix includes long-standing surveys that continue to be collected, surveys that have been discontinued or restructured, and newer initiatives introduced at different points in time.

The CCES manages 12 household and institutional surveys, many of which draw on respondents' administrative records. The CCES also manages three administrative data collections based on operational records and plays a technical implementation and data stewardship role for three additional assessments governed internationally and across Canada. Moreover, the CCES oversees three complementary education information initiatives that bring together multiple sources to support cross-cutting analysis and comparability across jurisdictions and over time, ranging from a consolidated data survey to integrated platforms (see Table 2).

Table 2 Education data products by source and survey type
Data source typeData sources
Census and sample surveys

Household or individual

  • Survey on Early Learning and Child Care Arrangements (SELCCA)
  • Canadian Survey on Early Learning and Child Care (CSELCC)
  • National Graduates Survey (NGS)
  • Tuition and Living Accommodation Costs (TLAC) survey
  • National Apprenticeship Survey (NAS)
  • Programme for the International Assessment of Adult Competencies (PIAAC), OECD
  • Survey of Postsecondary Faculty and Researchers (SPFR)
  • Census of Population (contributor of education-related data)
  • Canadian Child Care Worker Survey (new survey)

Institutional

  • Elementary-Secondary Education Survey (ESES)
  • Survey of Approaches to Educational Planning (SAEP)
  • Financial Information of Elementary and Secondary Schools (FINESS)
  • Financial Information of Colleges (FINCOL)
  • Financial Information of Universities Survey (FINUNI)
Administrative data collections
  • Postsecondary Student Information System (PSIS)
  • University and College Academic Staff System (UCASS)
  • Registered Apprenticeship Information System (RAIS)
Republished from other data sources for the purposes of data users
  • Pan-Canadian Assessment Program (PCAP), CMEC
  • Programme for International Student Assessment (PISA), OECD
Integrated data
  • Survey of Federal Government Expenditures in Support of Education
  • Pan-Canadian Education Indicators Program (PCEIP)
  • ELMLPFootnote 2

Overall, the ESP provides comprehensive coverage across all pillars of lifelong learning and key elements of the education system. It is supported by integrated data sources and partnerships that enhance longitudinal analysis and ensures alignment with evolving pan‑Canadian priorities.

ESP surveys and administrative data provide extensive and detailed coverage across the four lifelong learning pillars and key dynamic elements of the education system, from inputs to longer-term outcomes, consistent with the CMEC framework (see Table 3).

Table 3 Council of Ministers of Education, Canada Framework for Statistics on Learning and Education in Canada: Definitions of dynamic elements
TermDefinitions
InputsDescriptive and contextual information on learners, non-participants and the resources required to deliver learning activities. Examples include student and school demographics, characteristics of child care providers, funding sources, and financial and human resource availability.
ProcessesInformation on the learning activities themselves and the processes that support their delivery. This includes resource allocation, program and provider availability, and the support services that enable learning.
OutputsDirect products of learning activities, typically expressed as quantifiable measures of effort. Examples include enrolment numbers and completion or graduation rates.
OutcomesChanges resulting from learning activities, including impacts on learners, the education system and society. Examples include graduates' employment outcomes, earnings, and other social and economic effects.

The ESP integrates and harmonizes surveys and administrative data and coordinates collection cycles to enable longitudinal analysis and support evidence-based decision making (see Figure 3).

Figure 3. Data sources supporting the Education Statistics Program
Figure 3
Description - Figure 3

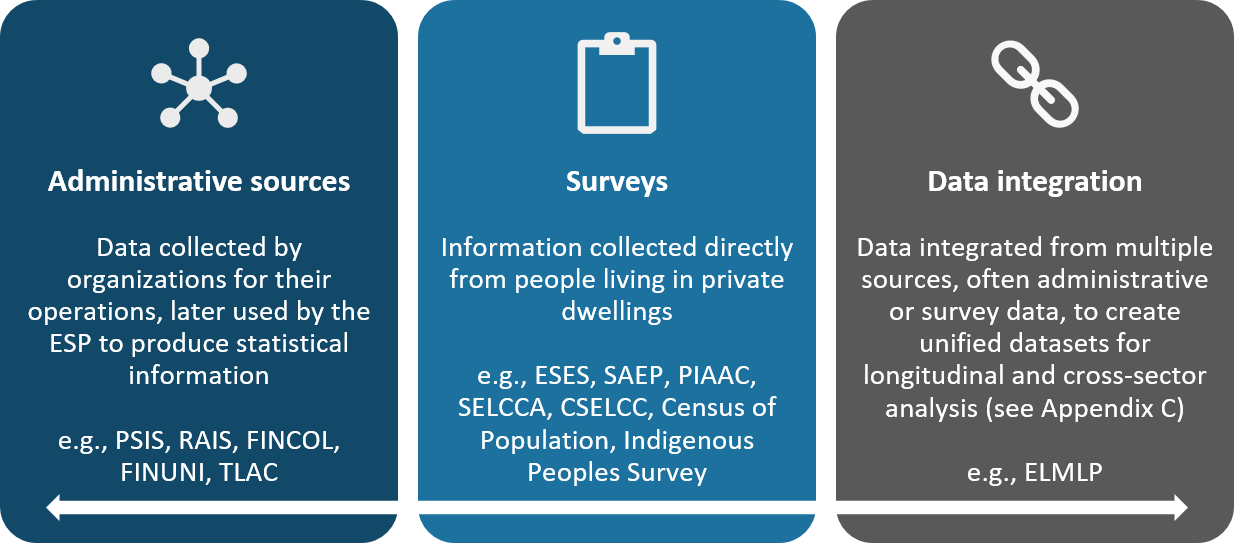
Figure 3 presents three data sources that the ESP uses to integrate and harmonize survey and administrative data and to coordinate collection cycles:

  • Administrative sources: Data collected by organizations for operational purposes and later used by the ESP to produce statistical information (e.g., PSIS, RAIS, FINCOL, FINUNI, TLAC).
  • Surveys: Information collected directly from people living in private dwellings (e.g., ESES, SAEP, PIAAC, SELCCA, CSELCC, Census of Population, Indigenous Peoples Survey).
  • Data integration: Data integrated from multiple sources—often administrative or survey data—to create unified datasets for longitudinal and cross-sector analysis (e.g., ELMLP) (see Appendix C).

This integrated approach benefits both data providers and users by reducing response burden on individuals and institutions while helping policy makers and stakeholders understand how access, resources, delivery and outcomes interact across the education lifecycle. For example, educational attainment data can be linked with labour market outcomes to provide a more complete picture of pathways and results. This approach also supports the identification of emerging gaps, pressures and trade-offs. ESP data also support national reporting requirements and Canada's international reporting commitments.

To maintain this comprehensive coverage of education in Canada and to ensure that its statistical information aligns with the needs and priorities of the main data users, the CCES has worked closely with partners across organizations and government departments to evolve its surveys and administrative data collections in response to emerging priorities and information needs.

  • Provincial and territorial education partners: Collaborations with provincial and territorial education partners inform pan-Canadian education indicators and research agendas. Consultations with key users, including ESDC and CMEC, inform indicator updates derived from selected surveys to expand available datasets that meet data users' evolving needs. For example, the 2020 NGS included new questions on the impacts of the COVID-19 pandemic on the education and employment of graduates, and both the NGS and the PSIS were updated to capture microcredential programsFootnote 3 to better understand the supply of labour market skills.
  • Partnerships with federal departments: Collaboration with ESDC, a main partner of the ESP, involves cost-recovery deliverables that collect data to inform needs related to the labour market, skills development, financial and affordability research, and policy and program development. For example, the SELCCA, CSELCC and SAEP data inform accessibility and affordability policies and programs for early learning and child care and postsecondary education. While data collected through the PSIS, NGS, RAIS and ELMLP enable analysis of education-to-work pathways and skills supply, they also enable alignment with labour market needs. Additionally, the SPFR, sponsored by Innovation, Science and Economic Development Canada,Footnote 4 addressed information gaps related to equity, diversity and inclusion (EDI) among postsecondary educators and researchers.

In addition to partnerships with provincial and federal organizations, the ESP partners with other professional organizations to ensure that education statistics remain relevant for conducting strategic planning, monitoring performance, and informing evidence‑based policy and program development. For example, through its long‑standing partnership with the Canadian Association of University Business Officers, Statistics Canada works with universities and colleges to produce standardized financial information for the postsecondary sector, enhancing its quality, comparability and policy usefulness.

ESP statistical data and insights are reported to provide national-level information that would otherwise not be available to support data users' needs and to be useful and relevant for a wide variety of applications.

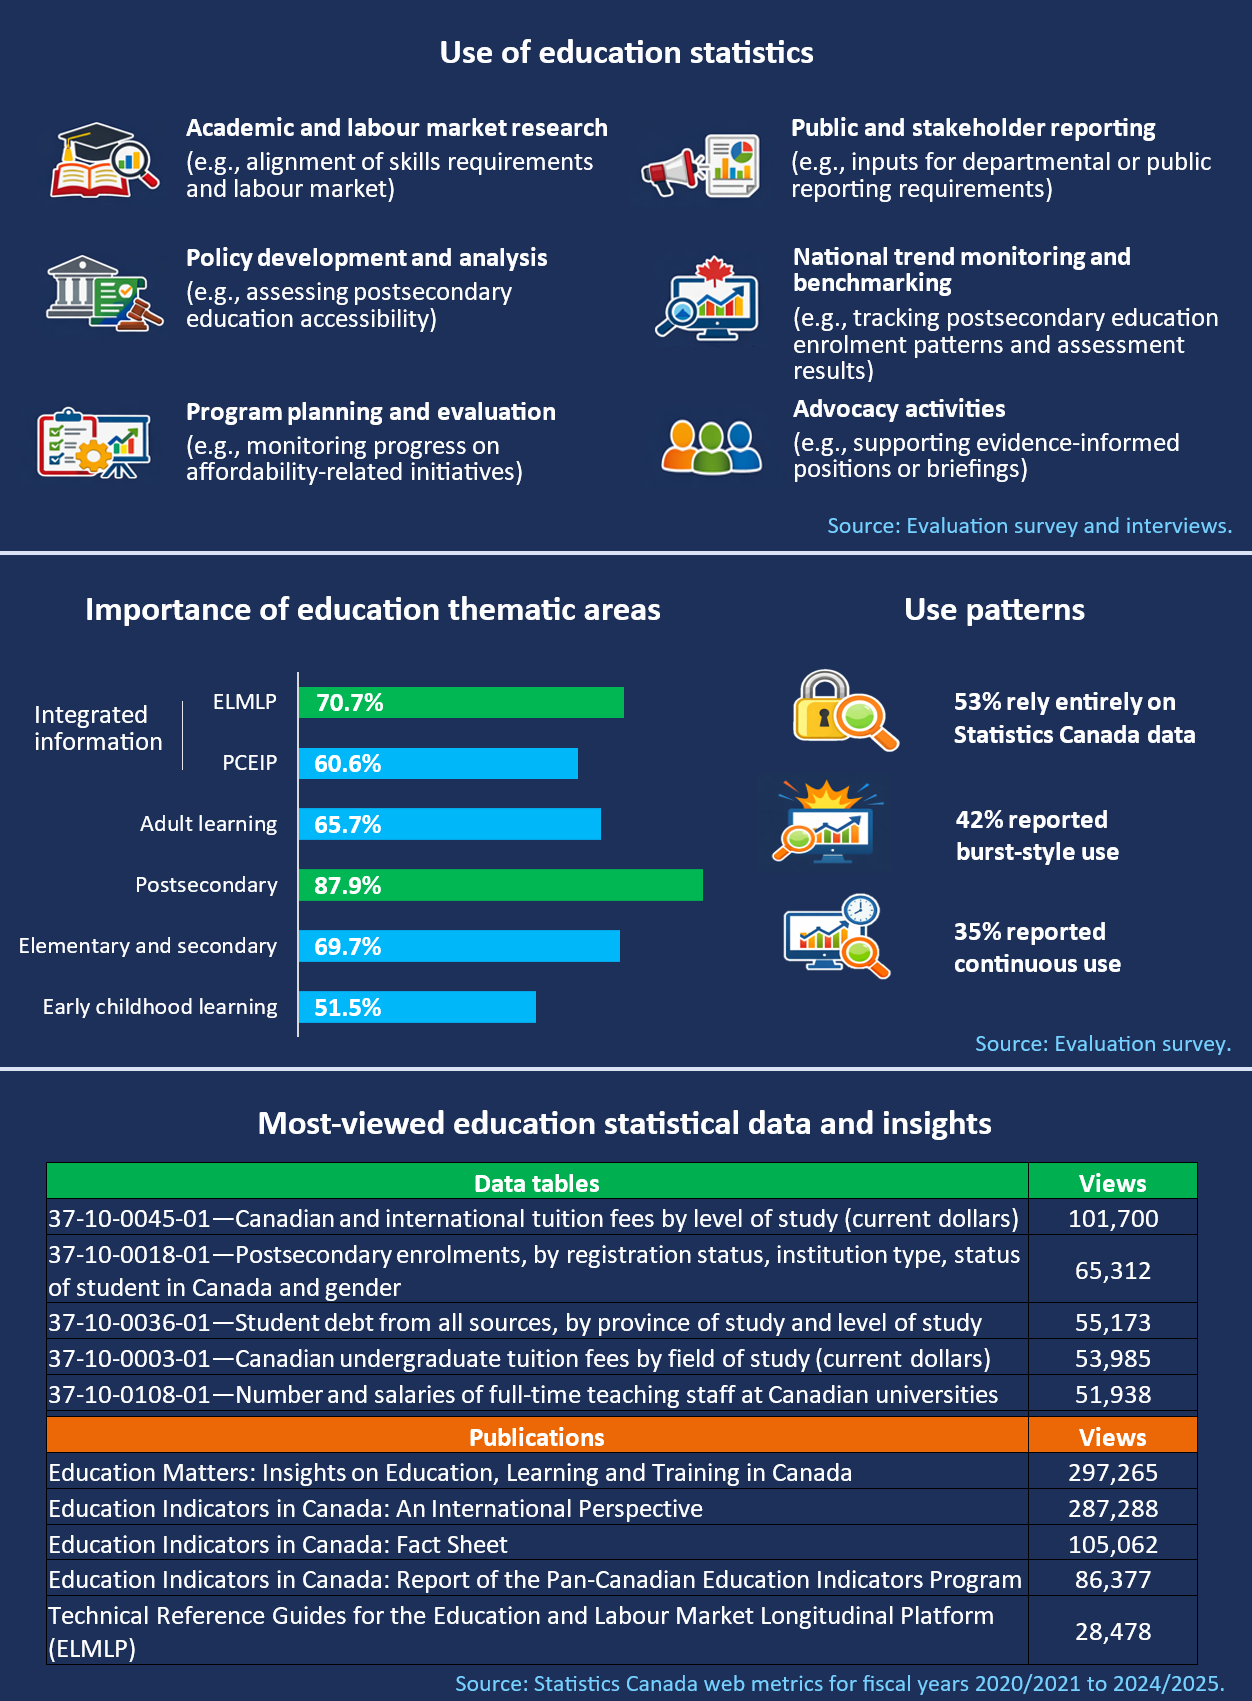
Overall, evidence from multiple sources indicates that the ESP's statistical data and insights are highly valued because they provide a trusted, neutral source of information not easily replaced by other data. Statistics Canada is viewed as one of the few organizations with both the mandate and the capacity to support data coordination across all jurisdictions. As a result, its data are widely regarded as credible and are used to support a broad range of analytical and operational activities (see Figure 4).

ESP data are considered essential by most users because national-level statistical information is either unavailable elsewhere or difficult to obtain from other sources. Surveyed users highlighted the program's importance: 53% reported relying entirely on ESP data, while 31% reported partial reliance, often supplementing these data with provincial, territorial, institutional or other sector-specific sources.Footnote 5 Patterns of use suggest that most users engage with the data to meet practical and immediate needs. A majority of users (77%) reported accessing the data either regularly throughout the year or in "bursts" during periods of high demand, while about 20% reported lighter, more occasional use.

Users most often reported relying on data tables and analytical products to support their work and areas of interest. Thematically, they most frequently chose postsecondary education information and integrated statistical information (e.g., the ELMLP) as their top areas of interest. This is reinforced by Statistics Canada web metrics, which show sustained interest in postsecondary education products, particularly those related to institutional financial information, as well as in integrated analytical content. Additionally, a review of web traffic also showed that online searches led individuals to discontinued publications that examined trends and relationships across the education and training landscape, suggesting continued interest in integrated information. Overall, uptake of online ESP products has remained generally stable from fiscal years 2020/2021 to 2024/2025.

At the same time, many users noted that additional analytical products would enhance the relevance and usefulness of ESP data. Ongoing work within the PCEIP's modernization, such as new analytical papers (e.g., on populations not in employment, education or training and on high school completion for Indigenous communities), new or updated indicators, expanded data visualizations, and enhanced communications, may help address these needs.

Figure 4. Respondents' use of education statistics
Figure 4
Description - Figure 4

Figure 4 is a four-panel summary of how respondents use education statistics. It combines (1) a list of common uses, (2) a bar chart reporting the share of respondents who rated thematic areas as important, (3) a short summary of usage patterns expressed as percentages, and (4) a table listing the most-viewed education data and publications with their number of views.

Panel 1: Overall use of education statistics

This panel lists six main ways respondents reported using education statistics:

  • Academic and labour market research (e.g., aligning skills requirements with the labour market).
  • Policy development and analysis (e.g., assessing postsecondary education accessibility).
  • Program planning and evaluation (e.g., monitoring progress on affordability-related initiatives).
  • Public and stakeholder reporting (e.g., supporting departmental and public reporting requirements).
  • National trend monitoring and benchmarking (e.g., tracking enrolment patterns and assessment results).
  • Advocacy activities (e.g., supporting evidence-informed positions or briefings).

The source for this panel is the evaluation survey and interviews.

Panel 2: Perceived importance of education thematic areas (bar chart)

This panel is a bar chart. Each bar is an education thematic area, and the value is the percentage of respondents who ranked that area as important. The thematic areas are shown from highest to lowest percentage:

  • Post-secondary: 87.9%.
  • Education and Labour Market Longitudinal Platform (ELMLP): 70.7%.
  • Elementary and secondary: 69.7%.
  • Adult learning: 65.7%.
  • Pan-Canadian Education Indicators Program (PCEIP): 60.6%.
  • Early childhood learning: 51.5%.

The source for this panel is the evaluation survey.

Panel 3: Use patterns

This panel summarizes how respondents described their use of Statistics Canada education data. The figure reports three percentage statements:

  • 53% rely entirely on Statistics Canada data.
  • 42% reported burst-style use (use concentrated in specific periods rather than ongoing).
  • 35% reported continuous use (ongoing use over time).

The source for this panel is the evaluation survey.

Panel 4: Most-viewed education statistics data and insights (table)

This panel is a table of web engagement. It lists specific education-related data tables and publications and shows the number of views for each. The table is split into two groups: "Data tables" and "Publications." Within each group, each row contains the item title (or identifier) and its view count. The source for this panel is Statistics Canada web metrics for fiscal years 2020/2021 to 2024/2025.

For the data tables, the items titles and their corresponding view count are as follows:

  • 37-10-0045-01—Canadian and international tuition fees by level of study (current dollars): 101,700 views
  • 37-10-0018-01—Postsecondary enrolments, by registration status, institution type, status of student in Canada and gender: 65,312 views
  • 37-10-0036-01—Student debt from all sources, by province of study and level of study: 55,173 views
  • 37-10-0003-01—Canadian undergraduate tuition fees by field of study (current dollars): 53,985 views
  • 37-10-0108-01—Number and salaries of full-time teaching staff at Canadian universities: 51,938 views

For the publications, the items titles and their corresponding view count are as follows:

  • Education Matters: Insights on Education, Learning and Training in Canada: 297,265 views
  • Education Indicators in Canada: An International Perspective: 287,288 views
  • Education Indicators in Canada: Fact Sheet: 105,062 views
  • Education Indicators in Canada: Report of the Pan-Canadian Education Indicators Program: 86,377 views
  • Technical Reference Guides for the Education and Labour Market Longitudinal Platform (ELMLP): 28,478 views

While ESP coverage is reported to be meeting data users' needs and priorities, supporting both analysis and decision making, some coverage gaps remain, particularly in areas requiring enhanced disaggregation, longitudinal linkage (e.g., the ELMLP) or program-level outcomes. These gaps reflect structural and resource constraints inherent in a partnership-based data environment, including reliance on provincial and territorial data, combined with predominantly federal funding. Where possible, the ESP addresses these challenges through targeted partnerships and ongoing improvements.

Overall, data users report that ESP statistical coverage meets their needs, but some gaps remain. Data users reported ongoing challenges in accessing disaggregated data across thematic areas, such as across geographic regions and equity groups. For example, users have shared that they would like to see rural and remote data in the SAEP and gender categories beyond "woman" and "man" in the UCASS. Some of these gaps may be partially addressed through future data linkages with the 2026 Census of Population, which will collect more detailed information on equity group identifiers (e.g., sexual orientation), and the UCASS modernization initiative is integrating new EDI variables.

Other coverage gaps were reported to occur at the national and cross-jurisdictional levels. For example, while several provinces and regions, including Ontario, Quebec and the Atlantic provinces, regularly survey postsecondary graduates, data from the NGS are released only every four years. The infrequent collection of the NGS is reported to limit its ability to track labour market misalignments, especially in fast-moving fields, such as science, technology, engineering and mathematics (STEM). Additionally, certain provinces and territories track secondary-to-postsecondary transition rates but lack the mechanisms to compare their jurisdictional data with those in other jurisdictions or with national statistics. Meanwhile, Statistics Canada does not have the secondary school microdata for most jurisdictions that would be needed for pan-Canadian or national longitudinal secondary-to-postsecondary transition rates.

The ELMLP has been widely recognized by users as a significant innovation. It enables large-scale longitudinal analysis of education pathways and labour market outcomes through the linkage of annually refreshed core datasets (e.g., PSIS, RAIS) and supplementary datasets (e.g., census, NGS, NAS), which are updated on variable cycles. Recent expansion through linkages with provincial kindergarten to Grade 12 (K-12) data in British Columbia and Ontario further enhances the ELMLP's analytical potential by enabling examination of how earlier educational experiences shape later outcomes in these provinces. Evidence indicates that the relevance of the ELMLP could be increased by expanding K-12 linkages across additional jurisdictions and integrating more demographic and contextual data to enhance national coverage, policy insights and equity analysis.

The literature review has also revealed some gaps in the availability of data related to learning quality, particularly in areas such as early learning environments. However, such environments typically require qualitative or observation-based research approaches that may fall outside the scope of the ESP. In the meantime, early learning and child care data are limited in informing the multilateral commitment to increase the quality of early learning and child care. The ESP is also less capable of capturing dimensions of academic achievement to inform trend analysis for policy development and monitoring because much of this information is entirely owned by its partners, who conduct this work. For example, PCAP's triennial cycle of rotating assessments of academic subjects covers only a sample of Grade 8 students and excludes the territories, preventing granular comparisons across or within jurisdictions over time.Footnote 6 Similarly, with PISA being an OECD survey, its focus on international benchmarks—instead of on provincial curriculum goals—reduces its usefulness for provincial monitoring and policy making. Statistics Canada is currently reviewing the policy on posting other parties' data on its website.

Additional gaps identified by data users for each thematic area are summarized in Table 4. Some of the identified gaps reflect areas where data either do not exist or are not accessible to the ESP and, therefore, fall outside the ESP's control.

Table 4 Education Statistics Program coverage gaps by thematic area, as identified by data users
Thematic areasKey coverage gaps (identified by data users)
1. Early childhood learning
  • Limited data on quality of child care and outcomes, especially related to qualitative measures and for diverse groups like Indigenous or disabled children
2. Elementary and secondary educationFootnote 7
  • Limited data on K-12 supply side factors (e.g., teacher remuneration, qualifications), hindering identification of student needs
  • No data on K-12 student attendance
  • Limited information on secondary-to-postsecondary transitions, including barriers faced by students
3. Postsecondary education
  • Limited information on the financial landscape of private career colleges
  • Limited data on non-federal student loans and other financing mechanisms
  • Limited institutional-level financial data (e.g., FINCOL, TLAC)
  • Infrequent data collection (e.g., NGS every five years) limits the ability to monitor rapid labour market shifts, particularly in fast-changing STEM fields
  • Limited or no data on private postsecondary institutions
  • No data on part-time university and college staff (e.g., UCASS)
  • Limited information on francophone students and programs
  • Post-degree college credentials are not captured, constraining analysis on upskilling and reskilling
  • No data on foreign credential recognition
4. Adult learning
  • Discontinuation of the NAS has reduced the availability of information on apprentices' experiences, including reasons for leaving, limiting understanding of trade shortages and barriers
  • Limited data on skills training and microcredentials obtained outside formal education systems (e.g., employer- or union-provided), including their effects on employment and earnings, to inform gaps in skills demand and supply
5. Integrated education information
  • Limited provincial and territorial elementary and secondary data in the ELMLP (currently only British Columbia and Ontario) restrict the ability to track outcomes linked to early education pathways
  • Misalignment between education programs and occupation codes limits strategic workforce planning (e.g., distinguishing retirements from career changes in sectors facing shortages)
  • Limited information on predictors of entering skilled trades and the requirements for success (e.g., key secondary-level courses)

The ESP's reliance on provincial and territorial data and predominantly federal funding is shaped by intergovernmental agreements, jurisdictional priorities and budget cycles. This reliance helps to ensure alignment with FPT policy needs but does not always reflect the evolving needs of the research and academic community. This dependency also constrains the ESP's flexibility and responsiveness, limiting its ability to address broader data gaps; pursue innovation; or react quickly to emerging, time-sensitive data needs. For example, updating surveys often requires several years before data collection can occur.

Amid current socioeconomic and policy shifts, users also identified several emerging needs in education statistics, such as understanding the impacts of artificial intelligence on learning and skills development, as well as pressures on education systems stemming from government caps on immigration. Program representatives noted an awareness of these emerging needs; however, addressing them depends largely on continued consultations with partners to explore feasible solutions, options that frequently depend on the availability of funding within a cost-recovery model.

Performance

How effectively does the ESP deliver high-quality education-related statistical information?

Overall, the ESP continues to provide high-quality statistical information; however, several factors influence how effectively the data can be used. Jurisdictional differences in data collection and reporting, along with declining response rates for certain voluntary surveys, create comparability and accuracy challenges. Timeliness issues and the complexity of accessing information, particularly through platforms such as the ELMLP, also limit broader use of data in planning, policy and program contexts.

Pan‑Canadian governance structures support collaboration but face constraints. Reduced activity at CESC has limited opportunities for priority setting, and the SMC's ability to advance shared priorities is affected by differing jurisdictional capacities, mandates and authority levels. While progress has been made in some areas through working‑level coordination, advancement is more limited for initiatives without established governance mechanisms, including those related to the ELMLP.

The CCES's involvement across the education and labour market domains positions it well to support coordination; however, when multiple divisions engage with the same stakeholders, roles and points of contact can be unclear. Strengthening internal coordination could help promote a more consistent stakeholder experience.

Budget pressures and reliance on a single major cost‑recovery funder create vulnerabilities for long‑term planning and the ability to address emerging needs. The discontinuation of funded products has contributed to coverage gaps noted by users. Workforce pressures further highlight the importance of succession planning, cross‑training and knowledge transfer practices to maintain program continuity and resilience.

The ESP continues to deliver high-quality statistical information on education; however, variability across jurisdictions and declining response rates create comparability challenges that the program works to address through ongoing harmonization efforts.

Overall, evidence indicates that the ESP delivers high-quality statistical information across its thematic areas. Most surveyed data users and key interviewees reported high levels of satisfaction with the accuracy and reliability of ESP data, while recognizing that there are some use-related challenges.

With respect to accuracy, program records show that, since fiscal year 2022/2023, no major errors have been identified in ESP-related releases (i.e., data tables and publications on the Statistics Canada website), and only four minor issues—primarily quality control or editing errors—were found and promptly corrected. While most ESP surveys and data collections are administrative or census-based, declining response rates for some voluntary education surveys (e.g., NGS, SPFR, PIAAC) may pose a long-term risk to data accuracy, though this trend is not unique to education statistics.

Administrative or mandatory data collections, such as those from FINESS and ESES, provide near-complete coverage. However, these data sources can create comparability challenges when jurisdictions collect or report information differently. For example, variations in the granularity of high school graduation data across provinces and territories require the ESP to standardize the data. This involves making and defining certain assumptions, such as student transfers, and applying these uniformly across all datasets to develop indicators. As a result, this can distort graduation rates and make it difficult for provinces and territories with more detailed data to compare their own results with other jurisdictions or national estimates. This specific comparability challenge was reported to fall largely outside the agency's control, and users generally reported that the differences were well explained through the program's methodological notes. To strengthen comparability, the ESP has also taken steps such as harmonizing the expenditure-per-student data from the PSIS and aligning the NGS questionnaire with other Statistics Canada social surveys.

While statistical information on education is accessible through multiple channels, users' experiences accessing it vary. Some challenges relate to users' capacity, resource constraints and limited awareness of available products, while others stem from difficulties navigating the ELMLP. Partners also face broader systemic barriers that affect timely and efficient access to data, reducing these partners' ability to fully leverage the value of the data.

The ESP provides multiple ways for users to access data, including through analytical reports, data tables, interactive dashboards and linked longitudinal outcomes. Users typically obtain information through the Statistics Canada website, The Daily releases, microdata files and custom products. While ESP information on the website is generally considered accessible when users know what they are looking for, many found that the website's search function was difficult to use because of the large volume of similar files and tables, making it challenging to quickly locate specific information.Footnote 8

Accessibility challenges were also linked to users' capacity and resource levels. For example, data accessed through Statistics Canada's virtual data labs are reported to be useful primarily to experienced data analysts, a resource that not all organizations possess. A few users also noted that greater promotion of the ESP's data products could help increase awareness and uptake.

Some partners and data users identified additional barriers in accessing and using education data efficiently. The processes to access data through the research data centres were described as inefficient, because each output requires manual vetting prior to release, resulting in significant delays. Accessing data through the ELMLP was similarly seen as challenging, particularly when information is needed quickly, because it requires an approved research proposal. Some users also found that the ELMLP interface was difficult to navigate and less accessible for those with limited analytical expertise. A few users suggested establishing a community of practice to help provincial and territorial partners better understand and use ELMLP datasets.

Other limitations include restricted opportunities to review and update administrative data because of concerns around disrupting time series and comparability. As a result, some administrative data evolve slowly relative to user needs. Some partners also reported duplicative costs, noting that difficulties maintaining ongoing access to previously sponsored datasets sometimes required them to repay for access. In addition, the cost of custom data products was cited as a barrier for users and partners with limited budgets.

Timeliness varies across ESP deliverables, with extended release cycles and jurisdiction‑dependent constraints limiting the usefulness of some data, particularly in fast‑moving policy and labour market contexts.

While some interviewees expressed the need to improve the timeliness of ESP data, almost all users indicated that they were unwilling to compromise on accuracy for faster release. Timeliness challenges were most evident for some of the postsecondary and adult learning deliverables. For example, PSIS data are released two years after the reference academic year, and NGS results are published approximately one year after collection. Because the NGS targets graduates three years after graduation, the resulting four-year lag was reported to reduce the usefulness of the data.

Timeliness has improved for RAIS data, which are now released one year after the reference period. By contrast, PIAAC is administered only once every 10 years, resulting in long intervals between releases. A few users noted, however, that more frequent PIAAC cycles would not necessarily strengthen trend analysis, as relevant changes typically occur over longer periods. Similar to comparability issues, some timeliness constraints fall outside Statistics Canada's control because they depend on the timing and quality of data submitted by jurisdictions and institutions.

Lags in some surveys, particularly the PSIS, were reported to affect program and policy analysis in fast-moving fields such as STEM, where up-to-date information on graduates is essential to understand labour market supply and demand and to inform consultations on rapidly evolving areas such as artificial intelligence. Delays in postsecondary data were also reported to limit the ability to assess the impacts of major policy changes and events, such as the federal cap on international students and the COVID-19 pandemic.

According to Statistics Canada's 2023 Client Experience Index, clients who contacted the agency about education, training and learning services reported the lowest satisfaction with both timeliness and ease of access, compared with other program areas. Evaluation survey results also indicate that 32% of respondents who requested a custom education data product or service from Statistics Canada found the turnaround time too long.

Pan-Canadian governance for education statistics supports consistent working-level collaboration and information sharing, but limited strategic oversight and varying jurisdictional capacities continue to affect progress on shared priorities.

Pan-Canadian education statistics operate within a complex, consensus-based governance environment that shapes how the ESP advances its work and responds to evolving user needs. Within this context, the evaluation found that, although the governance model supports strong collaboration—particularly through project-level committees—and facilitates strong information sharing across organizations, several structural factors continue to limit progress on shared priorities.

CESC remains the central priority-setting body for pan-Canadian education statistics. However, since 2021, it has operated only through desk-based processes and has not convened formally. This has reduced opportunities to revisit priorities, provide strategic direction on emerging issues or advance initiatives requiring multi-jurisdictional alignment. As a result, progress on several identified priorities has been limited. For example, online learning and distance education were designated as priority areas, but there was insufficient support to advance related work through the SMC working groups.

In response to the limited activity at the CESC level, a few key interviewees noted that the SMC has taken steps to move beyond its traditional information-sharing role by contributing to priority setting, with support from the CMEC Secretariat in gathering jurisdictional perspectives. However, because priority setting relies on consensus among provincial and territorial partners with differing capacities, mandates and data environments, it remains challenging to reassess priorities or address emerging issues. In addition, SMC members do not always have the authority to make jurisdiction-wide decisions, and this can limit the committee's ability to advance CESC's strategic priorities.

Key interviewees noted that, while the SMC provides a valuable venue for provinces and territories to engage with one another and with Statistics Canada, differences in statistical capacity, resource limitations, a wide and evolving agenda, and the rapid pace of data needs make it challenging to sustain deeper discussions, reach consensus and maintain momentum. Interviewees also noted that some jurisdictions are represented by individuals from different departments, which can reduce engagement. The breadth of the agenda and the virtual format of meetings also limit opportunities for informal interactions that help build shared understanding across partners.

Despite these constraints, the SMC has enabled progress on several CESC priorities identified in 2019, such as microcredentials, longitudinal indicators and pan-Canadian Indigenous education data. Except for online and distance learning, where interest declined across several jurisdictions, these priorities have advanced through work undertaken in the PSIS and the ELMLP.

By continuing to leverage its unique role, the CCES can help advance pan‑Canadian education statistics. Strengthening coordination with partner divisions within Statistics Canada would also support a more consistent and transparent experience for stakeholders.

Interviewees noted that the CCES's visibility and subject-matter expertise across governance forums strengthen its ability to identify emerging needs and initiate strategic discussions. The SMC and other key partners highlighted that many priorities arise through working‑level exchanges and ad hoc agreements, where the CCES plays a central role in guiding and advancing discussions.

Given its technical expertise, long-standing relationships with FPT partners, and involvement across the education and labour market domains, the CCES is well positioned to help strengthen coordination. Enhancing communication channels, facilitating more systematic information sharing and encouraging more frequent review of emerging issues could help maintain a shared understanding of priorities, particularly in the absence of regular senior‑level oversight. These efforts may also help address long-standing information needs, including data gaps and timeliness challenges.

Because education statistics are cross-cutting, effective coordination within Statistics Canada requires collaboration across several divisions. For instance, the early learning and child care theme intersects with early education, child development, health and family well-being, spanning multiple subject-matter areas across the Social, Health and Labour Statistics Field (Field 8); the Economic Statistics Field; and the Strategic Data Management, Methods and Analysis Field. To manage this cross-cutting structure and leverage the mix of expertise, participating divisions maintain ongoing communication to clarify responsibilities and determine the appropriate lead division. The CCES Analytical Committee, an internal forum for exchanging analysis-related expertise on education, also supports coordination by conducting peer reviews of analytical projects, overseeing data releases and providing methodological guidance in collaboration with partner divisions.

Stakeholders reported positive interactions with the CCES and with experts in other divisions. However, a few stakeholders noted that when multiple divisions engage with the same users, ambiguity can arise, particularly at early stages of engagement. Questions often come up about the primary point of contact, how communication is coordinated and how follow-up will occur. External stakeholders do not always distinguish between divisions within Statistics Canada, so this lack of clarity can influence their overall perception of the agency. Given the relatively small stakeholder community, greater transparency around roles and activities—along with stronger cross-divisional coordination—could help support a more consistent and coherent experience for partners.

Project‑level governance supports effective oversight and progress when clear structures and partner alignment are in place; however, inconsistent governance frameworks and differing priorities can limit advancement, including for initiatives related to the ELMLP.

Statistics Canada responds effectively to SMC priorities at the project level when jurisdictions clearly articulate their needs and when the necessary data are available. The work on graduate mobility was highlighted as a positive example, where close collaboration between provinces and territories and Statistics Canada enabled the development of a pilot project linking mobility information with the ELMLP. Other projects have shown similar responsiveness, though progress can be constrained when they lack a formal multi‑partner governance structure to reconcile varying jurisdictional priorities.

Projects pertaining to adult learning statistics benefited from well-established governance mechanisms that provide operational oversight and support priority setting. For example, PIAAC is guided by international and national governance structures, as well as by an internal steering committee at the director general (DG) level within Statistics Canada. This structure has been effective in advancing the survey. Similarly, the Canadian Council of Directors of Apprenticeship Research Committee sets research priorities, provides guidance to Statistics Canada and monitors deliverables for the RAIS.

By contrast, efforts to establish an ELMLP governance committee with provinces and territories were unsuccessful because of differing partner priorities. While jurisdictions were consulted during the initial indicator development, there is no evidence of ongoing engagement through a formal governance body.

Collaboration with ESDC reflects both strong working-level relationships and some structural complexities. While ESDC does not participate in the main governance bodies (i.e., CESC or the SMC), it engages with CMEC on international initiatives such as PIAAC and PISA and plays a central role in labour market and apprenticeship-related projects, like the RAIS. Interviewees indicated that these partnerships help ensure ESDC remains informed about provincial and territorial priorities, and that the department's involvement is often more effective at the project level, where roles and responsibilities are more clearly defined. At the same time, jointly establishing priorities for cost-recovery projects can be complex because of ESDC's internal structure and the need to balance diverse mandates and priorities. Despite these factors, once priorities are agreed upon, ESP deliverables generally meet user needs. Coordination for multi-year cost-recovery projects, such as the ELMLP, has improved in recent years through adjustments to the annual work cycle and increased alignment facilitated by the Chief Data Officer Branch within ESDC.

The ESP's budget constraints and reliance on cost-recovery funding, primarily through one funder, introduce structural vulnerabilities that affect program stability and long-term planning.

Broader contextual factors, including budget constraints and significant reliance on cost-recovery funding, also affect the ESP's operations. These conditions limit the program's capacity to plan over longer horizons, adapt to emerging needs and balance funder‑specific requests with its mandate to serve all Canadians.

From fiscal years 2020/2021 to 2024/2025, cost-recovery funding accounted for 55% to 64% of annual salary expenditures. Because most of this funding comes from one federal partner, shifts in that partner's budget cycles or priorities can affect program work. While the cost-recovery model enables targeted responsiveness, it also introduces volatility. Changes in funder interests or the discontinuation of funded products, such as the Youth in Transition Survey and the NAS, have contributed to coverage gaps that many data users continue to highlight, though the ELMLP is expected to help address some of them.

Balancing funder-specific priorities with Statistics Canada's broader mandate can also be challenging, particularly when funders request narrowly scoped data for their own program needs. The CCES takes this dynamic into account and takes steps to ensure that data collection and analysis remain aligned with organizational objectives and the needs of Canadians.

Operational budget pressures also require the CCES to be more selective about its projects. These constraints have reduced opportunities for international travel, which previously supported greater awareness of global developments and strengthened international comparability. While virtual participation in international forums enables the CCES to remain informed of formal discussions, it limits the agency's ability to influence education data development at the international level. For example, Statistics Canada was removed as the chair of an OECD working group as a result of only being able to attend meetings virtually. Having only a virtual presence offers fewer opportunities for informal exchanges that can help identify emerging directions and create opportunities to influence discussions.

The CCES faces wide-ranging pressures to maintain workforce sustainability but is mitigating these challenges through strengthened succession planning and knowledge transfer practices to support continuity.

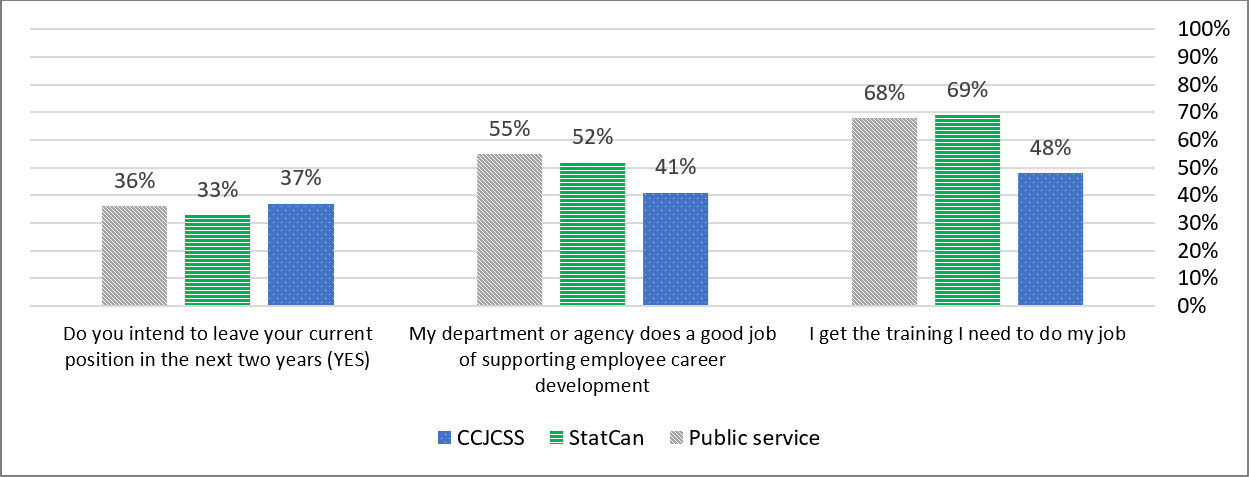
Given current fiscal constraints and the specialized nature of the workforce, succession planning and knowledge transfer are critical to sustaining CCES capacity. Results from the 2024 Public Service Employee Survey show a decline in CCES employees' satisfaction with their work environment relative to 2022, and 35% of CCES employees indicated an intention to leave within two years. Upcoming fiscal measures and potential early retirement incentives may also affect workforce stability.

Because the program relies on a highly specialized and adaptable workforce, the CCES has invested in cross-training, knowledge transfer planning and detailed documentation to support future program cycles. Maintaining and further strengthening these practices will be essential as the agency adapts to upcoming changes.

How to improve the program

Management considerations

The evaluation identified a few considerations for management that the assistant chief statistician (ACS) of Field 8 may wish to reflect on, rather than formal recommendations, to help strengthen pan-Canadian governance and support a more responsive delivery of education-related statistical information.

At the strategic level, opportunities were noted for the CCES to leverage its unique position to foster more effective coordination and information sharing across FPT partners. Strengthening these practices could help address evolving information needs, including those related to timeliness and data gaps. For instance, management could explore opportunities to support the SMC's governance role in ways that would allow emerging priorities and issues to be reviewed more regularly and reflected in strategic direction and oversight.

In addition, given upcoming organizational changes and some stakeholders' lack of clarity regarding the respective roles of multiple divisions, management may wish to consider measures to clarify key points of contact and reinforce cross-divisional coordination. These steps could support greater transparency and contribute to a more consistent stakeholder experience and understanding.

Recommendation

Given the ELMLP's potential to increase data sources, broaden and deepen coverage, expand partnerships and user groups, and diversify funding, a formal recommendation focused on strengthening the platform was identified.

The ACS of Field 8 should ensure that the ELMLP's governance, engagement and analytical capacity are strengthened. Key actions should include

  1. revisiting the establishment of a governance body (e.g., composition, operations) and updating it to ensure appropriate representation and fit for purpose
  2. improving data users' and stakeholders' awareness of, and engagement with, the ELMLP to further support platform use and data interpretation
  3. continuing to work with stakeholders to prioritize integrated and analytical products that reflect the needs and priorities of data users, such as longitudinal data.

Management response and action plan

Recommendation

The ACS of Field 8 should ensure that the ELMLP's governance, engagement and analytical capacity are strengthened. Key actions should include

  1. revisiting the establishment of a governance body (e.g., composition, operations) and updating it to ensure appropriate representation and fit for purpose
  2. improving data users' and stakeholders' awareness of, and engagement with, the ELMLP to further support platform use and data interpretation
  3. continuing to work with stakeholders to prioritize integrated and analytical products that reflect the needs and priorities of data users, such as longitudinal data.

Management response

Management agrees with the recommendation.

  1. The CCES will work with ESDC to critically examine how to strengthen the agency's governance of the ELMLP to leverage it to its maximum.
    1. A critical review of the mandate and purpose of the ELMLP will be carried out, looking at the needs of the client (ESDC), as well as other stakeholders and data users (provincial, territorial and non-governmental actors).
    2. A renewed governance body will be proposed with ESDC at the DG level (aligned with the governance of the provincial and territorial SMC co-managed with CMEC). This will include better coordination across the various components of the ELMLP (PSIS, RAIS, etc.).
  2. A data user workshop or series of webinars will be developed, bringing users together to share results of their research using the ELMLP and for CCES staff to share information on the possibilities and opportunities of the platform. If sufficient interest is expressed, a community of practice will also be created.
  3. The specific approach to stakeholder engagement will be further explored in consultation with external partners and reflected in the development of the ELMLP governance body terms of reference. This will help clarify how structured and ongoing dialogue with key stakeholders and data users can be incorporated.

In exploring this approach, consideration will be given to leveraging existing relationships and forums, including the provincial and territorial governance coordinated through CMEC, as well as other potential governance tables (e.g., the labour market and the research community).

Deliverables and timelines

  1.  
    1. Report summarizing the critical review, including a synthesis of stakeholder needs (ESDC and other partners) (November 2026)
    2. DG-approved terms of reference of the ELMLP governance body (July 2027)
  2. DG-approved proposal for ELMLP data user training and awareness activities (e.g., workshops, webinar series or community of practice), informed by initial scoping and need assessment (November 2026)
  3. Inclusion, within the DG-approved terms of reference of the ELMLP governance body (deliverable a.ii.), of a provision to ensure that integrated and analytical products are prioritized to reflect users' needs and priorities (July 2027)

Appendix A – List of education data products included in the evaluation scope

List of education data products included in the evaluation scope
Surveys and data collectionsType
1. Early childhood learning
Early Learning and Child Care Information HubPortal
Survey on Early Learning and Child Care Arrangements (SELCCA)Survey
Canadian Survey on Early Learning and Child Care (CSELCC)Survey
2. Elementary and secondary education
Elementary-Secondary Education Survey (ESES)Survey
Financial Information of Elementary and Secondary Schools (FINESS)Administrative data
Pan-Canadian Assessment Program (PCAP)Republished from other data source
Programme for International Student Assessment (PISA)Republished from other data source
3. Postsecondary education
Financial Information of Colleges (FINCOL)Administrative data
Financial Information of Universities Survey (FINUNI)Administrative data
National Graduates Survey (NGS)Survey
Postsecondary Student Information System (PSIS)Administrative data
Survey of Approaches to Educational Planning (SAEP)Survey
Survey of Postsecondary Faculty and Researchers (SPFR)Survey
Tuition and Living Accommodation Costs (TLAC)Administrative data
University and College Academic Staff System - Full-time Staff (FT-UCASS)Administrative data
4. Adult learning
National Apprenticeship Survey (NAS)Survey
Programme for the International Assessment of Adult Competencies (PIAAC)Data support
Registered Apprenticeship Information System (RAIS)Administrative data
5. Integrated education information
Education and Labour Market Longitudinal Platform (ELMLP)Platform
Pan-Canadian Education Indicators Program (PCEIP)Compendium
Survey of Federal Government Expenditures in Support of EducationSurvey

Appendix B – Evaluation questions and indicators

Evaluation questions and indicators
Evaluation questionsEvaluation indicators
How well does the ESP's coverage align with key statistical information needs and priorities?
  • Comprehensive overview of the ESP's coverage
  • Extent to which the ESP's coverage addresses the key statistical information needs and priority areas of users
  • Extent to which the statistical information is useful and relevant to users
How effectively does the ESP deliver high-quality education-related statistical information?
  • Extent to which the statistical information meets key user needs in terms of (user perception)
    • Interpretability
    • Timeliness
    • Accessibility
    • Coherence
    • Comparability
    • Accuracy
    • Overall quality
  • Extent to which the governance ensures effective priority setting, oversight and coordination across the FPT levels
  • Identification of factors influencing the program's performance, and assessment of their impacts

Appendix C – Data sources of integrated products and systems

Data sources of integrated products and systems
Data sourcePCEIPTable note *ELMLPTable note *
Elementary and secondary education
Elementary-Secondary Education Survey (ESES)Yes-
Financial Information of Elementary and Secondary Schools (FINESS)Yes-
Postsecondary education
Postsecondary Student Information System (PSIS)Table note *YesYes
National Graduates Survey (NGS)Table note *YesYes
Survey of Approaches to Educational Planning (SAEP)Table note *-Yes
Financial Information of Universities Survey (FINUNI)Yes-
Financial Information of Colleges (FINCOL)Yes-
Tuition and Living Accommodation Costs (TLAC)Yes-
University and College Academic Staff System (UCASS)Yes-
Adult education and training
Registered Apprenticeship Information System (RAIS)Table note *YesYes
National Apprenticeship Survey (NAS)Table note *-Yes
Other sources from Statistics Canada
Survey of Federal Government Expenditures in Support of EducationYes-
Census of Population and National Household SurveyYesYes
Labour Force SurveyYes-
National Longitudinal Survey of Children and Youth—inactiveYes-
System of National AccountsYes-
Longitudinal Administrative Databank-Yes
Longitudinal Immigration Database-Yes
Income tax data from the T1 Family File-Yes
CMEC
Programme for International Student Assessment (PISA)Yes-
Pan-Canadian Assessment Program (PCAP)Yes-
OECD
OECD Indicators of Education SystemsYes-
Main Science and Technology Indicators databaseYes-
Other administrative data
ESDC (eight administrative databases)-Yes
British Columbia kindergarten to Grade 12 data-Yes
Ontario Grade 9 to Grade 12 data-Yes

Interview responses are quantified and categorized in this report using the scale shown in the table below.

Interview quantification scale
TermDefinition
OneOne is used when one participant provided the answer.
FewFew is used when 4% to 15% of participants responded with similar answers. The sentiment of the response was articulated by these participants but not by other participants.
SomeSome is used when 16% to 45% of participants responded with similar answers.
About halfAbout half is used when 46% to 55% of participants responded with similar answers.
Most or a majorityMost or a majority is used when 56% to 89% of participants responded with similar answers.
Almost allAlmost all is used when 90% to 99% of participants responded with similar answers.
AllAll is used when 100% of participants responded with similar answers.

Summary of the Evaluation of the Justice and Community Safety Statistics Program

Justice and community safety statistics play a critical role in understanding Canadians' social well-being and in guiding evidence-based decisions on crime, access to justice and public safety. These data allow governments, researchers and other stakeholders to track trends; evaluate system performance; and develop policies that promote fairness, equity and security nationwide. Recent shifts, such as changing crime patterns, the effects of the COVID-19 pandemic and the rapid move to virtual court processes, have highlighted the growing need for timely, integrated and reliable information to support decision making in an increasingly complex environment.

The Justice and Community Safety Statistics Program, managed by the Canadian Centre for Justice and Community Safety Statistics (CCJCSS) at Statistics Canada, is part of the National Justice Statistics Initiative (NJSI), a federal-provincial-territorial partnership dedicated to the collection and dissemination of consistent and high-quality justice-related data across Canada. As the operational arm of the NJSI, the CCJCSS develops, collects, integrates and analyzes data on crime, victimization and justice administration. In 2019/2020, its mandate was expanded to include community safety and emergency management.

The objective of the evaluation is to provide credible and neutral information on the ongoing performance and future direction of the Justice and Community Safety Statistics Program.

Key findings and recommendations

The evaluation confirms that the CCJCSS plays a vital role in Canada's justice and public safety ecosystem. Its data products, especially analytical reports and data tables, are widely recognized and valued by federal partners, academics, governments at all levels, parliamentarians and the media. Analytical reports provide ready-to-use insights for policy and program development, while data tables enable technical users to conduct custom analyses tailored to their needs. Together, these products support legislative reform, academic research, public accountability and evidence-based decision making.

Despite these strengths, the evaluation identified persistent challenges that limit the program's responsiveness. Timeliness and accessibility remain top concerns. Users reported that products are not issued quickly enough, reducing their relevance and utility. Additionally, gaps in disaggregated data and inconsistencies across jurisdictions constrain efforts to address systemic issues such as overrepresentation and equity in the justice system.

Operational pressures compound these challenges. Modernization initiatives—including the transition from aggregate to microdata, adoption of open-source tools and integration of artificial intelligence (AI)—have increased the complexity of the CCJCSS's work. While the CCJCSS has made progress by leveraging innovation and AI to enhance usability and user experience, it is essential to build on these advancements by further embedding AI into core workflows. This will help streamline processes, reduce routine tasks and accelerate product delivery. However, these necessary changes require significant technical expertise and resources. Ongoing workforce constraints and reliance on cost-recovery funding present sustainability risks, raising concerns about the CCJCSS's capacity to maintain quality and timeliness in a resource-constrained environment.

To remain relevant and maximize value, the CCJCSS must adopt a strategic approach that emphasizes prioritization and workforce resilience. This includes clarifying its mandate to guide priorities, strengthening its cost-recovery governance and focusing resources on developing products that provide the most value to their intended audience. Additionally, strengthening workforce resilience through knowledge transfer and succession planning will further support sustainability.

In light of these findings, the following recommendations are proposed:

Recommendation 1

The assistant chief statistician (ACS) of the Social, Health and Labour Statistics Field (Field 8) should ensure that the CCJCSS adopts a structured, metrics-driven approach to prioritization. This will better align outputs with the CCJCSS's mandate and foster continuous improvement. Key actions should include the following:

  • Clarifying the CCJCSS mandate: Clearly define the CCJCSS's core purpose, scope and intended audience. Establish a framework to identify which outputs and activities most directly support its strategic objectives.
  • Strengthening cost-recovery governance: Enhance coordination within the CCJCSS to ensure that initiatives are aligned with broader strategic priorities.
  • Distinguishing essential versus discretionary activities: Identify which outputs and initiatives are essential to fulfilling the CCJCSS mandate and which are discretionary.
  • Leveraging performance metrics: Systematically assess outputs using metrics such as web analytics, social media engagement, data request trends and consultation feedback to create a shortlist of high-impact products. The user rankings of themes and sub-themes from the evaluation can also be leveraged in this exercise.
  • Prioritizing strategic value: Focus resources on users and outputs that deliver the greatest strategic impact.
  • Monitoring and adjusting: Regularly evaluate the effects of prioritization on timeliness, user satisfaction and employee morale, and adjust the approach as needed.

Recommendation 2

The ACS of Field 8 should ensure that the CCJCSS develops a succession and knowledge transfer plan that includes the following:

  • Identifying critical tasks and responsibilities: Pinpoint essential operational activities.
  • Mapping institutional knowledge holders and retirement timelines: Assess areas of risk to prioritize knowledge transfer.
  • Developing clear documentation protocols: Create step-by-step guides and templates, and ensure storage in accessible repositories.
  • Mentoring and shadowing: Provide opportunities for newer staff to learn from experienced colleagues before departures.
  • Aligning training and capacity building: Build workforce skills and capacity to keep pace with growing demands and evolving tasks.
  • Monitoring and updating: Review the plan regularly to keep it current and effective.

Request for information — Society and community

Under the authority of the Statistics Act, Statistics Canada is hereby requesting the following information, which will be used solely for statistical and research purposes and will be protected in accordance with the provisions of the Statistics Act and any other applicable law. This is a mandatory request for data.

Canadian military experience

Canadian Armed Forces personnel file

What information is being requested?

Statistics Canada is requesting employment history and occupational data on a more frequent basis including additional information on those who have served or are currently serving in the Canadian Armed Forces, who were enrolled as of January 1, 1972 or after.

What personal information is included in this request?

This request includes expanded employment equity information, if available, to complement information already held by Statistics Canada dating back to 1972 which includes personal information such as the members name, sex, gender, date of birth, social insurance number, address and contact information which are required to perform data linkages, for statistical purposes only. Once the data are linked, the personal identifiers will be replaced by an anonymized person key.

What years of data will be requested?

Statistics Canada will request the information on a more frequent (annual) and ongoing basis.

From whom will the information be requested?

This information is being requested from the Department of National Defence.

Why is this information being requested?

Statistics Canada requires this information to create and publish accurate and up-to-date statistics on the number of Canadians who have previously served or are currently serving in the Canadian Armed Forces (CAF), and to provide additional information on their sociodemographic and labour characteristics. These statistics will be used to help better serve this population by informing policies and programs administered by Veterans Affairs Canada (VAC), the Department of National Defence (DND), and other Veteran support organizations. Statistics Canada requests this information so that these policies and programs can be adjusted to meet the needs of Canadians.

Additionally, the information will be used to support the Military and Veteran Status file (MVSF) for validation activities related to the Census of Population and as a sample frame for Veteran and military personnel surveys.

Statistics Canada may also use the information for other statistical and research purposes.

Why were these organizations selected as data providers?

The Department of National Defense is responsible for collecting and maintaining up-to-date data on military personnel enrolled in the CAF.

When will this information be requested?

June 2026

What Statistics Canada programs will primarily use these data?

When was this request published?

June 16, 2026

Evaluation of the Justice and Community Safety Statistics Program

Evaluation Division
February 2026

Table of contents

The report in short

Justice and community safety statistics play a critical role in understanding Canadians' social well-being and in guiding evidence-based decisions on crime, access to justice and public safety. These data allow governments, researchers and other stakeholders to track trends; evaluate system performance; and develop policies that promote fairness, equity and security nationwide. Recent shifts, such as changing crime patterns, the effects of the COVID-19 pandemic and the rapid move to virtual court processes, have highlighted the growing need for timely, integrated and reliable information to support decision making in an increasingly complex environment.

The Justice and Community Safety Statistics Program, managed by the Canadian Centre for Justice and Community Safety Statistics (CCJCSS) at Statistics Canada, is part of the National Justice Statistics Initiative (NJSI), a federal-provincial-territorial partnership dedicated to the collection and dissemination of consistent and high-quality justice-related data across Canada. As the operational arm of the NJSI, the CCJCSS develops, collects, integrates and analyzes data on crime, victimization and justice administration. In 2019/2020, its mandate was expanded to include community safety and emergency management.

The objective of the evaluation is to provide credible and neutral information on the ongoing performance and future direction of the Justice and Community Safety Statistics Program.

Key findings and recommendations

The evaluation confirms that the CCJCSS plays a vital role in Canada's justice and public safety ecosystem. Its data products, especially analytical reports and data tables, are widely recognized and valued by federal partners, academics, governments at all levels, parliamentarians and the media. Analytical reports provide ready-to-use insights for policy and program development, while data tables enable technical users to conduct custom analyses tailored to their needs. Together, these products support legislative reform, academic research, public accountability and evidence-based decision making.

Despite these strengths, the evaluation identified persistent challenges that limit the program's responsiveness. Timeliness and accessibility remain top concerns. Users reported that products are not issued quickly enough, reducing their relevance and utility. Additionally, gaps in disaggregated data and inconsistencies across jurisdictions constrain efforts to address systemic issues such as overrepresentation and equity in the justice system.

Operational pressures compound these challenges. Modernization initiatives—including the transition from aggregate to microdata, adoption of open-source tools and integration of artificial intelligence (AI)—have increased the complexity of the CCJCSS's work. While the CCJCSS has made progress by leveraging innovation and AI to enhance usability and user experience, it is essential to build on these advancements by further embedding AI into core workflows. This will help streamline processes, reduce routine tasks and accelerate product delivery. However, these necessary changes require significant technical expertise and resources. Ongoing workforce constraints and reliance on cost-recovery funding present sustainability risks, raising concerns about the CCJCSS's capacity to maintain quality and timeliness in a resource-constrained environment.

To remain relevant and maximize value, the CCJCSS must adopt a strategic approach that emphasizes prioritization and workforce resilience. This includes clarifying its mandate to guide priorities, strengthening its cost-recovery governance and focusing resources on developing products that provide the most value to their intended audience. Additionally, strengthening workforce resilience through knowledge transfer and succession planning will further support sustainability.

In light of these findings, the following recommendations are proposed:

Recommendation 1

The assistant chief statistician (ACS) of the Social, Health and Labour Statistics Field (Field 8) should ensure that the CCJCSS adopts a structured, metrics-driven approach to prioritization. This will better align outputs with the CCJCSS's mandate and foster continuous improvement. Key actions should include the following:

  • Clarifying the CCJCSS mandate: Clearly define the CCJCSS's core purpose, scope and intended audience. Establish a framework to identify which outputs and activities most directly support its strategic objectives.
  • Strengthening cost-recovery governance: Enhance coordination within the CCJCSS to ensure that initiatives are aligned with broader strategic priorities.
  • Distinguishing essential versus discretionary activities: Identify which outputs and initiatives are essential to fulfilling the CCJCSS mandate and which are discretionary.
  • Leveraging performance metrics: Systematically assess outputs using metrics such as web analytics, social media engagement, data request trends and consultation feedback to create a shortlist of high-impact products. The user rankings of themes and sub-themes from the evaluation can also be leveraged in this exercise.
  • Prioritizing strategic value: Focus resources on users and outputs that deliver the greatest strategic impact.
  • Monitoring and adjusting: Regularly evaluate the effects of prioritization on timeliness, user satisfaction and employee morale, and adjust the approach as needed.

Recommendation 2

The ACS of Field 8 should ensure that the CCJCSS develops a succession and knowledge transfer plan that includes the following:

  • Identifying critical tasks and responsibilities: Pinpoint essential operational activities.
  • Mapping institutional knowledge holders and retirement timelines: Assess areas of risk to prioritize knowledge transfer.
  • Developing clear documentation protocols: Create step-by-step guides and templates, and ensure storage in accessible repositories.
  • Mentoring and shadowing: Provide opportunities for newer staff to learn from experienced colleagues before departures.
  • Aligning training and capacity building: Build workforce skills and capacity to keep pace with growing demands and evolving tasks.
  • Monitoring and updating: Review the plan regularly to keep it current and effective.

Acronyms and abbreviations

AI

Artificial intelligence

ACS

Assistant chief statistician

CCJCSS

Canadian Centre for Justice and Community Safety Statistics

CJS

Criminal justice system

DMs

Deputy ministers

FPT

Federal-provincial-territorial

LOCNJSI

Liaisons Officers Committee of the National Justice Statistics Initiative

NJSI

National Justice Statistics Initiative

PSES

Public Service Employee Survey

PSPM

Public Service Performance Management

SJISB

Social, Justice and Indigenous Statistics Branch

StatCan

Statistics Canada

What is covered

Background

Justice and community safety statistics are foundational to monitoring the criminal justice system in Canada and informing evidence-based policy and program decisions on crime, access to justice and public safety. These statistics enable governments, researchers and stakeholders to monitor trends, assess system performance and design interventions that promote fairness, equity and security across the country. The justice system is always evolving, underscoring the need for timely, integrated and reliable data to support decision-making in a complex environment.

Governance

Established in 1981, the National Justice Statistics Initiative (NJSI) is a federal-provincial-territorial (FPT) partnership that brings together deputy ministers (DMs) responsible for justice and public safety, alongside the chief statistician of Canada, to ensure the collection and dissemination of consistent, high-quality justice-related data nationwide. The operational arm of the NJSI is the Canadian Centre for Justice and Community Safety Statistics (CCJCSS), which is part of Statistics Canada (StatCan). It supports Canada's justice system by providing accurate, comparable and comprehensive data on crime, victimization, courts, corrections, policing, and civil and criminal justice administration. Oversight of the CCJCSS's work is provided by the Liaison Officers Committee of the NJSI (LOCNJSI), which consists of officials from federal departments and provincial or territorial ministries, each appointed by their respective DMs (Figure 1). In 2019/2020, the CCJCSS's mandate was expanded to include community safety and emergency management, reflecting the growing importance of public safety data and social determinants of crime.

Figure 1 Canadian Centre for Justice and Community Safety Statistics governance
Figure 1
Description - Figure 1

Figure 1 illustrates the governance structure of the Canadian Centre for Justice and Community Safety Statistics (CCJCSS) within the National Justice Statistics Initiative (NJSI), shown as a vertical flow from strategic oversight to operational delivery and identifies the Statistics Canada official responsible and their role at each level.

1. Governing Body of the NJSI

  • The governing body provides strategic direction to the initiative, ensuring the collection and dissemination of consistent, reliable justice-related data across Canada to support evidence-based policy, transparency, and collaboration among FPT partners. Members are FPT DMs responsible for justice and public safety in Canada and the Chief Statistician.
  • Statistics Canada role
    The Chief Statistician (or Assistant Chief Statistician of Field 8) participates in governing body meetings as needed, supporting NJSI work performed by the CCJCSS within legislative, system integrity, and budgetary limits.

2. Liaison Officers Committee of the NJSI (LOCNJSI)

  • The LOCNJSI oversees the work of the CCJCSS on behalf of the NJSI governing body. Members are senior officials from FPT ministries responsible for justice and public safety in their jurisdictions, appointed by their respective DMs.
  • Statistics Canada role
    The Director General, Social, Justice and Indigenous Statistics, represents StatCan as a member of the LOCNJSI and participates in NJSI discussions and decisions.

3. Canadian Centre for Justice and Community Safety Statistics (CCJCSS)

  • The CCJCSS, as operational arm of the NJSI, produces statistics and insights to inform legislative, policy, management, and research agendas of the FPT partners and the public.
  • Statistics Canada role
    Led by a director, the CCJCSS also provides secretariat support to the NJSI by coordinating working groups, providing client services, and facilitating member communication.

Legislation and program direction

The program operates under legislative authority provided by the Statistics Act, which requires the collection of criminal statistics from courts, correctional institutions and law enforcement agencies. In practice, the CCJCSS also provides data to support broader legislative and policy objectives, including initiatives such as bail reform, Indigenous justice strategies and gender-based violence prevention. Its outputs cover themes such as crime, courts, corrections, victimization, justice system equity and emergency management. The products are widely used by FPT governments, law enforcement agencies, academics, non-governmental organizations and the media.

The demand for CCJCSS data continues to grow as stakeholders seek more granular, timely and disaggregated information to address complex issues such as systemic overrepresentation, hate crimes and emerging threats like cybercrime. At the same time, modernization efforts—including the transition to open-source tools, integration of artificial intelligence (AI) and adoption of advanced analytics—are reshaping the program's operations. These changes aim to improve timeliness, enhance accessibility and enable richer insights through linked datasets and predictive modelling.

About the evaluation

Authority

The evaluation was conducted under the authority of the approved StatCan Risk-based Audit and Evaluation Plan 2025/2026 to 2029/2030, in accordance with the Treasury Board Policy on Results.

Objective and scope

The objective of the evaluation is to provide credible and neutral information on the ongoing performance and future direction of the Justice and Community Safety Statistics Program. The scope, established in collaboration with the office of primary interest, included the CCJCSS data products outlined in Appendix A. The evaluation was conducted from August to December 2025.

Approach and methodology

During the planning phase of the evaluation, a key priority identified by the office of primary interest was to clarify the program's strategic direction and determine where efforts should be concentrated to achieve the greatest impact. To support this objective, the evaluation was intentionally designed to address critical questions about the relevance and utility of the program's suite of data products and to identify which areas deliver the most value to users.

Given the program's extensive and diverse range of topics and outputs, it was not feasible to engage stakeholders on every individual product. Instead, the evaluation team collaborated with program management to organize products into overarching themes and sub-themes, creating a structured framework for more effective engagement. This approach allowed stakeholders to focus on broader areas of interest rather than individual outputs, ensuring meaningful input while maintaining efficiency.

To operationalize this framework, a comprehensive table of CCJCSS themes, sub-themes and corresponding products (Appendix A) was developed. This resource was used throughout data collection, both in key informant interviews and in the user survey, enabling participants to prioritize the themes and products most relevant to their work.

The following two evaluation questions were identified:

  1. To what extent is the overall suite of data products produced by the CCJCSS relevant and useful to users?
  2. Where should the program focus to produce the most value for users?

More information about the evaluation questions and related indicators can be found in Appendix B.

The data collection methods outlined in Figure 2 were used. The findings outlined in this report are based on the triangulation of these data collection methods.

Figure 2 Data collection methods
Figure 2
Description - Figure 2

Figure 2 outlines the methods used by the evaluation for data collection.

  • Key informant interviews: Key informant interviews included 15 internal interviews with 22 people and 22 external interviews with 27 people. Semi-structured interviews were conducted with data users from FPT government organizations, academia, and other partners (external), as well as CCJCSS representatives and other Statistics Canada staff (internal).
  • Data user survey: The data user survey was sent to 707 users, with 114 completed surveys, for a response rate of 16%. A web-based survey was used to capture information and feedback from CCJCSS data users.
  • Document review: Review of StatCan's documents, and web trends information.

Three main limitations were identified, and mitigation strategies were employed, as outlined in Table 1.

Table 1 Limitations and mitigation strategies
LimitationsMitigation strategies
The perspectives gathered through external interviews may not be fully representative.External interviewees were selected using specific criteria to maximize strategic reach for the interviews and multiple recruitment strategies were used. A survey of users was implemented to gather user perspectives from a broader group.
Self-report bias can occur in internal interviews, where individuals reporting on their own activities may portray them in a more positive light.To the extent possible, feedback and reflections on activities were sought from a range of perspectives. A review of program documents also supported a balanced perspective.
There was lower uptake to the survey of users (16%, n=114) and, therefore, findings from the survey may not be fully representative of the entire user group population.The evaluation included interviews with users across population groups to establish a more representative sample. Purposeful sampling of interviewees aimed to gather feedback from diverse users.

What we learned

Performance

To what extent is the overall suite of data products produced by the CCJCSS relevant and useful to users?

CCJCSS data products are highly relevant, widely used and integral to a broad spectrum of activities, from policy development and research to public communication and accountability. These products underpin evidence-informed decision making, enabling policy makers, researchers and FPT governments to design interventions grounded in reliable evidence. Their strong reputation for quality and reliability positions the CCJCSS as a cornerstone of Canada's justice and community safety data infrastructure. However, opportunities remain to enhance visibility, accessibility and timeliness to ensure continued responsiveness to evolving user needs.

In assessing the program's performance, the evaluation examined the user landscape by identifying key user groups, their profiles and how they use CCJCSS data products; explored user experience through their perceptions of relevance, utility, accessibility, methodological clarity, quality and timeliness; and reviewed how the program has adapted to evolving needs, while noting ongoing challenges that impact responsiveness.

User profile

Key users and familiarity with CCJCSS products

There are several key user groups accessing CCJCSS data products at varying frequencies. Almost all users indicated that they have a high level of familiarity with CCJCSS data products.

The user landscape for CCJCSS data products is diverse, encompassing both internal stakeholders at StatCan and a wide array of external users, such as FPT government departments, law enforcement agencies, academics, non-governmental organizations and municipal governments. Almost all users reported being somewhat or very familiar with CCJCSS products, particularly with those most relevant to their work. Internal users and other federal departments leverage these products to support interdepartmental initiatives and legislative priorities. External stakeholders such as the media and parliamentarians also rely on CCJCSS outputs, particularly for crime-related topics.

From 2022 to 2024, the CCJCSS received 516 media requests, with the majority (444) focused on crime, including policing, violence and victimization. The remaining inquiries pertained to the court system, correctional services and the other thematic areas (Figure 3).

Figure 3 Media requests, 2022 to 2024
Figure 3
Description - Figure 3

Figure 3 presents the number of media requests received between 2022 and 2024, disaggregated by the following thematic areas (crime, court system, correctional services, emergency management and natural disasters, community safety, pathways through the justice system, and justice system equity and overrepresentation).

2022

  • Total media requests: 207
  • Crime: 179
  • Other subject areas (court system; correctional services; emergency management and natural disasters; community safety; pathways through the justice system; justice system equity and overrepresentation): 28

2023

  • Total media requests: 191
  • Crime: 162
  • Other subject areas (court system; correctional services; emergency management and natural disasters; community safety; pathways through the justice system; justice system equity and overrepresentation): 29

2024

  • Total media requests: 118
  • Crime: 103
  • Other subject areas (court system; correctional services; emergency management and natural disasters; community safety; pathways through the justice system; justice system equity and overrepresentation): 15
Frequency of use and importance of the data to users

About half of users interviewed used CCJCSS products frequently, while the other half used them infrequently. Most survey respondents indicated that they used CCJCSS products monthly. Two-thirds of users considered these data products to be extremely or very important to their work, indicating notable relevance and utility for the program and its outputs.

Patterns of use varied—about half of interviewed users accessed these products frequently, while the other half used them less frequently. Survey data revealed that most respondents used CCJCSS products monthly, with some accessing them weekly and a few daily (Figure 4). This variability reflects the program's ability to serve both routine and specialized data needs.

Figure 4 Frequency of use (surveyed users)
Figure 4
Description - Figure 4

Figure 4 presents how often surveyed users reported using CCJCSS data, categorized as monthly, weekly, or daily use.

Among surveyed users, 56% reported monthly use of CCJCSS data. Weekly use was reported by 35% of surveyed users, while 9% reported daily use.

Two-thirds of surveyed users rated CCJCSS products as extremely or very important to their work (Figure 5). Interviewees described these products as critical, integral and essential for policy development, program planning and legislative analysis. One interviewee noted that the data are critically important to their work and that they used it daily to inform policy, to develop Memorandums to Cabinet and for budgeting decisions. The significant reliance on CCJCSS outputs underscores their relevance across multiple sectors and decision-making contexts.

Figure 5 Importance to their work (surveyed users)
Figure 5
Description - Figure 5

Figure 5 presents how surveyed users rated the importance of CCJCSS data to their work, categorized as slightly or not important, moderately important, and extremely or very important.

Among surveyed users, 66% reported that CCJCSS data were extremely or very important to their work. Moderately important was reported by 20% of surveyed users, while 14% reported that CCJCSS data were slightly or not important to their work.

Reach and visibility

Crime and justice statistics rank as one of the top five subject areas at Statistics Canada, with 6.2 million page views and 143,000 downloads from 2022/2023 to 2024/2025.

Crime and justice statistics rank among the top five subjects accessed on the StatCan website, with over 6.2 million page views and 143,000 downloads in recent years. Publications remain the most viewed and downloaded product type, followed by data tables and analytical reports (figures 6 and 7). Media engagement also underscores the visibility of the program; as noted earlier, the CCJCSS responded to 516 media requests from 2022 to 2024, with most inquiries focusing on crime, policing, violence and victimization.

Figure 6 Statistical outputs accessed by Canadians – All products page views (2022/2023 to 2024/2025)
Figure 6
Description - Figure 6

Figure 6 presents the number of page views for statistical outputs accessed on the StatCan website by Canadians by subject area during the 2022/2023 to 2024/2025 period.

  • Health: 11 million page views
  • Prices and price indexes: 9.7 million page views
  • Reference: 8.2 million page views
  • Labour: 6.3 million page views
  • Crime and justice: 6.2 million page views
  • Income, pension, spending and wealth: 5.4 million page views
  • Economic accounts: 5.2 million page views
  • Population and demography: 4.1 million page views
  • Agriculture and food: 2.4 million page views
  • Society and community: 2.1 million page views
  • Education, training and learning: 1.8 million page views
Figure 7 Statistical outputs accessed by Canadians – All products downloads (2022/2023 to 2024/2025)
Figure 7
Description - Figure 7

Figure 7 presents the number of downloads of statistical outputs from the StatCan website by Canadians by subject area during the 2022/2023 to 2024/2025 period.

  • Prices and price indexes: 428 thousand downloads
  • Labour: 425 thousand downloads
  • Economic accounts: 332 thousand downloads
  • Health: 261 thousand downloads
  • Population and demography: 199 thousand downloads
  • Agriculture and food: 164 thousand downloads
  • Census: 149 thousand downloads
  • Crime and justice: 143 thousand downloads
  • Reference: 138 thousand downloads
  • Income, pensions, spending and wealth: 137 thousand downloads
  • Business and consumer services and culture: 103 thousand downloads
Most useful products according to users

Analytical products and data tables were rated as extremely or very useful by users. Analytical products were generally more useful to non-technical users, while data tables supported custom analysis for data-savvy users.

Analytical products and data tables were consistently rated as the most useful outputs. Analytical products were valued for providing ready-to-use insights that support policy development, direct regulations and legislation, research, and teaching, while data tables enabled technical users with statistical backgrounds to conduct custom analyses. Data tables were considered most useful because they can be used to build their own products relevant to their needs. Infographics and dashboards were also considered helpful for communicating complex information in accessible formats (Table 2).

Table 2 Product types that users found most useful for their work
ProductPercent
Users surveyed
Analytical products80%
Data tables67%
Infographics62%
Reference information61%
The Daily55%
Dashboards47%
Raw datasets41%
Users interviewed
Analytical products82%
Data tables82%
Raw datasets68%
The Daily68%
Dashboards50%
Reference Info45%
Infographics41%
Themes and sub-themes most useful for users' work

All 7 themes and 31 sub-themes were ranked as important to different user groups, indicating that the diverse suite of CCJCSS products meets the needs of a wide range of users. While all seven themes were ranked as important to some user groups, Crime, Justice System Equity and Overrepresentation, Community Safety, and Court System were ranked highest in importance.

All seven thematic areas were considered important by different user groups (Figure 8). Crime ranked the highest in importance for users' work, reflecting the ongoing demand for timely and detailed data on policing, violence and victimization. Users emphasized that crime statistics are essential for monitoring public safety trends, informing law enforcement strategies, and shaping legislative responses to pressing concerns like organized crime and gender-based violence. The theme of Justice System Equity and Overrepresentation ranked second in importance for users' work, underscoring the growing need for disaggregated data to address systemic disparities. Users highlighted that understanding the experiences of Indigenous Peoples, racialized communities and other marginalized groups within the justice system is vital for advancing equity-focused policies and programs. Community Safety was also identified as a theme of high importance for users' work, reflecting the shift toward a more holistic approach to justice that considers social determinants of crime and public well-being. Court System ranked among the top four themes because of its relevance for monitoring case flow, court outcomes and access to justice.

Figure 8 Weighted ranking of themes (percent of overall rankings)
Figure 8
Description - Figure 8

Figure 8 presents the weighted distribution of overall rankings by theme with the top four themes highlighted.

  • Crime: 28%
  • Justice system equity: 16%
  • Community safety: 15%
  • Court system: 14%
  • Pathways through the justice system: 10%
  • Correctional services: 10%
  • Emergency management and natural disasters: 4%

All sub-themes under the seven overarching themes were considered important by different user groups. Figure 9 illustrates the ranking of sub-themes across all themes, highlighting areas of greatest perceived value. Each theme consists of three sub-themes, except for Crime, which encompasses a broader set of topics because of its complexity and public prominence. The sub-themes under Crime that were ranked lower in importance included Online Child Exploitation, Rural Crime, Residential Facilities for Victims of Abuse, Police Resources and Expenditures, Firearm-Related Crime, and Cybercrime (not listed in Figure 9).

Figure 9 Weighted ranking of sub-themes (percent of overall ranking within theme)
Figure 9
Description - Figure 9

Figure 9 presents the weighted ranking of sub-themes shown as percentages within each theme. Themes are ranked by overall prominence  from top to bottom. Note that sub-theme percentages compare only within each theme.

Theme: Crime
Sub-themes:

  • Intimate partner, gender-based and family violence: 39%
  • Victimization: 11%
  • Crime count: 10%
  • Other: 40%

Theme: Justice system equity
Sub-themes:

  • Overrepresentation: 36%
  • Police reported: 34%
  • Socio-economic profiles: 30%

Theme: Community safety
Sub-themes:

  • Calls for service: 41%
  • Missing persons: 39%
  • Safe TO: 20%

Theme: Court system
Sub-themes:

  • Adults and youth: 42%
  • Court outcomes: 34%
  • Civil and family: 24%

Theme: Pathways through the justice system
Sub-themes:

  • Reoffending pattern: 41%
  • Court outcomes (linkage): 35%
  • Pan-Canadian contact: 24%

Theme: Correctional services
Sub-themes:

  • Adults and youth: 47%
  • Reoffending patterns: 36%
  • Expenditures: 17%

Theme: Emergency management and natural disasters
Sub-themes:

  • Ground search and rescue: 39%
  • National fire information: 32%
  • Flood risk information: 29%
How products are used

CCJCSS data products were used in many ways by different user groups, highlighting how the diversity of themes, sub-themes and products are relevant and useful for users. Almost all (96%) surveyed users agreed or strongly agreed that the data products produced by the CCJCSS are useful.

The evaluation found that CCJCSS data products are widely accessed, reflecting their versatility and importance. An overwhelming 96% of surveyed users agreed or strongly agreed that CCJCSS data products are useful, underscoring their critical role in supporting evidence-based practices and informed decision making. Users indicated that data products are used for the following:

  • Comparative analysis and contextualization: Users across jurisdictions leveraged CCJCSS data to compare regional, national and international trends, supporting evidence-informed decisions at the local level. Comparative analysis is particularly valuable for law enforcement agencies and provincial ministries seeking to benchmark performance, identify disparities and implement targeted interventions.
  • Decision making, policy development and program planning: CCJCSS outputs are integral in evidence-informed decision making to shape public policy and design programs that address justice and community safety priorities. Users shared that they rely on these data to inform legislative reforms, allocate resources and monitor progress on initiatives such as bail reform, gender-based violence prevention and Indigenous justice strategies. For example, crime severity indices and court processing data help policy makers assess system performance and identify areas requiring intervention.
  • Research and teaching: Academic institutions and research organizations used CCJCSS data for research, teaching and to supplement other forms of analyses (i.e., qualitative data). These datasets enable longitudinal analyses of crime trends, systemic overrepresentation and victimization patterns, often serving as the foundation for scholarly publications and graduate-level coursework. Researchers highlighted that CCJCSS products provide the credibility and rigour necessary for peer-reviewed studies.
  • Updating government: CCJCSS data were frequently used to respond to parliamentary questions, inform committee reports and support ministerial briefings. These outputs provided legislators with credible, up-to-date information on crime rates, court processing times and systemic issues such as overrepresentation.
  • Citation in the media: CCJCSS products were widely referenced in media coverage, shaping public understanding of crime and justice issues, highlighting the reach and influence of the Justice and Community Safety Statistics Program.

User experience

Users generally had a positive experience with CCJCSS data products and had confidence in their quality and usefulness, though some noted gaps in disaggregation and consistency across jurisdictions. Accessibility is mixed, with frequent users navigating products easily and others finding the website and microdata access challenging. While documentation is significant, technical outputs can be difficult for non-specialists. Timeliness is the main concern, with users seeking faster updates and more frequent releases.

  • Quality: Users expressed confidence in the quality of CCJCSS data products. Of users surveyed, 85% agreed or strongly agreed that the products are of good quality, citing StatCan's rigorous standards, validation processes and transparency regarding limitations. Many described the CCJCSS as the "gold standard" for statistical data, noting that metadata and caveats are consistently provided. Analytical products were praised in particular for their depth and reliability, enabling users to reference them confidently in policy documents and academic research. However, some concerns were raised about court data quality, which varies by province because of inconsistent reporting practices.
  • Accuracy: While most users agreed that CCJCSS data accurately measure what they intend to, several noted gaps in capturing the full scope of issues. The most common concern was insufficient disaggregation, particularly for race, Indigenous identity and intersectional factors. Users emphasized that without granular data, analyses risk overlooking systemic inequities. For example, understanding differences in justice system overrepresentation by gender, ethnicity or offender history is difficult when data cannot be disaggregated. Additionally, inconsistencies in data collection across jurisdictions and missing years for certain provinces and territories limit trend analysis and comparability. These challenges were not attributed to CCJCSS methodology but to variations in the quality, completeness and consistency of data received from provinces and territories. These gaps highlight the need for continued support for jurisdictions to improve data collection, especially for complex topics like bail and recontact.
  • AccessibilityFootnote 1: Accessibility to CCJCSS data products presents a mixed picture. While frequent users generally find dashboards and data tables straightforward to navigate, many stakeholders, especially occasional users, reported difficulties when locating products on the StatCan website. Accessing information often demands specialized knowledge, making the process burdensome for non-experts, and the website itself is frequently described as not user-friendly. Furthermore, obtaining microdata through research data centres is seen as time-consuming and administratively complex, often requiring multiple agreements and, in some cases, travel. To address these challenges, users have suggested several improvements: introducing a centralized product list (similar to Appendix A) on the website, streamlining legal agreements for organizations, implementing AI-powered search tools that mimic Google-style queries, and enhancing visualization options, such as interactive dashboards that allow users to filter data directly within tables. During the evaluation period, StatCan started a comprehensive redesign of its website. In July 2025, the agency launched a new home page featuring a cleaner and more engaging layout, updated branding, intuitive navigation and a streamlined structure. This refreshed home page represents the initial phase of the agency's broader website modernization project to enhance user experience.
  • Interpretation and understanding: Most users found CCJCSS products to be clear and well documented, with comprehensive definitions and methodological notes. However, some products are highly technical, posing challenges for non-specialist audiences. Suggestions to improve interpretability and understanding include providing navigation webinars or tutorials for raw datasets, revising terminology within agency standards for racialized or Indigenous identity data to reflect local and culturally appropriate definitions, and incorporating more plain language.
  • Timeliness: Timeliness was identified as the most significant challenge by users. Standard releases and custom data requests are not issued quickly enough, reducing relevancy and utility for users' work. Users stressed the need for more frequent updates and shorter turnaround times, particularly for emerging issues such as bail reform and race-based data. There is a strong desire for immediate and up-to-date data that can be used for real-time decision making. Suggestions included leveraging automation and AI tools to expedite custom tabulations, and exploring opportunities for preliminary data releases to meet urgent needs. The CCJCSS recognizes ongoing challenges related to the timeliness of its data products and is aware of the need for continued improvement in this area.

Overall, CCJCSS products were trusted and widely valued, but improvements in accessibility, timeliness and interpretability are critical to meeting evolving user needs. Addressing these areas will enhance user experience, strengthen evidence-based decision making, and position the CCJCSS as a leader in justice and community safety data modernization.

Evolution to meet user needs

CCJCSS program adaptations

The CCJCSS has demonstrated significant adaptability in response to evolving user needs, expanding its scope beyond traditional justice domains to include community safety and emergency management. The program has modernized its data collection and analytical practices, moving from aggregate reporting to micro-level data and linked datasets that enable more nuanced analysis. These changes have improved the relevance and utility of CCJCSS products, particularly for policy development and equity-focused research.

  • Expansion of scope and themes: Originally focused on policing, courts and corrections, the CCJCSS has broadened its mandate to include community safety and emergency management, reflecting a shift toward a more holistic approach to measuring the health and resilience of the justice and community safety ecosystem. This expansion has introduced new indicators, such as calls for service, missing persons standards and bail, and supported initiatives like SafeTO and emergency preparedness data, aligning with user priorities for upstream, preventative measures and integrated service delivery.
  • Modernization and technical innovation: The CCJCSS has transitioned from aggregate data to micro-level datasets, enabling more detailed and disaggregated analysis. The volume of microdata processed has grown exponentially, from approximately 10,000 cells per year to over 1 billion, driving ongoing modernization and adoption of new analytical tools and software. Further, this evolution supports linkage across surveys (e.g., courts and corrections) and integration with external datasets such as health and census data. Linked data products, such as the Pan-Canadian Recontact Project, allow users to examine pathways through the justice system and assess systemic issues like overrepresentation. Users praised these innovations for providing richer insights and supporting evidence-based policy reforms, such as bail reform and youth justice outcomes.
  • Strengthened collaboration: The CCJCSS has strengthened its analytical capacity through partnerships with other StatCan divisions (e.g., Census Operations, Health Statistics) and external organizations such as the Centre for Addiction and Mental Health and the Canadian Centre for Child Protection, funded by Public Safety Canada. These collaborations enable the CCJCSS to provide context-rich analysis rather than simply reporting counts. For example, when a new offence is added to the Criminal Code, partnerships with justice and policing help explain why crime rates appear to rise, offering users a more accurate interpretation. Similarly, a partnership with Justice Canada has provided permanent funding for modernization initiatives, including efforts to address overrepresentation in the justice system. This work supports the development of macro-simulation models to examine pathways through the justice system and assess disparities related to discrimination and access to justice. These strengthened collaborations ensure that more data are available to users, supporting impactful analysis and evidence-based decision making.
Challenges and constraints

While the adaptations noted above have evolved in response to user needs, this evolution has been constrained by structural challenges, including reliance on cost recovery, and resource and workforce challenges. These constraints have slowed innovation and impacted the timeliness of outputs, despite strong user demand for more granular and real-time data.

  • Cost-recovery constraints: Despite growing complexity and demand, the CCJCSS operates with funding levels designed for aggregate data collection (i.e., requiring less complex analysis), creating a persistent resource gap. The program relies heavily on cost-recovery arrangements, which prioritize funded projects over broader program priorities. This model limits agility and constrains the ability to pursue emerging issues or produce outputs outside partner-driven priorities.
  • Resource and workforce constraints: The shift to microdata and linked datasets have increased analytical complexity requiring advanced technical skills and longer processing times. Staff face heavy workloads, procedural requirements, and limited opportunities for training and knowledge transfer, raising concerns about burnout and succession planning. Data from internal document review indicate that internal resources have been reduced over the last few years; however, the complexity of the work continues to grow, as does the time it takes to complete tasks. These pressures affect the program's ability to maintain timeliness, innovate and acquire mandatory internal approvals for AI initiatives, despite strong interest in adopting tools like AI for automation and data extraction.

Program direction

Where should the program focus to produce the most value to users?

The CCJCSS should focus on areas that maximize strategic alignment, operational efficiency and responsiveness to user needs. While all program components provide value, prioritizing themes, products and processes most closely aligned with the CCJCSS's mandate and strategic objectives will deliver the greatest impact. Key priorities include clarifying mandated obligations, strengthening cost-recovery governance and embedding workforce planning into long-term strategies. These actions, in addition to continued advancements in technology and innovation, will enable the CCJCSS to sustain relevance, improve timeliness and meet growing demands in a resource-constrained environment.

In reviewing program direction, the evaluation highlighted several key factors that shape the operational environment of the CCJCSS. Rather than serving as direct actions, these factors provide essential context for the proposed recommendations. These factors include strategic alignment, operational complexity, workforce well-being, and technology and innovation.

Strategic alignment

Uncertainty surrounding legislative requirements and reliance on cost-recovery funding have created significant challenges for the CCJCSS in maintaining a clear and unified strategic direction. These factors limit responsiveness to emerging priorities, create gaps in addressing public-interest topics and challenge efforts to maintain a cohesive strategic direction.

Interpretation of CCJCSS mandate

Sections 26 to 29 of the Statistics Act provide the legislative authority for StatCan to operate and provides the CCJCSS with a broad mandate to collect and disseminate justice-related data. However, the evaluation revealed uncertainty within the CCJCSS regarding the scope of this mandate. One key informant shared that there is a responsibility for the CCJCSS to collect information on the administration of the justice system, but the definition is broad and the legal mandate is unclear.

This ambiguity has implications for modernization efforts. As justice data needs evolve, such as the demand for bail indicators and disaggregated identity data, the CCJCSS recognizes that more agile data collection and sharing may be required. Clarity on which activities of the program are directly mandated is important for the program to prioritize emerging needs and secure resources to address them.

Focus on cost recovery

A significant portion of the CCJCSS's work is funded through cost-recovery agreements with federal partners, including Justice Canada and Public Safety Canada. While these partnerships enable important initiatives, such as justice modernization and equity-focused projects, they also create dependency on external priorities. This reliance limits the flexibility to produce outputs on topics of high public interest that lack dedicated funding, such as youth crime or motor vehicle theft, despite their prominence in media and public discourse. Staff expressed concern that, without published analysis on these issues, misinformation may persist. This underscores the importance of finding ways to make reliable data on these topics publicly available to counter misinformation and meet public interest.

Additionally, cost-recovery decisions are often made at the section level, rather than at the program level, resulting in possible parallel efforts rather than a unified program direction. This fragmentation underscores the need for stronger coordination to align cost-recovery initiatives with broader strategic priorities. Developing clear guidelines or frameworks for approving, prioritizing and completing cost-recovery projects will support transparency and ensure alignment with strategic priorities. This approach will also help balance external funding requirements with the program's broader mandate.

Operational complexity

Modernization initiatives and the shift to more complex analytical work have positioned the CCJCSS for long-term success, but also introduced significant operational challenges. Without targeted investments in training, workforce development and process support, these changes risk overwhelming staff and undermining program sustainability.

Modernization initiatives

StatCan's push to centralize and streamline operations aims to improve efficiency and timeliness. The CCJCSS is actively participating in this recentralization effort, which is expected to enhance agility and standardize processes across divisions. However, these changes have also introduced uncertainty and stress among staff because of organizational restructuring and resource constraints. The transition requires significant adjustments to established workflows, creating short-term operational challenges even with long-term benefits.

The CCJCSS is transitioning from proprietary software to open-source tools such as R and Python to modernize its analytical capabilities. While this shift is necessary to remain current and leverage advanced data science techniques, it presents learning curves for staff. Limited time for training and resource shortages exacerbate these challenges, leaving staff to adapt while managing existing workloads. This transition underscores the need for structured training programs and dedicated capacity-building initiatives to ensure successful adoption.

Increasing complexity of work

The nature of the CCJCSS's work has grown exponentially in complexity. While the program has historically focused on aggregate data, it now processes microdata and linked datasets, handling billions of data cells, compared with thousands in the past. This evolution enables richer, more granular analysis but requires advanced technical skills and sophisticated methodologies.

To meet these demands, staff need specialized expertise in data linkage, statistical modelling and programming. However, training and succession planning remains limited, creating risks for knowledge transfer and continuity. These pressures contribute to staff burnout and threaten the program's ability to sustain modernization efforts over time.

Workforce capacity and development

Operational complexity and modernization have increased the need for specialized skills, yet funding for training and succession planning remains limited. The Public Service Employee Survey (PSES) results highlight systemic challenges in workforce development. CCJCSS staff reported lower scores when asked if they have the training needed to do their job, compared with StatCan or public service employees overall. This result is similar when respondents were asked if the department or agency does a good job of supporting career development and if they plan to leave their current position within the next two years (Figure 10).

Historically, many core functions have relied on the expertise of long-serving staff, which has reduced the urgency for formal succession planning. However, with anticipated retirements and ongoing fiscal pressures, it is now essential to capture and transfer institutional knowledge to support continued program delivery.

Figure 10 Public Service Employee Survey ratings – Percentage of respondents who agree with the following statements
Figure 10
Description - Figure 10

Figure 10 presents the percentage of respondents who agreed with selected 2024 Public Service Employee Survey statements, shown for CCJCSS, Statistics Canada, and the Public Service overall.

Do you intend to leave your current position in the next two years (yes):

  • CCJCSS: 37%
  • Statistics Canada: 33%
  • Public Service: 36%

My department or agency does a good job of supporting employee career development:

  • CCJCSS: 41%
  • Statistics Canada: 52%
  • Public Service: 55%

I get the training I need to do my job:

  • CCJCSS: 48%
  • Statistics Canada: 69%
  • Public Service: 68%

Workforce well-being

Workforce well-being at the CCJCSS is influenced by factors such as heavy workloads, staffing levels and career development opportunities, which may affect operational stability and progress toward strategic objectives.

Figure 11 Public Service Employee Survey results: Overall, to what extent do the following factors cause you work-related stress?
Figure 11
Description - Figure 11

Figure 11 presents the percentage of respondents who reported that selected factors cause them work-related stress, shown for CCJCSS, Statistics Canada, and the Public Service overall, taken from the Public Service Employee Survey 2024.

Unreasonable deadlines:

  • CCJCSS: 75%
  • Statistics Canada: 64%
  • Public Service: 71%

Competing or constantly changing priorities:

  • CCJCSS: 80%
  • Statistics Canada: 71%
  • Public Service: 76%

Limited control or input into decision making:

  • CCJCSS: 86%
  • Statistics Canada: 66%
  • Public Service: 70%

Not enough employees to do the work:

  • CCJCSS: 86%
  • Statistics Canada: 71%
  • Public Service: 75%

Heavy workload:

  • CCJCSS: 86%
  • Statistics Canada: 74%
  • Public Service: 79%

Recent PSES results indicate that heavy workloads and limited staffing contribute significantly to work-related stress among CCJCSS staff, reflecting broader trends across StatCan and the public service. Notably, CCJCSS staff reported higher levels of stress than their counterparts in StatCan and the public service (Figure 11). Interview feedback supports these findings, highlighting concerns about morale, workload pressures, career advancement opportunities and mental health.

Additionally, PSES scores point to low confidence in senior management and communication, compared with other areas of StatCan, contributing to some uncertainty and reduced engagement. While immediate supervisors are generally viewed as supportive, ongoing challenges such as budget constraints and limited advancement opportunities remain. Despite a recalibration of future deliverables in response to the upcoming austerity period, these combined factors may impact employee well-being and organizational resilience. This underscores the importance of continued strategic efforts to support staff and maintain capacity in a resource-constrained environment. As part of agency-wide efforts in response to the results of the PSES, the CCJCSS developed an action plan outlining measures to promote a more balanced and supportive workplace environment.

Technology and innovation

Technology and innovation are essential for the CCJCSS to address increasing demands and remain strategically relevant. Expanding the use of AI for data extraction, validation and automation, as well as leveraging performance metrics and enhancing usability through interactive dashboards and advanced search tools, will enable the CCJCSS to deliver more timely, accurate and accessible products.

Enhancing data access and validation

AI offers transformative potential for improving data quality and accessibility. For example, AI tools can efficiently review court transcripts to generate more comprehensive Courts Program data, addressing gaps in traditional data collection methods. Similarly, AI can validate survey results by scanning online sources, such as verifying homicide counts from the Homicide Survey, thereby strengthening accuracy and reliability. Interactive dashboards complement these efforts by providing richer data visualizations and intuitive navigation, enabling less data-savvy users to explore complex datasets with ease.

Streamlining processes

Automation of routine tasks through AI can significantly reduce turnaround times and free analysts to focus on more complex and value-added work. For instance, AI-generated draft reports (such as The Daily) accelerate the publication process, improving timeliness and responsiveness to emerging issues. Continued exploration of AI-driven process improvements will help the CCJCSS move from completion to dissemination more efficiently, addressing one of the most persistent challenges identified by users.

Improving usability

Building on existing AI initiatives, such as the CrimPath-1 simulation model, can enhance decision-making by modelling justice system trajectories and projecting the impacts of policy interventions. CrimPath-1, developed in collaboration with Justice Canada, aims to model the trajectories of individuals involved in the criminal justice system (CJS), to project the impacts of hypothetical justice interventions on CJS outcomes and associated costs, and to identify strategies that reduce recontact with the justice system and address overrepresentation of Indigenous and racialized populations.

Additionally, addressing website usability remains a priority. It was suggested that the CCJCSS explore ways to integrate AI-powered features, such as accessible map reading in the Flood Risk Portal Project and a Google-like search function, to significantly improve user experience. Challenges with the website are a StatCan-wide issue, and the CCJCSS cannot undergo website enhancements in isolation. Instead, findings from this evaluation can be shared at the agency level to support work that aims to improve the usability of the website. These enhancements align with StatCan's commitment to user-centric service delivery and ensure that CCJCSS products remain accessible and relevant.

Leveraging performance metrics

Web metrics and engagement data offer valuable insights for prioritization. For example, should certain products see diminishing engagement, the program can prioritize alternative products that have high visibility and are increasing in popularity.

Strengthening the use of performance metrics and developing systematic processes for analyzing product reach and user engagement will enable the CCJCSS to focus on outputs that deliver the greatest value. Considering performance metrics in strategic planning will ensure that investments align with user demand and program objectives.

How to improve the program

To remain relevant and maximize value, the CCJCSS must adopt a strategic approach that emphasizes prioritization and workforce resilience. This includes clarifying its mandate to guide priorities, strengthening its cost-recovery governance and focusing resources on developing products that provide the most value to their intended audience. Additionally, strengthening workforce resilience through knowledge transfer and succession planning will further support sustainability.

Recommendation 1

The assistant chief statistician (ACS) of the Social, Health and Labour Statistics Field (Field 8) should ensure that the CCJCSS adopts a structured, metrics-driven approach to prioritization. This will better align outputs with the CCJCSS's mandate and foster continuous improvement. Key actions should include the following:

  • Clarifying the CCJCSS mandate: Clearly define the CCJCSS's core purpose, scope and intended audience. Establish a framework to identify which outputs and activities most directly support its strategic objectives.
  • Strengthening cost-recovery governance: Enhance coordination within the CCJCSS to ensure that initiatives are aligned with broader strategic priorities.
  • Distinguishing essential versus discretionary activities: Identify which outputs and initiatives are essential to fulfilling the CCJCSS mandate and which are discretionary.
  • Leveraging performance metrics: Systematically assess outputs using metrics such as web analytics, social media engagement, data request trends and consultation feedback to create a shortlist of high-impact products. The user rankings of themes and subthemes from the evaluation can also be leveraged in this exercise.
  • Prioritizing strategic value: Focus resources on users and outputs that deliver the greatest strategic impact.
  • Monitoring and adjusting: Regularly evaluate the effects of prioritization on timeliness, user satisfaction and employee morale, and adjust the approach as needed.

Recommendation 2

The ACS of Field 8 should ensure that the CCJCSS develops a succession and knowledge transfer plan that includes the following:

  • Identifying critical tasks and responsibilities: Pinpoint essential operational activities.
  • Mapping institutional knowledge holders and retirement timelines: Assess areas of risk to prioritize knowledge transfer.
  • Developing clear documentation protocols: Create step-by-step guides and templates, and ensure storage in accessible repositories.
  • Mentoring and shadowing: Provide opportunities for newer staff to learn from experienced colleagues before departures.
  • Aligning training and capacity building: Build workforce skills and capacity to keep pace with growing demands and evolving tasks.
  • Monitoring and updating: Review the plan regularly to keep it current and effective.

Management response and action plan

Recommendation 1

The ACS of Field 8 should ensure that the CCJCSS adopts a structured, metrics-driven approach to prioritization. This will better align outputs with the CCJCSS's mandate and foster continuous improvement. Key actions should include the following:

  • Clarifying the CCJCSS mandate: Clearly define the CCJCSS's core purpose, scope and intended audience. Establish a framework to identify which outputs and activities most directly support its strategic objectives.
  • Strengthening cost-recovery governance: Enhance coordination within the CCJCSS to ensure that initiatives are aligned with broader strategic priorities.
  • Distinguishing essential versus discretionary activities: Identify which outputs and initiatives are essential to fulfilling the CCJCSS mandate and which are discretionary.
  • Leveraging performance metrics: Systematically assess outputs using metrics such as web analytics, social media engagement, data request trends and consultation feedback to create a shortlist of high-impact products. The user rankings of themes and sub-themes from the evaluation can also be leveraged in this exercise.
  • Prioritizing strategic value: Focus resources on users and outputs that deliver the greatest strategic impact.
  • Monitoring and adjusting: Regularly evaluate the effects of prioritization on timeliness, user satisfaction and employee morale, and adjust the approach as needed.

Management response

Management agrees with the recommendation.

Clarifying the CCJCSS mandate

  • The CCJCSS will develop a strategic plan that clearly defines its purpose, scope and audience, and differentiates its role from the Liaison Officer Committee of the National Justice Statistics Initiative (LOCNJSI).
  • The plan will include a logic model that outlines the CCJCSS's outputs, activities and strategic objectives.
  • It will also inform the CCJCSS Triennial Program Review scheduled for January to May 2027.

Strengthening cost-recovery governance

  • The CCJCSS will develop a prioritization tool that documents how incoming cost-recovery projects are assessed and to ensure that they align with the CCJCSS's strategic objectives.

Distinguishing essential versus discretionary activities

  • The strategic plan, supported by a logic model, will clearly distinguish essential outputs and initiatives from discretionary ones for the upcoming year.

Leveraging performance metrics

  • Using available performance metrics, the CCJCSS will assess, categorize and prioritize existing outputs based on project requirements and strategic objectives. The results will be documented in the strategic plan.
  • A performance metrics tracking document will be developed, informed by both the strategic plan and the rankings collected through the evaluation.

Prioritizing strategic value

  • The CCJCSS will create an operational plan, aligned with the strategic plan, to ensure that resources are directed to priorities that deliver the greatest strategic impact.

Monitoring and adjusting

  • A dedicated annual management meeting will be convened to review and update the strategic and operational plans, with minutes and updates formally documented.
  • On a quarterly basis, the CCJCSS will monitor and update the performance metrics tracking document during the regular operational meetings with chiefs and assistant directors.

Deliverables and timelines

1a. A strategic plan building on and complementing the LOCNJSI Strategic Plan. It will inform the CCJCSS Triennial Program Review in January 2027. The plan will include

  • a definition of the CCJCSS's purpose, scope and audience
  • a logic model identifying outputs, activities and strategic objectives
  • a clear definition of essential versus discretionary outputs and initiatives
  • a performance metric framework.

This deliverable is due in April 2026, following approval by the director general of the Social, Justice and Indigenous Statistics Branch (SJISB). It will be adjusted in October 2026 to reflect updates from the LOCNJSI Strategic Plan and subsequently updated annually to align with the agency's planning cycle.

1b. A prioritization tool outlining existing and incoming letters of agreement and how each aligns with the strategic objectives of LOCNJSI and the mandate of the CCJCSS.

This deliverable is due in April 2026, following approval by the director general of SJISB.

1c. A performance metrics tracking document, which includes web analytics, data requests and media requests.

This deliverable is due in September 2026, following approval by the director general of SJISB, and will be updated quarterly thereafter.

1d. An operational plan, derived from the strategic plan, outlining all projects, identifying the responsible sections and employees, and specifying the associated budget sources and funding allocations.

This deliverable is due in April 2026, following approval by the director of CCJCSS, and will be updated annually to align with the strategic plan.

Recommendation 2

The ACS of Field 8 should ensure the CCJCSS develops a succession and knowledge transfer plan that includes the following:

  • Identifying critical tasks and responsibilities: Pinpoint essential operational activities.
  • Mapping institutional knowledge holders and retirement timelines: Assess areas of risk to prioritize knowledge transfer.
  • Developing clear documentation protocols: Create step-by-step guides and templates, and ensure storage in accessible repositories.
  • Mentoring and shadowing: Provide opportunities for newer staff to learn from experienced colleagues before departures.
  • Aligning training and capacity building: Build workforce skills and capacity now to keep pace with growing demands and evolving tasks.
  • Monitoring and updating: Review the plan regularly to keep it current and effective.

Management response

Management agrees with the recommendation.

Identifying critical tasks and responsibilities

  • The operational plan in 1d will pinpoint essential operational activities.

Mapping institutional knowledge holders and retirement timelines

  • A human resources plan will be developed to map upcoming retirements and anticipated staffing changes, and to document corresponding succession planning strategies. The plan will also include an employee engagement strategy with regular touchpoints, including weekly section and management meetings and monthly all-staff meetings.

Developing clear documentation protocols

  • A list of departing employees will be maintained to ensure that key processes are documented within the approved GCdocs structure before staff transitions occur.
  • The CCJCSS will continue strengthening information management practices by maintaining an evergreen inventory of critical corporate knowledge and ensuring that all related documentation is stored and easily accessible through GCdocs.

Mentoring and shadowing

  • The CCJCSS will develop a document outlining cascading work objectives for all levels within the CCJCSS, along with key learning plan requirements such as mentorship and shadowing opportunities. These commitments, aligned with the human resources plan and employee engagement strategy, will be integrated into employees' work objectives and learning plans in the Public Service Performance Management (PSPM) app, while allowing customization as needed.

Aligning training and capacity building

  • The same cascading work objectives document will also guide training and skill development to ensure that the workforce has the competencies needed to support strategic priorities and the operational plan as tasks evolve.

Monitoring and updating

  • Quarterly management meetings will be used to monitor the operational and human resources plans, with adjustments made as necessary.
  • Cascading work objectives and learning plan requirements will be refreshed at the beginning of the performance management cycle.

Deliverables and timelines

2a. A list of departing employees and an evergreen list of critical corporate knowledge, including their file locations, will be incorporated into the operation plan in 1d.

This deliverable is due in April 2026, following approval by the director of the CCJCSS, and will be updated annually to align with the strategic plan.

2b. A human resources plan that includes a succession plan and an employee engagement strategy.

This deliverable is due in April 2026, following approval by the director of the CCJCSS, and will be updated annually to align with the agency's planning cycle.

2c. A cascading work objectives and learning plan requirements document for all employees, designed for use in the PSPM app and aligned with the human resources plan.

This deliverable is due at the beginning of the 2026-27 performance management cycle (April 2026), following approval by the director of the CCJCSS, and will be updated annually thereafter.

Appendix A – Canadian Centre for Justice and Community Safety Statistics themes, sub-themes and products

Canadian Centre for Justice and Community Safety Statistics themes, sub-themes and products
Sub-themeRelated data products
1. Crime (policing, violence, and victimization)
Crime counts and characteristics (general)
Firearm-related crime
Rural crime
Hate crime
Cybercrime
Human trafficking
Online child exploitation
Family violence
Intimate partner violence
Gender-based violence
Victimization
Residential facilities for victims of abuse
Police resources and expenditures
2. Court system
Adult and youth criminal courts
Civil and family courts
Court outcomes
3. Correctional services in Canada
  • Adult and youth corrections
  • Expenditures
  • Reoffending patterns
4. Justice system equity and overrepresentation
  • Police-reported Indigenous and racialized identity data
  • Overrepresentation in the justice system
  • Socioeconomic profiles of victims and offenders
5. Pathways through the justice system
  • Pan-Canadian Recontact Project (follows individuals through various stages of the justice system)
  • Court outcomes (linkage study)
  • Reoffending patterns
No recently released products because these are long-term projects still in progress.
6. Emergency management and natural disasters
  • Flood risk information
  • National fire information
  • Ground search and rescue
No recently released products
7. Community safety
  • SafeTO: Toronto's Ten-Year Community Safety and Well-Being Plan
  • Missing persons data standards
  • Calls for service
No recently released products because these are long-term projects still in progress.

Appendix B – Evaluation questions and indicators

Evaluation questions and indicators
Evaluation questionsEvaluation indicators
1. To what extent is the overall suite of data products produced by the CCJCSS relevant and useful to users?

1.1 Identification of data products released and their rationale.

1.2 Identification of how internal and external users are using the suite of data products.

1.3 The extent to which the overall suite of data addresses the needs of key users in the following areas:

  • Relevance and utility
  • Accessibility
  • Clarity of methodology
  • Perceived quality
  • Timeliness
2. Where should the program focus to produce the most value to users?

2.1 Identification of themes or components that provide the most value as perceived by users.

2.2 Identification of factors to consider for the program to provide the most value to users.

Appendix C – Interview quantification scale

Interview responses are quantified and categorized in this report using the scale shown in the table below.

Evaluation questions and indicators
TermDefinition
One"One" is used when one participant provided the answer.
Few"Few" is used when 4% to 15% of participants responded with similar answers. The sentiment of the response was articulated by these participants but not by other participants.
Some"Some" is used when 16% to 45% of participants responded with similar answers.
About half"About half" is used when 46% to 55% of participants responded with similar answers.
Most or a majority"Most or a majority" is used when 56% to 89% of participants responded with similar answers.
Almost all"Almost all" is used when 90% to 99% of participants responded with similar answers.
All"All" is used when 100% of participants responded with similar answers.

Canadian Survey on Business Conditions, third quarter of 2026

Business or organization information

1. Which of the following categories best describes this business or organization?

  • Government agency
  • Private sector business
  • Non-profit organization
    • Who does this organization primarily serve?
      • Households or individuals
        e.g., child and youth services, community food services, food bank, women’s shelter, community housing services, emergency relief services, religious organization, grant and giving services, social advocacy group, arts and recreation group
      • Businesses
        e.g., business association, chamber of commerce, condominium association, environmental support or protection services, group benefit carriers (pensions, health, medical)
  • Don’t know

2. In what year was this business or organization first established?

Please provide the year this business or organization first began operations.

Year business or organization was first established:
OR
Don’t know

  • Approximately how long ago was this business or organization first established?
    • 2 years ago or less
      Established in 2026, 2025, or 2024.
    • 3 to 10 years ago
      Established in 2016 to 2023.
    • 11 to 20 years ago
      Established in 2006 to 2015.
    • More than 20 years ago
      Established in 2005 or earlier.
    • Don’t know

3. Over the last 12 months, which of the following international activities did this business or organization conduct?

Select all that apply.

  • Export or sell goods outside of Canada
    Include both intermediate and final goods.
  • Export or sell services outside of Canada
    Include services delivered virtually and in person.
    e.g., software, cloud services, legal services, environmental services, architectural services, digital advertising
  • Make investments outside of Canada
  • Sell goods to businesses or organizations in Canada who then resold them outside of Canada
  • Import or buy goods from outside of Canada
    Include both intermediate and final goods.
  • Import or buy services from outside of Canada
    Include services received virtually and in person.
    e.g., software, cloud services, legal services, environmental services, architectural services, digital advertising
  • Relocate any business or organizational activities or employees from another country into Canada
    Exclude temporary foreign workers.
  • Relocate any business or organizational activities or employees from Canada to another country
  • Engage in other international business or organizational activities
    OR
  • None of the above

4. Over the next three months, how are each of the following expected to change for this business or organization?

Exclude seasonal factors or conditions.

  • Number of employees
    • Increase
    • Stay about the same
    • Decrease
    • Not applicable
    • Don’t know
  • Vacant positions
    • Increase
    • Stay about the same
    • Decrease
    • Not applicable
    • Don’t know
  • Sales of goods or services offered by this business or organization
    • Increase
    • Stay about the same
    • Decrease
    • Not applicable
    • Don’t know
  • Selling price of goods or services offered by this business or organization
    • Increase
    • Stay about the same
    • Decrease
    • Not applicable
    • Don’t know
  • Demand for goods or services offered by this business or organization
    • Increase
    • Stay about the same
    • Decrease
    • Not applicable
    • Don’t know
  • Imports of goods or services
    • Increase
    • Stay about the same
    • Decrease
    • Not applicable
    • Don’t know
  • Exports of goods or services
    • Increase
    • Stay about the same
    • Decrease
    • Not applicable
    • Don’t know
  • Operating income
    • Increase
    • Stay about the same
    • Decrease
    • Not applicable
    • Don’t know
  • Operating expenses
    • Increase
    • Stay about the same
    • Decrease
    • Not applicable
    • Don’t know
  • Profitability
    • Increase
    • Stay about the same
    • Decrease
    • Not applicable
    • Don’t know
  • Cash reserves
    • Increase
    • Stay about the same
    • Decrease
    • Not applicable
    • Don’t know
  • Capital expenditures
    e.g., machinery, equipment
    • Increase
    • Stay about the same
    • Decrease
    • Not applicable
    • Don’t know
  • Training expenditures
    • Increase
    • Stay about the same
    • Decrease
    • Not applicable
    • Don’t know
  • Marketing and advertising budget
    • Increase
    • Stay about the same
    • Decrease
    • Not applicable
    • Don’t know
  • Expenditures in research and development
    • Increase
    • Stay about the same
    • Decrease
    • Not applicable
    • Don’t know
  • Online sales 
    • Increase
    • Stay about the same
    • Decrease
    • Not applicable
    • Don’t know

Business or organization obstacles

5. Over the next three months, which of the following are expected to be obstacles for this business or organization?

Select all that apply.

  • Shortage of labour force
  • Recruiting skilled employees
  • Retaining skilled employees
  • Shortage of space or equipment
  • Cost of inputs
    An input is an economic resource used in a firm’s production process.
    e.g., labour, capital, energy and raw materials
  • Costs in real estate, leasing or property taxes
  • Inflation
  • Interest rates and debt costs
    e.g., borrowing fees, interest payments
  • Difficulty acquiring inputs, products or supplies from within Canada
  • Difficulty acquiring inputs, products or supplies from abroad
  • Maintaining inventory levels
  • Insufficient demand for goods or services offered
  • Fluctuations in consumer demand
  • Attracting new or returning customers
  • Lack of financial resources
  • Technological limitations
  • Regulatory constraints
  • Cost of insurance
  • Transportation costs
  • Obtaining financing
  • Increasing competition 
  • Challenges related to exporting or selling goods and services to customers in other provinces or territories
  • Challenges related to exporting or selling goods and services outside of Canada
  • Maintaining sufficient cash flow or managing debt
  • Attracting local investment
  • Attracting foreign direct investment
  • Other obstacle

    • Specify other obstacle:

    OR

  • None of the above

Flow condition: If at least two obstacles are selected in Q5, go to Q6. Otherwise, go to Q7.
Display condition: Display in Q6 the obstacles selected in Q5.

6. Of the obstacles selected in the previous question, which obstacle is expected to be the most challenging over the next three months?

  • Shortage of labour force
  • Recruiting skilled employees
  • Retaining skilled employees
  • Shortage of space or equipment
  • Cost of inputs 
    An input is an economic resource used in a firm’s production process.
    e.g., labour, capital, energy and raw materials
  • Costs in real estate, leasing or property taxes
  • Inflation
  • Interest rates and debt costs
    e.g., borrowing fees, interest payments
  • Difficulty acquiring inputs, products or supplies from within Canada
  • Difficulty acquiring inputs, products or supplies from abroad
  • Maintaining inventory levels
  • Insufficient demand for goods or services offered
  • Fluctuations in consumer demand
  • Attracting new or returning customers
  • Lack of financial resources
  • Technological limitations
  • Regulatory constraints
  • Cost of insurance
  • Transportation costs
  • Obtaining financing
  • Increasing competition 
  • Challenges related to exporting or selling goods and services to customers in other provinces or territories
  • Challenges related to exporting or selling goods and services outside of Canada
  • Maintaining sufficient cash flow or managing debt
  • Attracting local investment
  • Attracting foreign direct investment
  • Other obstacle

Flow condition: If “Cost of inputs” is selected in Q5, go to Q7. Otherwise, go to Q8.

7. Over the next three months, which of the following costs of inputs are expected to be obstacles for this business or organization?

Select all that apply.

  • Cost of labour
  • Cost of capital
    e.g., land, real estate, machinery, or tools
  • Cost of energy
  • Cost of raw materials
    OR
  • Don’t know

Flow condition: If “Difficulty acquiring inputs, products or supplies from within Canada”, “Difficulty acquiring inputs, products or supplies from abroad”, or “Maintaining inventory levels” is selected in Q5, go to Q8. Otherwise, go to Q11.

Display condition: If “Difficulty acquiring inputs, products or supplies from within Canada”, “Difficulty acquiring inputs, products or supplies from abroad”, or “Maintaining inventory levels” is selected in Q5, display in Q8.

Supply chain challenges

8. How long does this business or organization expect the following to continue to be an obstacle?

  • Difficulty acquiring inputs, products or supplies from within Canada
    • Less than 3 months
    • 3 months to less than 6 months
    • 6 months to less than 12 months
    • 12 months or more
    • Don’t know
  • Difficulty acquiring inputs, products or supplies from abroad
    • Less than 3 months
    • 3 months to less than 6 months
    • 6 months to less than 12 months
    • 12 months or more
    • Don’t know
  • Maintaining inventory levels
    • Less than 3 months
    • 3 months to less than 6 months
    • 6 months to less than 12 months
    • 12 months or more
    • Don’t know

9. Over the last three months, how have supply chain challenges experienced by this business or organization changed?

Supply chain challenges include difficulty acquiring inputs, products or supplies from within Canada or abroad and difficulty maintaining inventory levels.

Exclude seasonal factors or conditions.

  • Supply chain challenges have worsened
    • Which of the following factors have contributed to these challenges?
      Select all that apply.
      • Increased prices of inputs, products or supplies
      • Increased delays in deliveries of inputs, products or supplies
      • Supply shortages resulted in fewer inputs, products or supplies being available
      • Supply shortages resulted in no inputs, products or supplies available
      • Other factor

        • Specify other factor:

        OR

      • Don’t know
  • Supply chain challenges have remained about the same
  • Supply chain challenges have improved

10. Over the next three months, how does this business or organization expect supply chain challenges to change?

Supply chain challenges include difficulty acquiring inputs, products or supplies from within Canada or abroad and difficulty maintaining inventory levels.
Exclude seasonal factors or conditions.

  • Supply chain challenges are expected to worsen
  • Supply chain challenges are expected to remain about the same
  • Supply chain challenges are expected to improve

Flow condition: If “Government agency” was selected in Q1, go to Q12. Otherwise, go to Q11.
Display condition: If “Non-profit organization” is selected in Q1, do not display “Transfer the business” or “Sell the business” in Q11.

Expectations for the next year

11. Over the next 12 months, does this business or organization plan to do any of the following?

Select all that apply.

  • Expand current location of this business or organization
  • Expand operations of this business or organization internationally
  • Expand operations of this business or organization into a new province or territory within Canada
  • Move operations of this business or organization to another location within the province or territory
  • Move operations of this business or organization to another province or territory within Canada entirely
  • Expand this business or organization to other locations within the same province or territory
  • Expand this business or organization without increasing physical space
    i.e., hiring more staff who will work remotely, or expanding online sales capacity
  • Restructure this business or organization
    Restructuring involves changing the financial, operational, legal or other structures of the business or organization to make it more efficient or more profitable.
  • Acquire other businesses, organizations or franchises
  • Invest in other businesses or organizations
  • Merge with other businesses or organizations
  • Reduce the physical space of this business or organization
  • Scale down operations of this business or organization to within a single province or territory within Canada
  • Transfer the business
  • Sell the business
    OR
  • Close the business or organization
    OR
  • Don’t know
    OR
  • None of the above

Flow condition: If “Export or sell goods outside of Canada” or “Export or sell services outside of Canada” was selected in Q3, go to Q12. Otherwise, go to Q13.

Trade

12. Over the last 12 months, approximately what percentage of this business’s or organization’s sales were made directly to clients or customers in the United States?

Provide your best estimate rounded to the nearest percentage.

Percentage of sales made directly to clients or customers in the United States:
OR
Don’t know

Flow condition: If “Import or buy goods from outside of Canada” or “Import or buy services from outside of Canada” was selected in Q3, go to Q13. Otherwise, go to Q14.

13. Over the last 12 months, approximately what percentage of this business’s or organization’s purchases were made directly from suppliers in the United States?

Provide your best estimate rounded to the nearest percentage.

Percentage of purchases made directly from suppliers in the United States:
OR
Don’t know

14. Over the next 12 months, what is the expected impact for each of the following on this business or organization?

If tariffs are not relevant to this business or organization, please select “No impact”.

  • U.S. tariffs on goods sold by businesses in Canada
    • Major negative impact
    • Minor negative impact
    • No impact
    • Minor positive impact
    • Major positive impact
    • Don’t know
  • Canadian tariffs on goods purchased from businesses in the U.S.
    • Major negative impact
    • Minor negative impact
    • No impact
    • Minor positive impact
    • Major positive impact
    • Don’t know
  • The elimination of trade barriers between provinces or territories
    • Major negative impact
    • Minor negative impact
    • No impact
    • Minor positive impact
    • Major positive impact
    • Don’t know

15. Over the next 12 months, does this business or organization plan to take any of the following actions as a result of any tariffs applied by the United States on goods sold from Canada?

Select all that apply.

  • Seek alternative customers outside the United States 
  • Seek alternative suppliers outside the United States 
  • Increase domestic sourcing
  • Increase efforts to sell to customers in Canada
  • Delay major investments or expenditures
  • Delay Canadian investment or expansion plans
  • Acquire or partner with United States-based businesses as a beachhead strategy
  • Explore trade-related financial tools
    e.g., currency hedging, insurance
  • Establish operations in the United States
  • Increase inventory or stockpile goods
  • Invest in technology improvements 
    e.g., technology adoption, automation
  • Lay off employees
  • Hire employees
  • Raise prices of goods or services
  • Lower prices of goods or services
  • Other action

    • Specify other action:

    OR

  • None of the above
    OR
  • Don’t know

Flow condition: If the percentage of sales made directly to clients or customers in the United States reported in Q12 was greater than 0, go to Q16. Otherwise, go to Q17.

16. Over the last 12 months, has this business or organization sold any goods to the United States that were subject to any tariffs?

  • Yes
  • No
  • Don’t know

Flow condition: If the percentage of purchases made directly from suppliers in the United States reported in Q13 was greater than 0, go to Q17. Otherwise, go to Q18.

17. Over the last 12 months, has this business or organization purchased any goods from the United States that were subject to any tariffs?

  • Yes
  • No
  • Don’t know

18. Over the last 12 months, has this business or organization passed on any increases in its costs due to tariffs to its customers?

Include both indirect cost increases and direct cost increases due to tariffs.

  • Yes
  • No
  • This business or organization has not experienced any cost increases due to tariffs
  • Don’t know

19. Over the next 12 months, how likely is this business or organization to pass on cost increases due to tariffs to its customers?

Include both indirect cost increases and direct cost increases due to tariffs.

  • Very likely
  • Somewhat likely
  • Somewhat unlikely
  • Very unlikely
  • This business or organization does not expect any cost increases due to tariffs
  • Don't know

Canadian goods and services

20. Over the last 12 months, has this business or organization changed its marketing practices to promote Canadian goods and services?

e.g., labeling products that are either “Canadian”, “Made in Canada” or are a “Product of Canada”

  • Yes
  • No
  • Don’t know

21. Over the last 12 months, has this business or organization experienced an increase in sales of Canadian goods and services?

e.g., products that are either “Canadian”, “Made in Canada” or are a “Product of Canada”

  • Yes
  • No
  • This business or organization did not sell any Canadian goods or services
  • Don’t know

Flow condition: If “Private sector business” was selected in Q1, go to Q22. Otherwise, go to Q29.

Business sale or transfer

22. Does the current owner or operator of this business intend to sell or transfer ownership of this business within the next 10 years?

  • Yes
    • When does the owner or operator of this business intend to sell or transfer ownership of this business?
      • Within the next 2 years
      • Within 3 to 5 years
      • Within 6 to 10 years
      • Don’t know
  • No
  • Don’t know

Flow condition: If “Yes” and then “Within the next 2 years” were selected in Q22, go to Q23. Otherwise, go to Q26.

23. Which of the following statements describe expectations related to the selling or transferring of this business?

Select all that apply.

  • There are likely to be qualified buyers for this business
  • A fair market price would be received for this business
  • There is sufficient time and resources to pursue a sale or transfer of this business
  • Professional or advisory support, such as a broker or accountant, would be consulted
  • Government programs or supports for facilitating a sale or transfer would be used
    e.g., Succession Ontario, Repreneuriat Quebec
    OR
  • None of the above
    OR
  • Don’t know

24. When considering the sale or transfer of this business, what is the level of importance for each of the following?

  • Finding a buyer in Canada
    • Very important
    • Somewhat important
    • Not important
    • Don’t know
  • Protecting employees
    • Very important
    • Somewhat important
    • Not important
    • Don’t know
  • Maintaining presence in the local community
    • Very important
    • Somewhat important
    • Not important
    • Don’t know
  • Obtaining the highest price
    • Very important
    • Somewhat important
    • Not important
    • Don’t know
  • Preserving the business’s culture or values
    • Very important
    • Somewhat important
    • Not important
    • Don’t know

25. If this business is unable to find a suitable buyer or successor, how likely are each of the following scenarios?

  • Continue operating under current ownership
    • Very likely
    • Somewhat likely
    • Somewhat unlikely
    • Very unlikely
    • Don’t know
  • Sell at a reduced value or under less favorable terms, including to a less preferred buyer
    • Very likely
    • Somewhat likely
    • Somewhat unlikely
    • Very unlikely
    • Don’t know
  • Scale down or close operations
    • Very likely
    • Somewhat likely
    • Somewhat unlikely
    • Very unlikely
    • Don’t know

Flow condition: If “Yes” was selected in Q22, go to Q26. Otherwise, go to Q28.

26. What is the primary source of this business’s value?

  • Ongoing operations
  • Real estate or physical assets

27. Has this business been profitable in each of the past three years?

  • Yes
  • No
  • Don’t know

Buyer demand

28. Over the last five years, has this business received any expressions of interest or offers to purchase, solicited or unsolicited?

  • Yes
    • From whom has this business received any expressions of interest or offers to purchase, solicited or unsolicited?
      Select all that apply.
      • Employees or management
      • An individual or family in Canada
      • A business in Canada
      • A private equity firm or investment fund in Canada
      • A foreign buyer
      • Other buyer

        • Specify other buyer:

        OR

      • Don’t know
  • No
  • Don’t know

Information theft

29. Over the last 12 months, has this business or organization experienced theft of sensitive business data such as intellectual property, business intelligence, or customer or employee data?

Theft of sensitive business data could include unauthorized access to systems or data; theft or attempted theft of intellectual property, trade secrets, or sensitive information; suspicious requests or engagements; or insider-related activity.

  • Yes
  • No
  • Don’t know

Flow condition: If “Yes” was selected in Q29, go to Q30. Otherwise, go to Q33.

30. Over the last 12 months, which of the following events has this business or organization experienced?

Select all that apply.

  • Unauthorized access to systems or data
    e.g., cyber intrusion, phishing
  • Theft or attempted theft of intellectual property, trade secrets, or sensitive information
  • Suspicious requests or engagements
    e.g., partnerships, clients, research collaboration
  • Insider-related event
    e.g., employee or contractor misuse of access
  • Other event

    • Specify other event:

    OR

  • Don’t know

31. What impacts did these events have on this business or organization?

Select all that apply.

  • Financial losses
    e.g., lost revenue, contracts, or market share
  • Increased cybersecurity or security-related costs
  • Loss of intellectual property or competitive advantage
  • Reputational damage or loss of customer trust
  • Operational disruption
    e.g., downtime, supply chain impacts
  • Reduced willingness to engage in international partnerships or investment
  • Other impact

    • Specify other impact:

    OR

  • No impact
    OR
  • Don’t know

32. As a result of these events, did this business or organization take any of the following actions?

Select all that apply.

  • Increased investment in cybersecurity or data protection
  • Restricted or reconsidered partnerships, investments, or clients
  • Enhanced employee screening, training, or monitoring
  • Limited sharing of sensitive information
  • Changed R&D, innovation, or commercialization strategies
  • Other action

    • Specify other action:

    OR

  • No actions were taken
    OR
  • Don’t know

33. How many measures has this business or organization implemented to protect its sensitive business data?

e.g., intellectual property, business intelligence, or customer or employee data

  • Several measures
  • Some measures
  • No measures

Artificial intelligence

34. Over the next 12 months, does this business or organization plan to use artificial intelligence (AI) in producing goods or delivering services?

e.g., machine learning, virtual agents, voice recognition

  • Yes
    • What type of AI applications is this business or organization planning to use in producing goods or delivering services?
      Select all that apply.
      • Machine learning
      • Natural language processing
      • Virtual agents or chat bots
      • Speech or voice recognition using AI
      • Recommendation systems based on AI
      • Large language models
        e.g., ChatGPT or Microsoft Copilot
      • Text analytics using AI
      • Data analytics using AI
      • Neural networks
      • Augmented reality
      • Decision making systems based on AI
      • Deep learning
      • Image or pattern recognition
      • Machine or computer vision
      • Robotics process automation
      • Biometrics
      • Marketing automation using AI
      • Other type

        • Specify other type:

        OR

      • Don’t know
  • No
    • Why does this business or organization not plan to use AI in producing goods or delivering services over the next 12 months?
      Select all that apply.
      • Too expensive
      • AI is not a mature enough technology yet
      • Lack of knowledge on the capabilities of AI
      • Concerns about privacy or security
      • Concerns about bias
      • Lack of skilled workforce
      • Lack of required data
      • Laws and regulations prevent or restrict use of AI
      • Previous or current use of AI did not meet expectations
      • Other reason

        • Specify other reason:

        OR

      • AI is not relevant to the goods produced or services delivered by this business or organization
        OR
      • Don’t know
  • Don’t know

Flow condition: If “Yes” was selected in Q34, go to Q35. Otherwise, go to Q37.

35. How does this business or organization expect AI to affect total employment?

  • Increase
  • Decrease
  • No change
  • Don’t know

36. Which of the following changes will this business or organization make when using AI to produce goods or deliver services?

Select all that apply.

  • Train current staff to use AI
  • Hire staff trained in AI
  • Purchase computing power or specialized equipment
  • Purchase cloud services or cloud storage
  • Change data collection or data management practices
  • Develop new workflows
  • Use vendors or consulting services to install or integrate AI
  • Other change

    • Specify other change:        

    OR

  • Don’t know
    OR
  • None of the above

Liquidity

37. Does this business or organization have the cash or liquid assets required to operate for the next three months?

  • Yes
  • No
    • Will this business or organization be able to acquire the cash or liquid assets required?
      • Yes
      • No
      • Don’t know
  • Don’t know

Debt

38. Over the next three months, does this business or organization plan to apply to a financial institution for a new line of credit, a new term loan, a new non-residential mortgage or refinancing of an existing non-residential mortgage?

Include commercial mortgages.
Exclude residential mortgages.

  • Yes
    • What are the intended uses of this funding?
      Select all that apply.
      • Refinancing of existing debt
      • Non-residential investments
        e.g., machinery, equipment, R&D
      • Current expenditure
      • Business expansion
      • Financing the acquisition of another business
      • Other use

        • Specify other use:

        OR

      • Don’t know
  • No
    • Does this business or organization have the ability to take on more debt? 
      Answer based on this business’s or organization’s ability, even if there are no plans to take on more debt.
      • Yes
      • No
        • For which of the following reasons is this business or organization unable to take on more debt?
          Select all that apply.
          • Cash flow
          • Lack of confidence or uncertainty in future sales
          • Request would be turned down
          • Too difficult or time consuming to apply
          • Interest rates are unfavourable
          • Payment terms are unfavourable
          • Credit rating
          • Other reason

            • Specify other reason:

            OR

          • Not applicable
            OR
          • Don’t know
      • Don’t know
  • Don’t know

Future outlook

39. Over the next 12 months, what is the future outlook for this business or organization?

  • Very optimistic
  • Somewhat optimistic
  • Somewhat pessimistic
  • Very pessimistic
  • Don’t know

Flow condition: If “Private sector business” was selected in Q1, go to Q40. Otherwise, go to “Contact Person”.

Ownership

(i) The following questions are included for statistical purposes in order to gain a better understanding of businesses owned by members of various communities across Canada.

40. What percentage of this business or organization is owned by each of the following groups?

Provide your best estimate rounded to the nearest percentage.
If the business or organization is not owned by anyone that falls under that group, please enter “0”.

What percentage of this business or organization is owned by women?

Percentage owned by women:
OR
Prefer not to say
OR
Don’t know

What percentage of this business or organization is owned by First Nations, Métis or Inuit peoples?

Percentage owned by First Nations, Métis or Inuit peoples:
OR
Prefer not to say
OR
Don’t know

What percentage of this business or organization is owned by immigrants to Canada?

Percentage owned by immigrants to Canada:
OR
Prefer not to say
OR
Don’t know

What percentage of this business or organization is owned by persons with a disability?

Include visible and non-visible disabilities.
Percentage owned by persons with a disability:
OR
Prefer not to say
OR
Don’t know

What percentage of this business or organization is owned by Two-Spirited, lesbian, gay, bisexual, transgender, or queer (2SLGBTQ+) people?

Percentage owned by 2SLGBTQ+ people:
OR
Prefer not to say
OR
Don’t know

What percentage of this business or organization is owned by persons aged 65 or older?

Percentage owned by persons aged 65 or older:
OR
Prefer not to say
OR
Don’t know

What percentage of this business or organization is owned by members of visible minorities?

A member of a visible minority in Canada may be defined as someone (other than an Indigenous person) who is non-white in colour or race, regardless of place of birth.
Percentage owned by members of visible minorities:
OR
Prefer not to say
OR
Don’t know

Flow condition: If more than 50% of this business or organization is owned by members of visible minorities, go to Q41. Otherwise, go to “Contact person”.

41. It was indicated that at least 51% of this business or organization is owned by members of visible minorities. Please select the categories that describe the owner or owners.

Select all that apply.

  • South Asian 
    e.g., East Indian, Pakistani, Sri Lankan
  • Chinese
  • Black
  • Filipino
  • Latin American
  • Arab
  • Southeast Asian 
    e.g., Vietnamese, Cambodian, Laotian, Thai
  • West Asian 
    e.g., Afghan, Iranian
  • Korean
  • Japanese
  • Other group
    • Specify other group:
  • OR
  • Prefer not to say

Farm Financial Survey – 2025

Getting Started

Why are we conducting this survey?

This survey is being conducted by Statistics Canada, on behalf of Agriculture and Agri-Food Canada to monitor the financial situation of Canadian farms, and establish new policy.

Your information may also be used by Statistics Canada for other statistical and research purposes.

Your participation in this survey is required under the authority of the Statistics Act.

Other important information

Authorization to collect this information

Data are collected under the authority of the Statistics Act, Revised Statutes of Canada, 1985, Chapter S-19.

Confidentiality

By law, Statistics Canada is prohibited from releasing any information it collects that could identify any person, business, or organization, unless consent has been given by the respondent, or as permitted by the Statistics Act. Statistics Canada will use the information from this survey for statistical purposes only.

Record linkages

To enhance the data from this survey and to reduce the response burden, Statistics Canada may combine the acquired data with information from other surveys or from administrative sources.

Data-sharing agreements

To reduce respondent burden, Statistics Canada has entered into data-sharing agreements with provincial and territorial statistical agencies and other government organizations, which have agreed to keep the data confidential and use them only for statistical purposes. Statistics Canada will only share data from this survey with those organizations that have demonstrated a requirement to use the data.

Section 11 of the Statistics Act provides for the sharing of information with provincial and territorial statistical agencies that meet certain conditions. These agencies must have the legislative authority to collect the same information, on a mandatory basis, and the legislation must provide substantially the same provisions for confidentiality and penalties for disclosure of confidential information as the Statistics Act. Because these agencies have the legal authority to compel businesses to provide the same information, consent is not requested and businesses may not object to the sharing of the data.

For this survey, there are Section 11 agreements with the provincial statistical agencies of Newfoundland and Labrador, Nova Scotia, New Brunswick, Quebec, Ontario, Manitoba, Saskatchewan, Alberta, British Columbia and the Yukon.
The shared data will be limited to information pertaining to business establishments located within the jurisdiction of the respective province.

Section 12 of the Statistics Act provides for the sharing of information with federal, provincial or territorial government organizations. Under Section 12, you may refuse to share your information with any of these organizations by writing a letter of objection to the Chief Statistician, specifying the organizations with which you do not want Statistics Canada to share your data and mailing it to the following address:

Chief Statistician of Canada
Statistics Canada
Attention of Director, Agriculture Division
150 Tunney's Pasture Driveway
Ottawa, Ontario K1A 0T6.

You may also contact us by email at infostats: infostats@statcan.gc.ca or by fax at 1-514-496-4879.

Other data-sharing agreement

For this survey, there are Section 12 agreements with the statistical agencies of Prince Edward Island, Northwest Territories and Nunavut, as well as with the ministère de l'Agriculture, des Pêcheries et de l'Alimentation du Québec, the Ontario Ministry of Agriculture, Food and Rural Affairs, the Manitoba Department of Agriculture and Agriculture and Agri-Food Canada.

For agreements with provincial and territorial government organizations, the shared data will be limited to information pertaining to business establishments located within the jurisdiction of the respective province or territory.

Important features

To navigate the questionnaire

Use the Previous and Next buttons located at the bottom right of each page.

Do not use the navigation buttons at the top of your browser or the corresponding shortcut keys.

Question numbering

Question numbering will reset to 1 at the beginning of each new section. Based on your answers to certain questions, the questionnaire will automatically skip any questions or sub-questions that do not apply to your situation.

Session timeout

After two hours of inactivity, your session will time out. You will not be able to access any unsaved information.

To save your information

If you cannot complete the questionnaire in one session, you can save the information you have entered by pressing the Save and finish later button at the bottom left of any page on which you are asked to enter information. You can then resume your session at another time.

Please be advised that information from partially completed or unsaved questionnaires may be retained and used for statistical and research purposes.

Definitions and explanations

A help button is available for certain questions. Press this button for additional information or clarification.

Answering this questionnaire

For this questionnaire

Reporting instructions

Additional information that may be useful in the completion of this electronic questionnaire include the operation's 2025:

  • financial statements
  • tax files
  • AgriInvest Annual Statement of Account
  • AgriStability Calculation of Program Benefits Notice.

Also:

  • individual T1 and T4 tax forms
  • market value assessments of land and buildings from sources such as property tax assessments or local real estate listings.

Other information about this questionnaire

Additional information about this survey can be found by selecting the following link:

Farm Financial Survey (FFS)

Business or organization and contact information

1. Verify or provide the business or organization's legal and operating name and correct where needed.

Note: Legal name should only be modified to correct a spelling error or typo.

Note: Press the help button (?) for additional information.

Legal name

Operating name (if applicable)

2. Verify or provide the contact information for the designated contact person for the business or organization, and correct information if needed.

Note: The designated contact person is the person who should receive this questionnaire. The designated contact person may not always be the one who actually completes the questionnaire.

First name

Last name

Title

Preferred language of communication

Mailing address (number and street)

City

Province, territory or state

Postal code or ZIP (Zone Improvement Plan) code Example A9A 9A9 or 12345-1234

Country

Email address Example: user@example.gov.ca

Telephone number (including area code) Example: 123-123-1234

Extension number (if applicable)

Fax number (including area code) Example: 123-123-1234

3. Verify or provide the current operational status of the business or organization identified by the legal and operating name above.

  1. Operational
  2. Not currently operational
    e.g., temporarily or permanently closed, change of ownership

Why is this business or organization not currently operational?

  1. Seasonal operation
  2. Ceased operation
  3. Sold operations
  4. Amalgamated with other businesses or organizations
  5. Temporarily inactive but will re-open
  6. No longer operating due to other reasons

3a Seasonal operations

When did this business or organization close for the season?

Date:

Example: YYYY-MM-DD

When does this business or organization expect to resume operations?

Date:

Example: YYYY-MM-DD

3b Ceased operations

When did this business or organization cease operations?

Date:

Example: YYYY-MM-DD

Why did this business or organization cease operations?

  1. Bankruptcy
  2. Liquidation
  3. Dissolution
  4. Other
    Specify the other reasons why this operation ceased:

3c Sold operations

When was this business or organization sold?

Date:

Example: YYYY-MM-DD

What is the legal name of the buyer?

3d Amalgamated with other businesses or organizations

When did this business or organization amalgamate?

Date:

Example: YYYY-MM-DD

What is the legal name of the resulting or continuing business or organization?

What are the legal names of the other amalgamated businesses or organizations?

3e Temporarily inactive but will re-open

When did this business or organization become temporarily inactive?

Date:

Example: YYYY-MM-DD

When does this business or organization expect to resume operations?

Date:

Example: YYYY-MM-DD

Why is this business or organization temporarily inactive?

3f No longer operating due to other reasons

When did this operation or organization cease operations?

Date:

Example: YYYY-MM-DD

Why did this business or organization cease operations?

4. Verify or provide the current main activity of the business or organization identified by the legal and operating name above.

Note: The described activity was assigned using the North American Industry Classification System (NAICS).

Note: Press the help button (?) for additional information, including a detailed description of the activity with example activities and any applicable exclusions.

Descriptions and examples

This is the current main activity

This is not the current main activity

Provide a brief but precise description of this business or organization's main activity e.g. breakfast cereal manufacturing, shoe store, software development

5. You indicated that is not the current main activity

Was this business or organization's main activity ever classified as: ?

  • Yes
    When did the main activity change?
    Date
    Example: YYYY-MM-DD
  • No

6. Search and select the industry classification that best corresponds to the business or organization's main activity.

How to search:

  1. Filter the search results by first selecting the business or organization’s activity sector.
  2. Enter keywords or a brief description that best describe the business or organization’s main activity.
  3. Press the Search button to search the database for an industry activity classification that best matches the keywords or description you provided.
  4. Select an industry activity classification from the list.

Farm operating revenue and expenses

This is the start of a new module. Question numbering will reset to 1 in this section.
Note: The sequence of questions may vary depending on the responses provided. 

1. Are you an operator or a person normally authorized to provide tax data, such as revenues and expenses, to CRA for this operation?

  1. Yes
    What is your role in this operation?
    • One of the operators
    • Operator's spouse
    • Accountant
    • Other
  2. No

With your permission, Statistics Canada will share this operation's tax data on revenues and expenses only with Agriculture and Agri-Food Canada and your provincial Ministry of Agriculture, and will be used for statistical and research purposes only.

Statistics Canada does not share names, addresses or any other direct identifiers that could identify you or this operation.

If you do not grant us permission to share this information, you will be required to provide the revenues and expenses data later on in this questionnaire.

2. Do you give Statistics Canada permission to share this operation's tax data on revenues and expenses with Agriculture and Agri-Food Canada and your provincial Ministry of Agriculture?

  1. Yes
    Please provide your first and last names which will act as your electronic authorisation signature.
    Note: Statistics Canada will not share your name with external agencies.
    • Your first and last name
  2. No

Reporting period information

3. What is the end date of this operation's fiscal year?

If financial statements are not available for 2025, please use your best estimates throughout the survey.

Year

Month

Day

Characteristics of the operators and operation

4. On this operation's fiscal end date, how many operators 18 years of age and over, who participate in the business or financial decisions, were responsible for this operation?

An operation may have more than one operator but only one questionnaire is to be completed for each operation.

Exclude:

  • accountants, lawyers, crop advisors, veterinarians, herbicide consultants, etc.
  • hired labourers who work on the farm but are not responsible for management decisions
  • silent partners who own part of the farm assets but do not make management decisions.

Number of operators

5. What was the age of the oldest operator on fiscal year-end date?

Age

6. What was the gender of the oldest operator on fiscal year-end date?

  1. Male
  2. Female
  3. Gender diverse

7. What was the age of the youngest operator (minimum age of 18) on fiscal year-end date?

Age

8. What was the gender of the youngest operator (minimum age of 18) on fiscal year-end date?

  1. Male
  2. Female
  3. Gender diverse

9. As of fiscal year-end date, how many years has the most experienced operator on this operation managed a farm business?

Managing refers to controlling the decisions to produce and invest in a farm business. 

If you are the only operator, please enter your years of experience managing a farm.

Years managing a farm business

10. On fiscal year-end date, how many members were in the operator's family?

Please choose one operator (if there are more operators than just yourself), plus the operator's spouse or partner and all kids who live on the farm or whose address is still that of the farm.

Exclude operator's parents and siblings.

Number of people in operator's family

Legal operating arrangement

11. On fiscal year-end date, what was the legal operating arrangement of this operation?
Note: Press the help button (?) for additional information.

  1. Sole proprietorship
  2. Corporation (Corp.), Incorporated (Inc.), Limited (Ltd.) or Company (Co.) 
    What was the family's percent ownership of this operation?
  3. Partnership
    What was the family's percent ownership of this operation?
  4. Cooperative and communal operations
    e.g. Hutterite colonies even if they are incorporated
  5. Other legal operating arrangement
    e.g. joint venture, trust

Method of accounting

12. Which method of accounting does this operation use to report farm revenue and expenses?

  1. Cash
    Revenue (income) is reported for the fiscal period in which it is received. Expenses are reported for the fiscal period in which they are paid.
  2. Accrual
    Revenue (income) is reported for the fiscal period in which it is earned, no matter when it is received. Expenses are reported for the fiscal period in which they are incurred, whether or not they have been paid.
  3. Don't know

Major source of gross revenue

13. In 2025, which of the following was this operation's major source of gross revenue?

Major source of gross revenue usually accounts for more than 50% of total revenues.

  1. Crop production
    e.g., greenhouses, grains and oilseeds, potatoes, berries, vegetables, fruits, flowers, Christmas trees, vineyards, tobacco, maple syrup, combination crop farming, other crops
  2. Dairy cattle and milk production
    Exclude goat milk (see Sheep and goat farming), raising dairy herd replacement (see Beef cattle ranching and farming).
  3. Beef cattle ranching and farming, including feedlots
    Include animals owned by the operation, as well as custom and contract feeding.
  4. Hog and pig farming
    Include animals owned by the operation, as well as custom and contract feeding.
  5. Poultry and egg production
    Include eggs, chickens, turkeys, ducks, geese, quails, pheasants, emus, ostriches, and guinea fowls.
  6. Sheep and goat farming
    Include sheep, goats and lamb for meat, feedlots, goat milk production, wool and mohair production.
  7. Other animal production
    e.g., bee-keeping and honey production, horses and other equine, rabbits and other fur animals, bison, venison, llamas, combination animal farming, other livestock 
  8. Other
    Specify other source of gross revenue

14. In 2025, which of the following was the main source of gross revenue for crops?

The main source of gross revenue within the crops group may be less than 50% of total revenues.

  1. Greenhouse
    e.g., vegetables, mushrooms, herbs, nursery and, or floriculture products grown under cover
  2. Nursery or floriculture products not grown under cover
    Include Christmas trees, flowers, mushrooms grown outdoors and sod operation.
  3. Grains and oilseeds
    e.g., wheat, oats, peas, beans, lentils, mustard, flaxseed, canola, grain corn, soybeans, forage seeds, mixed grains
  4. Potatoes
  5. Field vegetables and melons
    e.g., sweet corn and pumpkins
    Exclude greenhouse crops.
  6. Fruits
    Include tree fruits, berries, grapes, and vineyards.
  7. Miscellaneous
    e.g., tobacco, maple syrup, herbs and spices, bulbs, hay, alfalfa for hay, ginseng, sugar beets

15. In 2025, what was the major source of beef revenue?

  • Custom or contract fed cattle
  • Cattle owned by this operation

16. In 2025, which of the following was the main source of gross revenue for cattle owned by this operation?

The main source of gross revenue within the beef group may be less than 50% of total revenues.

  1. Cow-calf operation
    e.g., calves are sold quickly, usually by fall
  2. Cow-yearling operation
    e.g., calves kept over winter and sold to another operation or feedlot
  3. Cow-finish operation
    e.g., calves raised all year, and kept over for another winter, fattened following fall, and sold for slaughter
  4. Backgrounding and feeder operation
    e.g., cattle confined in paddocks, diet predominantly hay or silage with a little grain as a supplement
  5. Feedlot operation
    e.g., grain-fed to finished weight; include veal
  6. Other cattle owned
    e.g., raising of cattle for dairy herd replacements, raising beef cattle herd replacement, grazer operations, other cattle operations

17. In 2025, which of the following was the main source of gross revenue for custom or contract cattle?

The main source of gross revenue within the beef group may be less than 50% of total revenues.

  1. Custom grazer operation
    e.g., cattle are grazed on land operated by this operation
  2. Custom feeder operation
    e.g., this operation provides feed, receives a fee to feed cattle until they are ready to be finished in a feedlot
  3. Custom feedlot operation
    e.g., this operation provides feed, receives a fee for finishing animals; include veal
  4. Custom - other
  5. Contract feeder operation
    e.g., animals and feed provided by client, this operation paid a fee to feed cattle until they are ready to be finished in a feedlot
  6. Contract feedlot operation
    e.g., animals and feed provided by client, farm paid a fee to finish animals; include veal
  7. Contract - other
    e.g., a client provides animals and feed to this operation

18. In 2025, which of the following was the main source of gross revenue for hogs?

The main source of gross revenue within the hogs group may be less than 50% of total revenues.

  1. Feeder operation
  2. Farrowing operation
  3. Farrow to finishing operation
  4. Feeder to finishing operation
  5. Finishing operation
  6. Contract - farrowing operation
  7. Contract - feeder operation
  8. Contract - finishing operation
  9. Other

19. In 2025, which of the following was the main source of gross revenue for poultry?

The main source of gross revenue within the poultry group may be less than 50% of total revenues.

  1. Layers operation
    e.g., poultry are kept for egg production
  2. Roasters operation
    e.g., birds weighing about 3.2 kg (kilogram) live weight; sold for meat
  3. Broilers operation
    e.g., birds weighing about 1.7 to 2.2 kg (kilogram) live weight; sold for meat
  4. Hatchlings operation
    Include eggs for hatchling.
  5. Turkeys operation – all categories
  6. Starter pullets operation
    e.g., small chicks are raised until they are ready to lay eggs and then are sold to layer operations
  7. Contract – poultry
    e.g., animals and feed provided by a client and this operation paid a fee to raise the animals
  8. Other poultry
    e.g., geese, ducks, pheasants, quails, ostriches, emus, guinea fowls

Unit of measure

20. What unit of measure will be used to report land areas?

The unit of measure chosen here will be used in subsequent questions.

Acres

Hectares

Arpents

Land use

21. In 2025, did this operation own land (workable and non-workable)?

Include: 

  • Crown land and all land owned by this operation whether or not it is used for farming
  • all land owned whether or not some is used by other individuals or operations.

Exclude land owned by others even if used by this operation.

  1. Yes
    How many acres, hectares or arpents did this operation own in 2025?
  2. No

22. In 2025, was any of the land owned by this operation rented by others?

Include land rented, leased or used by other individuals or operations with or without written agreement or payment.

  1. Yes
    How many acres, hectares or arpents owned by this operation were rented by others in 2025?
  2. No

23. In 2025, did this operation rent any land owned by others?

Include land owned by other individuals or operations, rented, leased or used with or without a written agreement or payment.

  1. Yes
    How many acres, hectares or arpents owned by others were rented by this operation in 2025?
  2. No

24. In 2025, what was the total area of cropland operated by this farm business?

Include:

  • cropland rented or leased from others
  • tame hay, potatoes, field crops, tree fruits or nuts, berries or grapes, vegetables, seed, sod, greenhouse or nursery products, mushrooms, Christmas trees, fodder crops, etc.

Exclude:

  • cropland rented to others
  • summerfallow, improved and unimproved pasture, woodlands.

Enter "0", if there is no value to report.

Total area of cropland operated

Cropland

25. In 2025, what was the estimated market value of a(n) acre, hectare or arpent of cropland?

Market value is the estimated price at which the land would sell for today.

26. In 2025, did this operation rent any cropland from others?

Exclude land rented for pasture.

  1. Yes
    What was the average rental price per acre, hectare or arpent for the cropland this operation rented, excluding buildings?
    Please provide your best estimate.
  2. No

Capital investments

27. In 2025, which of the following types of farm machinery and equipment did this operation purchase or lease?

Include new and used equipment.

Exclude short-term rentals and repairs and replacement parts (these are operating expenses).

Select all that apply.

  • Cars used in the farm business
    e.g., coupes, sedans, vans
  • Trucks used in the farm business
    e.g., pick-up trucks, semi-trailers, dump trucks
  • Other equipment used for transportation
    e.g., livestock trailers, equipment trailers, All-terrain vehicle (ATVs), snowmobiles
  • Grain drying equipment
  • Tractors of various types
    e.g., forklifts, Bobcats, payloaders
  • Harvesting machinery
    e.g., combines, corn pickers, forage harvesters, potato harvesters
  • Seeding equipment
    e.g., air seeders, seed drills, planters
  • Other machinery and equipment
    e.g., computers and communication materials, processing equipment, balers, manure and fertilizer spreaders
    OR
  • No investments in machinery or equipment made

28. In 2025, what was the amount of money invested for the following farm machinery and equipment (purchased or leased)?

Report the full purchase or lease price before trade-in or down payment.

Exclude:

  • monthly payments for purchased or leased machinery
  • repair and maintenance expenses.

Enter "0", if there is no value to report.

Cars used in the farm business

  • a. New, purchased
  • b. New, leased
  • c. Used, purchased
  • d. Used, leased

Trucks used in the farm business

  • e. New, purchased
  • f. New, leased
  • g. Used, purchased
  • h. Used, leased 

Other equipment used for transportation

  • i. New, purchased
  • j. New, leased
  • k. Used, purchased
  • l. Used, leased

Grain drying equipment

  • m. New, purchased
  • n. New, leased
  • o. Used, purchased
  • p. Used, leased

Tractors of various types

  • q. New, purchased
  • r. New, leased
  • s. Used, purchased
  • t. Used, leased

Harvesting machinery

  • u. New, purchased
  • v. New, leased
  • w. Used, purchased
  • x. Used, leased

Seeding equipment

  • y. New, purchased
  • z. New, leased
  • aa. Used, purchased
  • ab. Used, leased 

Other machinery and equipment

  • ac. New, purchased
  • ad. New, leased
  • ae. Used, purchased
  • af. Used, leased

29. In 2025, did this operation invest any money in farm improvements or other assets?
Include:

  • farm real estate
  • construction and renovation
  • land improvements (including trees and shrubs)
  • barn equipment
  • breeding and replacement livestock
  • other assets purchased by the farm business, e.g., land and buildings other than farmland, stocks, bonds, Guaranteed Investment Certificate (GIC), co-op shares, etc.

Exclude:

  • repairs and replacement parts (these are operating expenses)
  • personal asset purchases.
  1. Yes
  2. No

30. In 2025, what was the amount of money invested for the following?

Exclude:

  • Goods and Services Tax (GST), Provincial Sales Tax (PST), Harmonized Sales Tax (HST), Quebec Sales Tax (QST)
  • repairs and replacement parts (these are operating expenses).
    Enter "0", if there is no value to report.
  • a. Farm real estate purchased
    Exclude quota (to be reported below in option "g").
  • b. Construction and renovation of building and other structures
    e.g., barns, feed storage, machine sheds, manure storage
  • c. Construction or renovation of farm houses
  • d. Barn equipment
    e.g., robot milkers
  • e. Land improvements
    e.g., shelterbelts, windbreaks, buffer strips or fences for waterway protection, irrigation, orchard planting, draining, clearing of land
    Exclude fees paid to consultants (which are considered operating expenses).
  • f. Breeding and replacement livestock intended to be on the farm for more than one year
    Include bulls, dairy cows, beef cows, boars, sows, bred gilts, rams, ewes, replacement lambs, goats for milk or hair.
    Exclude:
    • poultry
    • breeding feed, e.g., artificial insemination—to be reported as operating expenses.
  • g. Quota purchased separately from other assets
  • h. All other assets purchased by the farm business
    e.g., land and buildings other than farmland, stocks, bonds, co-op shares, GICs (Guaranteed Investment Certificate)
    Exclude Registered Retirement Savings Plan (RRSP) and other personal investments.
    Specify all other assets purchased by the farm business 

31. In 2025, how much money did this operation receive from government programs (both federal and provincial) to reduce the cost of any capital investment made to increase environmental performance, including energy efficiency?

Enter "0", if there is no value to report.

Capital Sales

32. In 2025, did this operation sell or trade-in any of the following assets?

Select all that apply.

  • Farmland and farm buildings
    Exclude quota (to be reported in option "Quota sold separately from other assets").
  • Farm machinery and equipment (traded-in or sold outright)
    Include cars and trucks used in the farm business.
  • Quota sold separately from other assets
  • Breeding and replacement livestock
    Exclude culls for slaughter and poultry
  • All other farm assets sold
    e.g., land and buildings other than farmland and farm buildings owned by this operation, stocks, bonds, wheat pool or co-op shares
    Exclude RRSPs (Registered Retirement Savings Plan) and other personal assets sold
    OR
  • No sales of assets were made

33. In 2025, what was the selling price for the following?

Exclude GST (Goods and Services Tax), PST (Provincial Sales Tax), HST (Harmonized Sales Tax), and QST (Quebec Sales Tax).

Enter "0", if there is no value to report.

  • a. Farmland and farm buildings
    Exclude quota (to be reported in option "c").
  • b. Farm machinery and equipment (traded-in or sold outright)
    Include cars and trucks used in the farm business.
  • c. Quota sold separately from other assets
  • d. Breeding and replacement livestock
    Exclude culls for slaughter and poultry.
  • e. All other farm assets sold
    e.g., land and buildings other than farmland and farm buildings owned by this operation, stocks, bonds, wheat pool or co-op shares
    Exclude RRSPs (Registered Retirement Savings Plan) and other personal assets sold.
    Specify all other farm assets sold 

Farm assets of this operation

34. In 2025, did this operation own any livestock?

Include all poultry, all livestock and other animals owned by this farm operation.

Exclude all contract poultry and livestock not owned by this operation.

  1. Yes
  2. No

35. What was the estimated market value of the following livestock and poultry of this operation on the fiscal year-end date?

Market value is the estimated price at which the assets would sell for today.

Exclude:

  • assets not from this operation
  • contract livestock
  • quota (to be reported in question 37c).

Enter "0", if there is no value to report.

If precise figures are not available, please provide your best estimates

Market value of livestock and poultry assets

  • a. Breeding, replacement and other livestock not considered market livestock
    i.e., expected to be on the operation for more than one year
    Include all livestock and fur animals for breeding or replacement purposes, e.g., bred gilts, bison, boars, bulls, cows, ewes, fur animals, goats for milk or hair, heifers for replacement, honey bees, lambs for replacement, llamas, ostriches, race and riding horses, rams, sows.
  • b. Market livestock and poultry
    i.e., expected to be on the operation for less than one year
    Include all poultry (including layers and chicks), calves, culls, goats for meat, heifers for slaughter or feeding, lambs for slaughter, pigs (excluding boars and sows), steers, etc.

36. What was the estimated market value of the following short-term assets of this operation on the fiscal year-end date?

Market value is the estimated price at which the assets would sell for today.

Exclude: assets not from this operation

Enter "0", if there is no value to report.

If precise figures are not available, please provide your best estimates.

Short-term farm assets (less than one year)

  • a. Accounts receivable
    i.e., the amount outstanding on the fiscal year-end date for crops or livestock previously sold, deferred grain tickets, program payments, custom work and taxes receivable
    Include only those monies that are to be received within 12 months of this operation's fiscal year-end date. 
  • b. Cash and short-term investments of this operation (less than one year)
    e.g., stocks, bonds, GICs (Guaranteed Investments Certificate) or co-op shares
    Exclude personal assets and AgriInvest balance.
  • c. Inventory—Supplies on hand (inputs) such as feed, fertilizer, fuel, seed, chemicals, etc.
    Include any crops which were harvested or purchased that are not destined for market and instead are to be used in the farm business, e.g., silage, straw, hay, grain. 
  • d. Stored inventory—Crops not yet sold
    Include all harvested and stored crops destined for market e.g., potatoes, grains and oilseeds, hay etc.
  • e. All other short-term farm assets
    Include prepaid expenses (for chemicals, feed, fertilizer, seed, soil, etc.), the short-term portion of notes receivable, value of unsold livestock products, e.g., eggs, milk, pelts.
    Specify all other short-term farm assets

37. What was the estimated market value of the following long-term assets of this operation on the fiscal year-end date?

Market value is the estimated price at which the assets would sell for today.

Exclude assets not from this operation

Enter "0", if there is no value to report.

If precise figures are not available, please provide your best estimates.

Long-term farm assets (more than one year)

  • a. Market value of all farmland and buildings owned
    Include barns, farmhouses, all farmland owned, greenhouses, mushroom houses, grain bins, machine shops, silos, storage sheds, sugar bush, woodlots, farrowing houses, feeding and milking equipment.
    Exclude leased farmland and buildings and the value of quota. 
  • b. Market value of all machinery and equipment owned
    Include cars and trucks used for the farm business, combines, computers and office equipment, cultivators, feeding equipment, moveable irrigation equipment, small tools, tractors, etc.
    Exclude leased machinery.
  • c. Market value of quota
  • d. Long-term investments of this operation (one year or more)
    e.g., stocks, bonds, long-term mutual funds co-op shares, GICs (Guaranteed Investment Certificates) 
    Exclude RRSPs (Registered Retirement Savings Plan) and other personal assets and AgriInvest balance.
  • e. All other long-term farm assets
    Include:
    • grain condominiums
    • off-farm site warehouses
    • land and buildings (other than farmland and buildings of this operation reported above)
    • assets of a subsidiary company or shares of another operation
    • house owned by this operation (not owned personally by an operator)
    • the long-term portion of notes receivable
      Specify all other long-term farm assets

38. You have indicated owning farmland and buildings. What was the respective market value of each of the following assets on the fiscal year-end date? 

Market value is the estimated price at which the assets would sell for today. 

Exclude farmland and buildings not owned from this operation. 

Long-term farm assets (more than one year)

  • a. Market value of all farmland owned
    Include all farmland owned and woodlots.
  • b. Market value of all buildings owned
    Include barns, farmhouses, greenhouses, mushroom houses, grain bins, machine shops, silos, storage sheds, sugar shack, farrowing houses, feeding and milking equipment. 

Farm debt outstanding

39. On this operation's fiscal year-end date, did this operation have any long-term debts?

Long-term debts are liabilities your operation owes that are payable after more than one year past this operation's fiscal year-end date.

Include:

  • mortgages
  • outstanding loans
  • outstanding payments to suppliers
  • balance owing on operating lines of credit
  • money borrowed from family
  • money owed to government agencies or departments.

Exclude:

  • personal or other business debt not associated with this farming operation
  • leased machinery.
  1. Yes
  2. No

40. On this operation's fiscal year-end date, what was the amount of your operation's long-term debt to the following?

Enter "0", if there is no value to report.

  • a. Banks, caisses populaires, credit unions, trust companies, treasury branches
  • b. Farm Credit Canada (FCC)
  • c. Machinery and supply companies or feed companies
    e.g., accounts payable, breeder-hatchery operation, heating fuel
  • d. Family members or private individuals
  • e. Provincial government agencies
    e.g., agriculture credit or lending agencies, farm loan boards
  • h. All other long-term farm debt
    e.g., long-term notes due
    Specify all other long-term farm debt

41. On this operation's fiscal year-end date, did this operation have any short-term debts?

Short-term debts are liabilities that need to be paid by your operation by a year after your fiscal year end date.

Short-term debt includes short-term portion of long-term debt.

Include:

  • short term portion of the mortgages
  • outstanding loans
  • outstanding payments to suppliers
  • balance owing on operating lines of credit
  • money borrowed from family
  • money owed to government agencies or departments.

Exclude:

  • personal or other business debt not associated with this farming operation
  • leased machinery.
  1. Yes
  2. No

42. On this operation's fiscal year-end date, what was the amount of your operation's short-term debt to the following?

Enter "0", if there is no value to report.

  • a. Banks, caisses populaires, credit unions, trust companies, treasury branches or credit card debt 
    Include balance owing on credit cards and operating lines of credit; not the credit limit. 
  • b. Farm Credit Canada (FCC)
  • c. Advance Payments Program (APP)
  • d. Machinery and supply companies or feed companies
    e.g., accounts payable, breeder-hatchery operation, heating fuel
  • e. Family members or private individuals
  • f. Provincial government agencies
    e.g., agriculture credit or lending agencies, farm loan boards
  • g. All other short-term farm debt
    e.g., short-term notes due
    Specify all other short-term farm debt

43. The amount reported in provincial government agencies (Question 40e) may have been obtained through a financial institution, but guaranteed by the provincial government. Please confirm the lender.

  1. Bank, caisse populaire, credit union, trust company or treasury branch
  2. Provincial government

Custom or contract feeding

44. In 2025, did this operation custom or contract feed any livestock or poultry for others?

Custom or contract feeding is where livestock or poultry are fed and raised by the operation for somebody else.

Include custom or contract grazing.

Exclude animals owned by this operation.

  1. Yes
  2. No

45. In 2025, of this operation's total gross farm revenue, how much was from custom or contract feeding?

Include revenue received for the total number of livestock and poultry custom or contract fed or grazed for the whole year.

Exclude animals owned by this operation.

Enter "0" if there is no value to report.

46. Please indicate the types of livestock and poultry custom or contract fed in 2025.

Select all that apply.

  • a. Cattle
  • b. Hogs
  • c. Layers
  • d. Broilers or roasters
  • e. Turkeys
  • f. Horses
  • g. Other

47. Please indicate the total number of livestock and poultry custom or contract fed in 2025.

Include all cycles.

Exclude animals owned by the operation.

  • a. Cattle
  • b. Hogs
  • c. Layers 
  • d. Broilers or roasters
  • e. Turkeys
  • f. Horses
  • g. Other

Wages and salaries

48. In 2025, what was this operation's total expense for wages and salaries?

Include:

  • wages paid to farm operators
  • all employee benefits
  • wages paid to family members (including spouse and children)
  • room and board expenses
  • employer contributions for Worker's Compensation, Employment Insurance (EI), Canada Pension Plan (CPP) or Quebec Pension Plan (QPP).

Exclude dividends paid to shareholders.

Enter "0", if there is no value to report.

49. Of the $X total wages and salaries, how much was paid to the following?

Enter "0", if there is no value to report.

a. Family

If this operation has more than one operator, report for one operator and that operator's family.

Include:

  • wages and salaries paid to the operator's spouse or common-law partner and to their children residing in the same dwelling
  • employer contributions for Worker's Compensation, EI (Employment Insurance), CPP (Canada Pension Plan), QPP (Quebec Pension Plan).

Exclude wages and salaries paid to hired workers not in the family, family not residing in the same dwelling and any withdrawals from owner's equity.

b. Hired help

Include:

  • employer contributions for Worker's Compensation, EI (Employment Insurance), CPP (Canada Pension Plan), QPP (Quebec Pension Plan)
  • room and board expenses.

Exclude:

  • wages and salaries paid to operators and members of the operators' family
  • consultant expenses, e.g., lawyer, agronomist and all other technical expertise
  • accounting expenses
  • custom or contract workers
  • persons (shareholders) who only received dividends from this operation.

Farm operating revenue

50. In 2025, what was the total gross farm revenue (before expenses) of this operation?

Include:

  • revenues from custom and contract feeding reported previously
  • revenue from sales of breeding and replacement livestock
  • total program payments
  • the sale of agricultural products, custom and contract work
  • agri-tourism.

Exclude:

  • the sale of land and buildings, machinery, equipment, financial assets, and quota (capital gains)
  • the value of inventory adjustments
  • goods purchased for resale.

Enter "0", if there is no value to report.

51. In 2025, of the $X total gross farm revenue, how much was from the following?

The following selected revenue items may not add to the amount reported in the previous question.

Enter "0", if there is no value to report.

  • a. Sale of grains, oilseeds, pulse crops and forage seeds
  • b. Sale of horticulture products
    Include potatoes, fruits, vegetables, greenhouse products, nursery products, sod, mushrooms, Christmas trees, vineyard sales, hay, tobacco, maple syrup, herbs and spices, ginseng, sugar beets, flowers for drying, etc.
    Exclude products purchased for resale.
  • c. Sale of cattle
    Include breeding and replacement livestock.
  • d. Sale of pigs
    Include breeding and replacement livestock.
  • e. Sale of poultry
    Include eggs, chickens, turkeys, ducks, geese, quails, pheasants, emus, ostriches, and guinea fowls.
  • f. Sale of milk, cream and other dairy products
    Exclude goat and sheep milk (to be reported in option "i").
  • g. Total amount received for program payments
    Include AgriInsurance (also known as provincial crop or production insurance), AgriStability, other direct program payments, rebates e.g., hail insurance, rebates on fuel and property tax, farm GST (Goods and Services Tax) or HST (Harmonized Sales Tax) refund, subsidies, Assurance stabilisation des revenus agricoles (ASRA), etc.
    Exclude AgriInvest.
  • h. Agricultural custom or contract work and machine rentals
    Exclude amounts for custom or contract feeding.
  • i. All other farm revenue
    e.g., honey, aquaculture, goat products, sheep products, other livestock, boarding, training and sale of horses, fur and wool, sales of wood, land rentals, patronage dividends, agri-tourism

Farm operating expenses

52. In 2025, what were the total farm operating expenses?

Include wages and salaries previously reported.

Exclude:

  • the purchase of capital assets (capital investments)
  • depreciation of capital assets (capital cost allowance)
  • amortization
  • the value of inventory adjustments.

Enter "0", if there is no value to report.

53. In 2025, what were the farm operating expenses for the following?

The following selected expenses will not necessarily sum to the amount reported in the previous question.

Enter "0", if there is no value to report.

  • a. Fertilizer and lime
  • b. Herbicides, insecticides, fungicides, etc.
  • c. Seed and plants
    Exclude materials purchased for resale.
  • d. Feed, supplements and hay
  • e. Fuel for machinery, trucks and automobiles
    Include only the farm business share of amounts paid.
  • f. Total interest paid on farm debt
    Exclude payments on the principal.
  • g. Land rentals
    Include money paid to shareholders.
  • h. Heating fuel
    Include only the farm business portion of amounts paid.
  • i. Electricity
    Include only the farm business portion of amounts paid.

Financial information for sources other than this operation

Important

The purpose of the following questions is to assess the reliance of farm operators on non-farm activities for income.

When answering these questions, please refer only to off-farm incomes that are not related to this operation.

54. In 2025, what was the family's income from the following sources?

Refer to the T1 and T4 forms of all members of the operator's family (if possible).

Note: Press the help button (?) for additional information, including the definition of family.

  • a. Employment Income from sources other than this operation (before deductions)
    See T1 lines 101 and 104.
  • b. Net self-employment income from sources other than this operation
    Include business (T1 line 135), professional (T1 line 137), commission (T1 line 139), and fishing (T1 line 143) income.
  • c. Investment Income from sources other than this operation
    Include interest and other investment income (T1 line 121), taxable capital gains (T1 line 127), dividends received (T1 lines 120 and 122), and net rental income from other real estate (T1 line 126).
  • d. Pensions
    Include CPP (Canada Pension Plan) or QPP (Quebec Pension Plan) (T1 line 114), Old Age Security (OAS) (T1 line 113), Retirement Income Fund (RIF's) (T1 line 115), RRSP (Registered Retirement Savings Plan) withdrawals (T1 line 129), and Registered Pension Plans (RPPs).
  • e. Other income from Government programs for families or individuals
    e.g., Canada Child Benefit, GST (Good and Services Tax) or HST (Harmonized Sales Tax) credits, Employment Insurance (EI) (T1 line 119), Working Income Tax Benefit
    Exclude any payments for farm programs.
  • f. Other net income not from this operation (after expenses)
    e.g., income from another farm operation or business not related to this operation, oil lease rights, wind turbines, solar panels

Risk management

55. Based on your experience over the last 5 years, how would you rate each of the following risks faced by this operation?

a. Weather

  • Very important
  • Important
  • Somewhat important
  • Not important
  • Not Applicable

b. Crop insects, pests and diseases

  • Very important
  • Important
  • Somewhat important
  • Not important
  • Not Applicable

c. Livestock diseases

  • Very important
  • Important
  • Somewhat important
  • Not important
  • Not Applicable

d. Commodity prices

  • Very important
  • Important
  • Somewhat important
  • Not important
  • Not Applicable

e. Input prices

  • Very important
  • Important
  • Somewhat important
  • Not important
  • Not Applicable

f. Interest rates on loans

  • Very important
  • Important
  • Somewhat important
  • Not important
  • Not Applicable

g. Border closures or access to markets

  • Very important
  • Important
  • Somewhat important
  • Not important
  • Not Applicable

h. Exchange rate
Value of Canadian dollar

  • Very important
  • Important
  • Somewhat important
  • Not important
  • Not Applicable

i. Government policies, programs and regulations

  • Very important
  • Important
  • Somewhat important
  • Not important
  • Not Applicable

j. Labour

  • Very important
  • Important
  • Somewhat important
  • Not important
  • Not Applicable

Government-funded risk management programs—AgriInvest

56. In 2025, did this operation participate in the AgriInvest program?

AgriInvest is a self-managed producer-government savings account that allows producers to set money aside which can be used to recover from small income shortfalls or to make investments to reduce on-farm risks.

Participant is defined as “The holder of an AgriInvest Account”.

  1. Yes
  2. No
  3. Not eligible

57. In 2025, did this operation deposit into or withdraw money from AgriInvest?

Please refer to this operation's 2025 AgriInvest Annual Statement of Account.

  1. Yes
  2. No

58. In 2025, what were this operation's total AgriInvest deposits?

Please refer to this operation's 2025 AgriInvest Annual Statement of Account.

Exclude government contributions.

59. In 2025, what were this operation's total AgriInvest withdrawals?

Please refer to this operation's 2025 AgriInvest Annual Statement of Account.

60. In 2025, what were the AgriInvest withdrawals used for?

Select all that apply.

  1. To address a revenue decline
    e.g., lost production or decreased prices
  2. To pay for farm input expenses
    e.g., seed, pesticides, fertilizer, feed, livestock purchases
  3. To cover general farm expenses
    e.g., salaries and wages, rent for land and equipment, insurance, farm share of utilities, marketing
  4. To make capital investments in the farm
    e.g., land, buildings, machinery, vehicles used in farming
  5. To cover machinery expenses
    e.g., fuel, repairs, licenses and insurance for machinery and motor vehicles
  6. To make payments on farm debt
    e.g., charges, interest and principal payments to a financial institution, to an input supplier
  7. Other non-farm uses
    e.g., travel, pay home mortgage or loans not related to farming, education, vehicles not related to farming
    Specify all other non-farm uses

61. What were the ending balances in this operation's AgriInvest account as of this operation's fiscal year-end date?

Please refer to this operation's 2025 AgriInvest Annual Statement of Account.

  1. Balance in Fund 1 (operator's deposits) 
  2. Balance in Fund 2 (government contributions)

62. In 2025, which of the following reasons describe why this operation did not participate in the AgriInvest program?

Select all that apply.

  1. Program benefits are too limited
  2. Use other tools or programs to manage risks
  3. Getting out of farming (or retiring)
  4. Did not see a benefit
  5. Lack of information
  6. Not eligible
  7. Other
    Specify other reasons

63. Based on your experience, how would you rate your level of satisfaction of the following characteristics of the Agrilnvest program?

a. Delivery

Administrators communicate effectively, respond to program changes in a timely way, are accurate in processing claims, etc.

  • Very satisfied
  • Somewhat satisfied
  • Somewhat dissatisfied
  • Very dissatisfied
  • Not Applicable

b. Timeliness
Time it takes to assess the eligible amount and to receive government contribution.

  • Very satisfied
  • Somewhat satisfied
  • Somewhat dissatisfied
  • Very dissatisfied
  • Not Applicable

c. Responsiveness
Effective in helping you recover small income losses or make on-farm investments.

  • Very satisfied
  • Somewhat satisfied
  • Somewhat dissatisfied
  • Very dissatisfied
  • Not Applicable

d. Predictability
Likelihood of payments and the dollar amount are predictable.

  • Very satisfied
  • Somewhat satisfied
  • Somewhat dissatisfied
  • Very dissatisfied
  • Not Applicable

Government-funded risk management programs—AgriStability

64. In which of the following years did this operation participate in AgriStability?

Participant is defined as “A producer that has paid the fee to confirm participation in the Program year.”

AgriStability provides support when you experience a large margin decline.

Select all that apply.

  • 2025
  • 2024
  • 2023
  • 2022
    OR
  • Did not participate
    OR
  • Not eligible

65. In 2025, which of the following reasons describe why this operation did not participate in the AgriStability program?

Select all that apply.

  1. Program is complex or our operation is too small (might require an accountant)
  2. Amount of program benefits is unpredictable
  3. Program fees are relatively high
  4. Use other tools or programs to manage risks
  5. Payments are not timely
  6. Getting out of farming (or retiring)
  7. Other
    Specify other reasons

66. Based on your experience, how would you rate your level of satisfaction of the following characteristics of the AgriStability program?

a. Delivery
Administrators communicate effectively, respond to program changes in a timely way, are accurate in processing claims, etc.

  • Very satisfied
  • Somewhat satisfied
  • Somewhat dissatisfied
  • Very dissatisfied
  • Not Applicable

b. Timeliness
Time it takes to assess the eligible amount and to receive government contribution.

  • Very satisfied
  • Somewhat satisfied
  • Somewhat dissatisfied
  • Very dissatisfied
  • Not Applicable

c. Responsiveness
Effective in helping you recover small income losses or make on-farm investments.

  • Very satisfied
  • Somewhat satisfied
  • Somewhat dissatisfied
  • Very dissatisfied
  • Not Applicable

d. Predictability
Likelihood of payments and the dollar amount are predictable.

  • Very satisfied
  • Somewhat satisfied
  • Somewhat dissatisfied
  • Very dissatisfied
  • Not Applicable

67. Do you intend to enroll in the 2026 AgriStability program?

  1. Yes
  2. No
    What are the reasons?
    Select all that apply.
    1. Amount of program benefits is unpredictable
    2. Program fees are relatively high
    3. Use other tools or programs to manage risks
    4. Payments are not timely
    5. Getting out of farming (or retiring)
    6. Other
      Specify other reasons

Government-funded risk management programs—AgriInsurance

68. In which of the following years did this operation participate in AgriInsurance (also known as provincial crop insurance or production insurance)?

AgriInsurance is a federal-provincial-producer cost-shared program that stabilizes a producer's income by minimizing the economic effects of production losses caused by natural hazards. AgriInsurance is a provincially delivered program.

Select all that apply.

  1. 2025
  2. 2024
  3. 2023
  4. 2022
    OR
  5. Did not participate
    OR
  6. Not eligible

69. In 2025, which of the following reasons describe why this operation did not participate in the AgriInsurance program?

Select all that apply.

  1. Production coverage options are not clear
  2. Commodity specific plans (including coverage levels) are inadequate or not available
  3. Program benefits are unpredictable
  4. Premium costs are too high
  5. Use other tools or programs to manage risks
  6. Payments are too infrequent
  7. Getting out of farming (or retiring)
  8. Other
    Specify other reasons

70. Based on your experience, how would you rate your level of satisfaction of the following characteristics of the AgriInsurance program?

a. Delivery
Administrators communicate effectively, respond to program changes in a timely way, are accurate in processing claims, etc.

  • Very satisfied
  • Somewhat satisfied
  • Somewhat dissatisfied
  • Very dissatisfied
  • Not Applicable

b. Timeliness
Time it takes to assess the eligible amount and to receive government contribution.

  • Very satisfied
  • Somewhat satisfied
  • Somewhat dissatisfied
  • Very dissatisfied
  • Not Applicable

c. Responsiveness
The effectiveness of the coverage in helping you recover from production losses.

  • Very satisfied
  • Somewhat satisfied
  • Somewhat dissatisfied
  • Very dissatisfied
  • Not Applicable

d. Predictability
Likelihood of payments and the dollar amount are predictable.

  • Very satisfied
  • Somewhat satisfied
  • Somewhat dissatisfied
  • Very dissatisfied
  • Not Applicable

Government-funded risk management programs—Advance Payments Program (APP)

71. Has this operation ever participated in the Advance Payments Program (APP)?

Advance Payments Program (APP) is a federal loan guarantee program which provides agricultural producers with easy access to low-interest cash advances.

  1. Yes
    How much was the last advance for this operation?
    • a. $100,000 or under
    • b. $100,001 to $200,000
    • c. $200,001 to $300,000
    • d. $300,001 to $400,000
    • e. $400,001 to $500,000
    • f. $500,001 to $1,000,000
      Why did this operation receive this amount?
      Select all that apply
      1. Only requested an interest-free advance
      2. Amount was required to meet cash-flow needs
      3. Not eligible to receive more
      4. Other
        Specify other reason
  2. No
  3. Not eligible

72. Why did this operation borrow money through the Advance Payments Program (APP)?

Select all that apply.

  1. To manage my inventory to maximize sales revenue
  2. Terms for APP loans (e.g., interest rates, repayment terms) are attractive compared to other financing options
  3. APP loans are effective in helping manage cash flow of my operation
  4. Other
    Specify other reasons

73. In 2025, did this operation participate in the Advance Payments Program (APP)?

  1. Yes
  2. No

74. Will this operation participate in the Advance Payments Program (APP) in coming years?

  1. Yes
  2. No
    What are the reasons? 
    Select all that apply
    • a. This operation has other means of managing cash flow
    • b. Other lenders have more beneficial terms or services
    • c. Don't know enough about the APP
    • d. The size of the loan doesn't reflect this operation's needs
    • e. Conditions for advances (e.g., repayment terms, interest rate) are not attractive
    • f. Other
      Specify other reasons
  3. Don't know

Private risk management strategies

75. In 2025, which of the following tools or programs did the operation use to manage business risks?

Select all that apply.

  1. Livestock Price Insurance (LPI)
  2. Maritime Livestock Price Insurance Pilot Program (MLPIPP)
  3. Futures Market Hedging or Options
  4. Private Insurance
    e.g., livestock mortality, hail insurance
  5. Canadian Agricultural Loans Act
  6. Price pooling tools
    e.g., grain pools; exclude supply-managed marketing boards
  7. Deliverables Insurance
    i.e., for non payment on delivery
  8. Production or marketing contracts with buyers, processors, seed companies, etc.
    Exclude supply-managed commodities, futures contracts and options.
    OR
  9. None of the above

Risk management

76. For your operation, how important are each of the following government-funded risk management programs in providing an effective means of managing business risk and disaster situations (caused by weather, low commodity prices, etc.) at your farm operation?

a. AgriInvest

  • Very important
  • Important
  • Somewhat important
  • Not important
  • Not Applicable

b. AgriStability

  • Very important
  • Important
  • Somewhat important
  • Not important
  • Not Applicable

c. AgriInsurance

  • Very important
  • Important
  • Somewhat important
  • Not important
  • Not Applicable

d. Advance Payments Program (or Cash Advance Program)

  • Very important
  • Important
  • Somewhat important
  • Not important
  • Not Applicable

77. For your operation, how important are each of the following strategies in providing an effective means of managing business risk and disaster situations (caused by weather, low commodity prices, etc.) at your farm operation?

a. Make use of market-based or private risk management tools (production or marketing contracts, hedging, options, private insurance)

  • Very important
  • Important
  • Somewhat important
  • Not important
  • Not Applicable

b. Livestock Price Insurance (LPI)

  • Very important
  • Important
  • Somewhat important
  • Not important
  • Not Applicable

c. Maritime Livestock Price Insurance Pilot Program (MLPIPP)

  • Very important
  • Important
  • Somewhat important
  • Not important
  • Not Applicable

d. Diversification of farm production

  • Very important
  • Important
  • Somewhat important
  • Not important
  • Not Applicable

e. Off-farm income or other income sources

  • Very important
  • Important
  • Somewhat important
  • Not important
  • Not Applicable

f. Other

  • Very important
  • Important
  • Somewhat important
  • Not important
  • Not Applicable

78. You've indicated there were other risk management tools or strategies providing effective means of managing business risk and disaster situations (caused by weather, low commodity prices, etc.) at your farm operation. What are these other risk management tools or strategies?

79. How has this operation's Business Risk Management (BRM) strategy shifted in the last five years?

BRM (Business Risk Management) programs include AgriInvest, AgriStability, AgriInsurance and the Advance Payments Program.

  1. No major shift
  2. Rely more on BRM programs than before
  3. Rely less on BRM programs and more on private risk management tools
  4. Rely less on both BRM programs and private risk management tools and more on on-farm mitigation strategies (e.g., diversification)

80. In recent years, how much of a role did Business Risk Management (BRM) programs play in this operation's investment decisions?

BRM (Business Risk Management) programs include AgriInvest, AgriStability, AgriInsurance and the Advance Payments Program.

  1. No role
  2. Minor role
  3. Moderate role
  4. Large role
  5. Very large role

On-farm innovation

The following questions will assist in improving policies and programs that foster innovation in the sector. Information on current practices will be very helpful.

Innovation means implementing a new or significantly improved product, practice or process on your farming operation. Innovations must be new to your operation but need not be new to the industry.

81. In the last three years, 2023 to 2025, did this operation implement any of the following new or significantly improved products or practices?

New or significantly improved product, practices or process means any innovation you've adopted to your operation. The innovation must be new to your operation, but not necessarily new to the industry.

a. Crop products
e.g., crop varieties, cultivars or hybrids

  1. Yes
  2. No

b. Livestock products
e.g., types or breeds raised

  1. Yes
  2. No

c. Production practices

For example:

  • feed management, animal housing, manure storage and treatment, livestock handling, grazing, biosecurity, other animal health and productivity practices
  • seeding or planting, rotations, fertilizer or manure application, pest management, irrigation, harvesting, crop storage, using Global Positioning System (GPS) technology, other soil, land or crop improvement practices
  • water management, organic farming, halal and other production practices
  • precision agriculture using sensors and drones, AI (artificial intelligence)-based pest detection, autonomous robots and unmanned machines (harvesting, weeding, spraying, etc), regenerative farming techniques
  1. Yes
  2. No

d. Approaches to marketing

e.g., types of contracts, futures, options, direct marketing, AI-powered market analysis tools, blockchain for supply chain transparency, digital platforms for direct-to-consumer sales

  1. Yes
  2. No

e. Business management practices

e.g., approaches to labour requirements, business ownership or partnerships, ways of acquiring inputs, new processing activities, farm management software with AI analytics, automated accounting systems, cloud-based inventory management

  1. Yes
  2. No

Best management practices

The questions in this section focus on hay field or pasture composition.

82. In 2025, did this operation maintain any hay fields or pastures?

  1. Yes
    How many acres, hectares or arpents of hay fields or pastures did you operate?
    Include hay fields or pastures rented from others.
    Exclude hay fields or pastures on farmland rented to others.
  2. No

83. In 2025, did any of your hay fields or pastures include the following legumes or quality forages?

Select all that apply.

  • Alfalfa
  • Tannin containing legumes
    e.g., sainfoin or cicer milkvetch
  • Quality forages
    e.g., timothy, fescues, meadow brome
    OR
  • None of the above

84. In 2025, how many acres, hectares or arpents of hay fields or pastures included legumes or quality forages?

Include hay fields or pastures rented from others.

Exclude hay fields or pastures rented to others.

85. The last time you seeded your hay field or pastureland, what was the cost per acre, hectare or arpent to include legumes or quality forages?

Include the cost of seed and seeding, labour and any other related costs.

  • Cost per acre, hectare or arpent in CAN$
    OR
  • Don't know

86. What is the most recent year in which this operation seeded legumes or quality forages in hay fields or pastures?

  • Year
    OR
  • Don't know
  • Never seeded or naturally occurring

87. In 2025, how important were each of the following reasons for including legumes or quality forages in hay fields or pastures?

a. Improved profitability

  • Very important
  • Important
  • Somewhat important
  • Not important
  • Not Applicable

b. Improved cattle health and productivity

  • Very important
  • Important
  • Somewhat important
  • Not important
  • Not Applicable

c. On-farm conservation
e.g., increase in biodiversity

  • Very important
  • Important
  • Somewhat important
  • Not important
  • Not Applicable

d. Environmental benefits
e.g., reduction in greenhouse gases

  • Very important
  • Important
  • Somewhat important
  • Not important
  • Not Applicable

e. Knowing other operations that had successfully included legumes or quality forages

  • Very important
  • Important
  • Somewhat important
  • Not important
  • Not Applicable

f. Anticipated saving time or effort

  • Very important
  • Important
  • Somewhat important
  • Not important
  • Not Applicable

g. This operation received technical assistance

  • Very important
  • Important
  • Somewhat important
  • Not important
  • Not Applicable

h. This operation received financial assistance

  • Very important
  • Important
  • Somewhat important
  • Not important
  • Not Applicable

i. Other reasons

  • Very important
  • Important
  • Somewhat important
  • Not important
  • Not Applicable

88. Please specify the other reasons for including legumes or quality forages in hay fields or pastures.

89. In 2025, what were the main reasons that this operation did not include legumes or quality forages in hay fields or pastures.

Select all that apply.

  • Uncertainty about the economic benefits
  • Did not meet the conservation needs of this operation
  • Too much time or effort required to implement this practice
  • Insufficient financial assistance to cover the costs
  • Lack of technical assistance
  • This operation did not own the land
  • Other reasons
    • Specify the other reasons

Farm production losses

90. In 2025, did this operation produce fruits, vegetables, potatoes or mushrooms?

  1. Yes
  2. No

91. In 2025, did this operation experience any loss of fully grown fruits, vegetables, potatoes or mushrooms that were harvest-ready or that had already been harvested?

Exclude loss from product that was still growing.

  1. Yes
  2. No

92. In 2025, what were the causes of the losses of harvest-ready production that occurred on this farm?

Select all that apply.

  • Rejection due to quality standards
    How much did the rejection due to quality standards contribute to the losses of harvest-ready or harvested production for this operation?
  1. Contributed a lot
  2. Contributed a little
  • Inadequate labour capacity
    How much did inadequate labour capacity contribute to the losses of harvest-ready or harvested production for this operation?
  1. Contributed a lot
  2. Contributed a little
  • Equipment issues or breakdowns
    How much did equipment issues or breakdowns contribute to the losses of harvest-ready or harvested production for this operation?
  1. Contributed a lot
  2. Contributed a little
  • Inaccurate supply and demand forecasting, cancelled orders or contracts
    How much did inadequate forecasting or cancelled orders contribute to the losses of harvest-ready or harvested production for this operation?
  1. Contributed a lot
  2. Contributed a little
  • Inadequate storage
    How much did inadequate storage contribute to the losses of harvest-ready or harvested production for this operation?
  1. Contributed a lot
  2. Contributed a little
  • Transportation delays
    How much did transportation delays contribute to the losses of harvest-ready or harvested production for this operation?
  1. Contributed a lot
  2. Contributed a little
  • Price volatility made harvesting unaffordable
    How much did price volatility contribute to the losses of harvest-ready or harvested production for this operation?
  1. Contributed a lot
  2. Contributed a little
  • Overproduction—unable to sell all
    How much did overproduction contribute to the losses of harvest-ready or harvested production for this operation?
  1. Contributed a lot
  2. Contributed a little
  • Could not find a market
    How much did not finding a market contribute to the losses of harvest-ready or harvested production for this operation?
  1. Contributed a lot
  2. Contributed a little
  • Other reasons
    Specify the other reasons
    How much did these other reasons contribute to the losses of harvest-ready or harvested production for this operation?
  1. Contributed a lot
  2. Contributed a little

93. In 2025, which of the following practices did this operation have in place to manage any losses of harvest-ready or harvested production?

Select all that apply.

  • Donation or sharing with others
    e.g., food banks
  • Diversions to animal feed production
  • Diversion to energy production
    e.g., anaerobic digestion
  • Production of compost
  • Left in a pile to naturally decompose
  • Left in the field
  • Actively applied to the field
  • Disposal at landfill
  • Burnt or incinerated
  • Other practices
    Specify the other practices

94. In 2025, what was the estimated cost associated with the disposal of losses of harvest-ready or harvested production?

Include haulage, tipping fees and other disposal costs.

Direct sales to retailers

95. In 2025, did this operation sell any products directly to retailers?

A retailer is an operation that sells directly to customers. Exclude wholesalers, cooperatives and sales directly to customers.

  1. Yes
    Did this operation encounter any of the following challenges?
    Select all that apply.
    • Lack of transparency in the application of retail fees
    • Unpredictable payment terms
    • Difficult price negotiation
    • Changes to previously agreed upon terms or conditions
    • Meeting volume requirements
    • Other challenges
      Specify the other challenges
  2. No

On-farm innovation

96. In the last three years, 2023 to 2025, how important were the following activities when deciding to try something new on this operation?

a. Obtaining advice and information from fellow farmers based on their experiences

  • Very important
  • Important
  • Somewhat important
  • Not important

b. Attending demonstration farms and field days to observe the innovation implemented

  • Very important
  • Important
  • Somewhat important
  • Not important

c. Attending workshops, seminars, meetings or conferences

  • Very important
  • Important
  • Somewhat important
  • Not important

d. Obtaining information from input companies
e.g., seed and feed dealers

  • Very important
  • Important
  • Somewhat important
  • Not important

e. Seeking information from independent consultants

  • Very important
  • Important
  • Somewhat important
  • Not important

f. Seeking information from regional specialists or extension officers

  • Very important
  • Important
  • Somewhat important
  • Not important

g. Reading detailed technical and financial information
e.g., on line research

  • Very important
  • Important
  • Somewhat important
  • Not important

h. Relying on own experience

  • Very important
  • Important
  • Somewhat important
  • Not important

i. Participating in producer associations

  • Very important
  • Important
  • Somewhat important
  • Not important

97. In the last three years, from 2023 to 2025, how important were the following factors when deciding to try something new on this operation?

a. Cost reduction or increase in production

  • Very important
  • Important
  • Somewhat important
  • Not important

b. Increase in value of product
e.g., due to superior quality or attributes or novelty of the product

  • Very important
  • Important
  • Somewhat important
  • Not important

c. Environmental benefits

  • Very important
  • Important
  • Somewhat important
  • Not important

d. Benefits for work and family balance

  • Very important
  • Important
  • Somewhat important
  • Not important

e. Level of financial risk of the innovation compared to current practice

  • Very important
  • Important
  • Somewhat important
  • Not important

f. Access to financial resources to implement the innovation
e.g., loans, venture capital or other financing

  • Very important
  • Important
  • Somewhat important
  • Not important

g. Availability of information to assess the value of the innovation for your operation

  • Very important
  • Important
  • Somewhat important
  • Not important

h. Technical expertise to implement the innovation

  • Very important
  • Important
  • Somewhat important
  • Not important

i. Operator’s time required to implement the innovation

  • Very important
  • Important
  • Somewhat important
  • Not important

j. Labour requirement

  • Very important
  • Important
  • Somewhat important
  • Not important

k. Worker safety

  • Very important
  • Important
  • Somewhat important
  • Not important

98. When it comes to the introduction of new or significantly improved products, processes or practices, does this operation tend to:

  1. be among the first to try something new
  2. wait until at least a few others have tried it first
  3. wait until it has been well tested
  4. be among the last to try something new

Local Food

99. In 2025, did this operation sell any food products locally?

Include direct-to-consumer, local independent or chain retailers, local independent or chain restaurants, food trucks, caterers, meal kits and local institutions. 

Exclude:

  • sales to local processors, manufacturers and wholesalers
  • charitable donations, animal feed and food produced by other farms. 
  1. Yes
  2. No

100. In 2025, approximately what percentage of your operation’s total sales came from local market channels?

For local market channels include direct-to-consumer, local independent or chain retailers, local independent or chain restaurants, food trucks, caterers, meal kits and local institutions.

Exclude:

  • sales to local processors, manufacturers and wholesalers
  • charitable donations, animal feed and food produced by other farms. 

Percentage of total sales

If less than 1%, please enter 1%

101. Thinking only about your operation’s local food sales in 2025, what percentage came from the following local market channels?

Exclude:

  • sales to local processors, manufacturers and wholesalers
  • charitable donations, animal feed and food produced by other farms. 
  1. Direct-to-consumer
    e.g., online, kiosks, U-pick, farmers’ markets, community supported agriculture baskets
  2. Local independent or chain retailers
    e.g., grocery, mass merchandisers, bakeries
  3. Local independent or chain restaurants, food trucks, caterers or meal kits
  4. Local institutions
    e.g., hospitals, schools
  5. Other
    Specify other local market channel

Changes or events

102. Indicate any changes or events that affected the reported values for this business or organization compared with the last reporting period.

Select all that apply.

  1. Price changes in goods or services sold
  2. Price changes in labour or raw materials
  3. Natural disaster
  4. Weather—early or late start to spring or winter
  5. Other
    Specify the other change or event
    OR
  6. No changes or events

Contact person

103. Statistics Canada may need to contact the person who completed this questionnaire for further information.

Is the respondent the best person to contact?

  1. Yes
  2. No
    Who is the best person to contact about this questionnaire?
    • a. First name
    • b. Last name
    • c. Title
    • d. Email address
      Example: user@example.gov.ca
    • e. Telephone number (including area code)
      Example: 123-123-1234
    • f. Extension number (if applicable)
    • g. Fax number (including area code)
      Example: 123-123-1234

Feedback

104. How long did it take to complete this questionnaire?

Include the time spent gathering the necessary information.

105. Do you have any comments about this questionnaire?

200 characters available

Wholesale Trade Survey (monthly): CVs for total sales by geography - April 2026

Wholesale Trade Survey (monthly): CVs for total sales by geography - April 2026
GeographyMonth
202504202505202506202507202508202509202510202511202512202601202602202603202604
percentage
Canada1.20.90.40.40.40.50.50.50.50.50.50.40.4
Newfoundland and Labrador1.80.30.30.30.30.30.70.30.41.10.30.40.7
Prince Edward Island0.00.00.00.00.00.00.00.00.00.00.00.00.0
Nova Scotia7.110.72.82.81.61.21.14.81.41.62.21.92.3
New Brunswick4.31.51.00.81.00.70.71.40.50.80.50.91.9
Quebec4.33.11.31.81.32.01.71.92.01.82.21.41.7
Ontario2.31.60.70.80.80.91.00.90.91.01.00.90.9
Manitoba1.31.20.80.81.10.40.30.80.40.60.40.50.4
Saskatchewan1.60.50.40.90.61.00.30.20.50.60.20.40.7
Alberta0.60.70.40.50.50.50.50.40.70.60.40.30.2
British Columbia1.82.20.81.11.61.82.71.81.41.71.51.11.1
Yukon Territory0.00.00.00.00.00.00.00.00.00.00.00.00.0
Northwest Territories0.00.00.00.00.00.00.00.00.00.00.00.00.0
Nunavut0.00.00.00.00.00.00.00.00.00.00.00.00.0