
Help spread the word about 2021 census data on housing in Canada. These data were released on September 21, 2022.
Quick facts
- The homeownership rate (66.5% in 2021) is on the decline in Canada after peaking in 2011 (69.0%).
- Adults under the age of 75 were less likely to own their home in 2021 than adults in that age range a decade earlier.
- Over one-third (36.6%) of recently built dwellings – those constructed from 2011 to 2021 – were occupied and primarily maintained by a Millennial renter or owner.
- Most condominiums (90.0%) are located in Canada's large cities, known as census metropolitan areas.
- In Canada's census metropolitan areas, condominiums make up 39.9% of the occupied stock in the primary downtowns in 2021, and half of these downtown condos are being rented out by investors.
- The rate of unaffordable housing, or the proportion of households that spent 30% or more of their income on shelter costs, fell from 24.1% in 2016 to 20.9% in 2021.
- Unaffordable housing rates are highest in downtowns: in 33 of 42 downtowns of large urban centres, the percentage of renters spending more than 30% of their income on shelter costs was above the national average.
- Almost 1.5 million Canadian households lived in "core housing need" in 2021, defined as living in an unsuitable, inadequate or unaffordable dwelling, and not able to afford alternative housing in their community.
- There were 603,040 children (8.8%) living in core housing need in 2021, down from 13.3% in 2016.
- Expected home values rose in large and small municipalities (census subdivisions, CSDs) in Ontario and British Columbia between 2016 and 2021. Among CSDs, 77.8% in Ontario and 46.1% in British Columbia saw the average expected value of homes rise by over 50%.
Resources
Social media content
Statistics Canada encourages our community supporters to share our content and images to their own social media accounts. You can save the images to your device and copy and paste the text content to your social media platforms.
Post 1
Alt text / description - Post 1 image
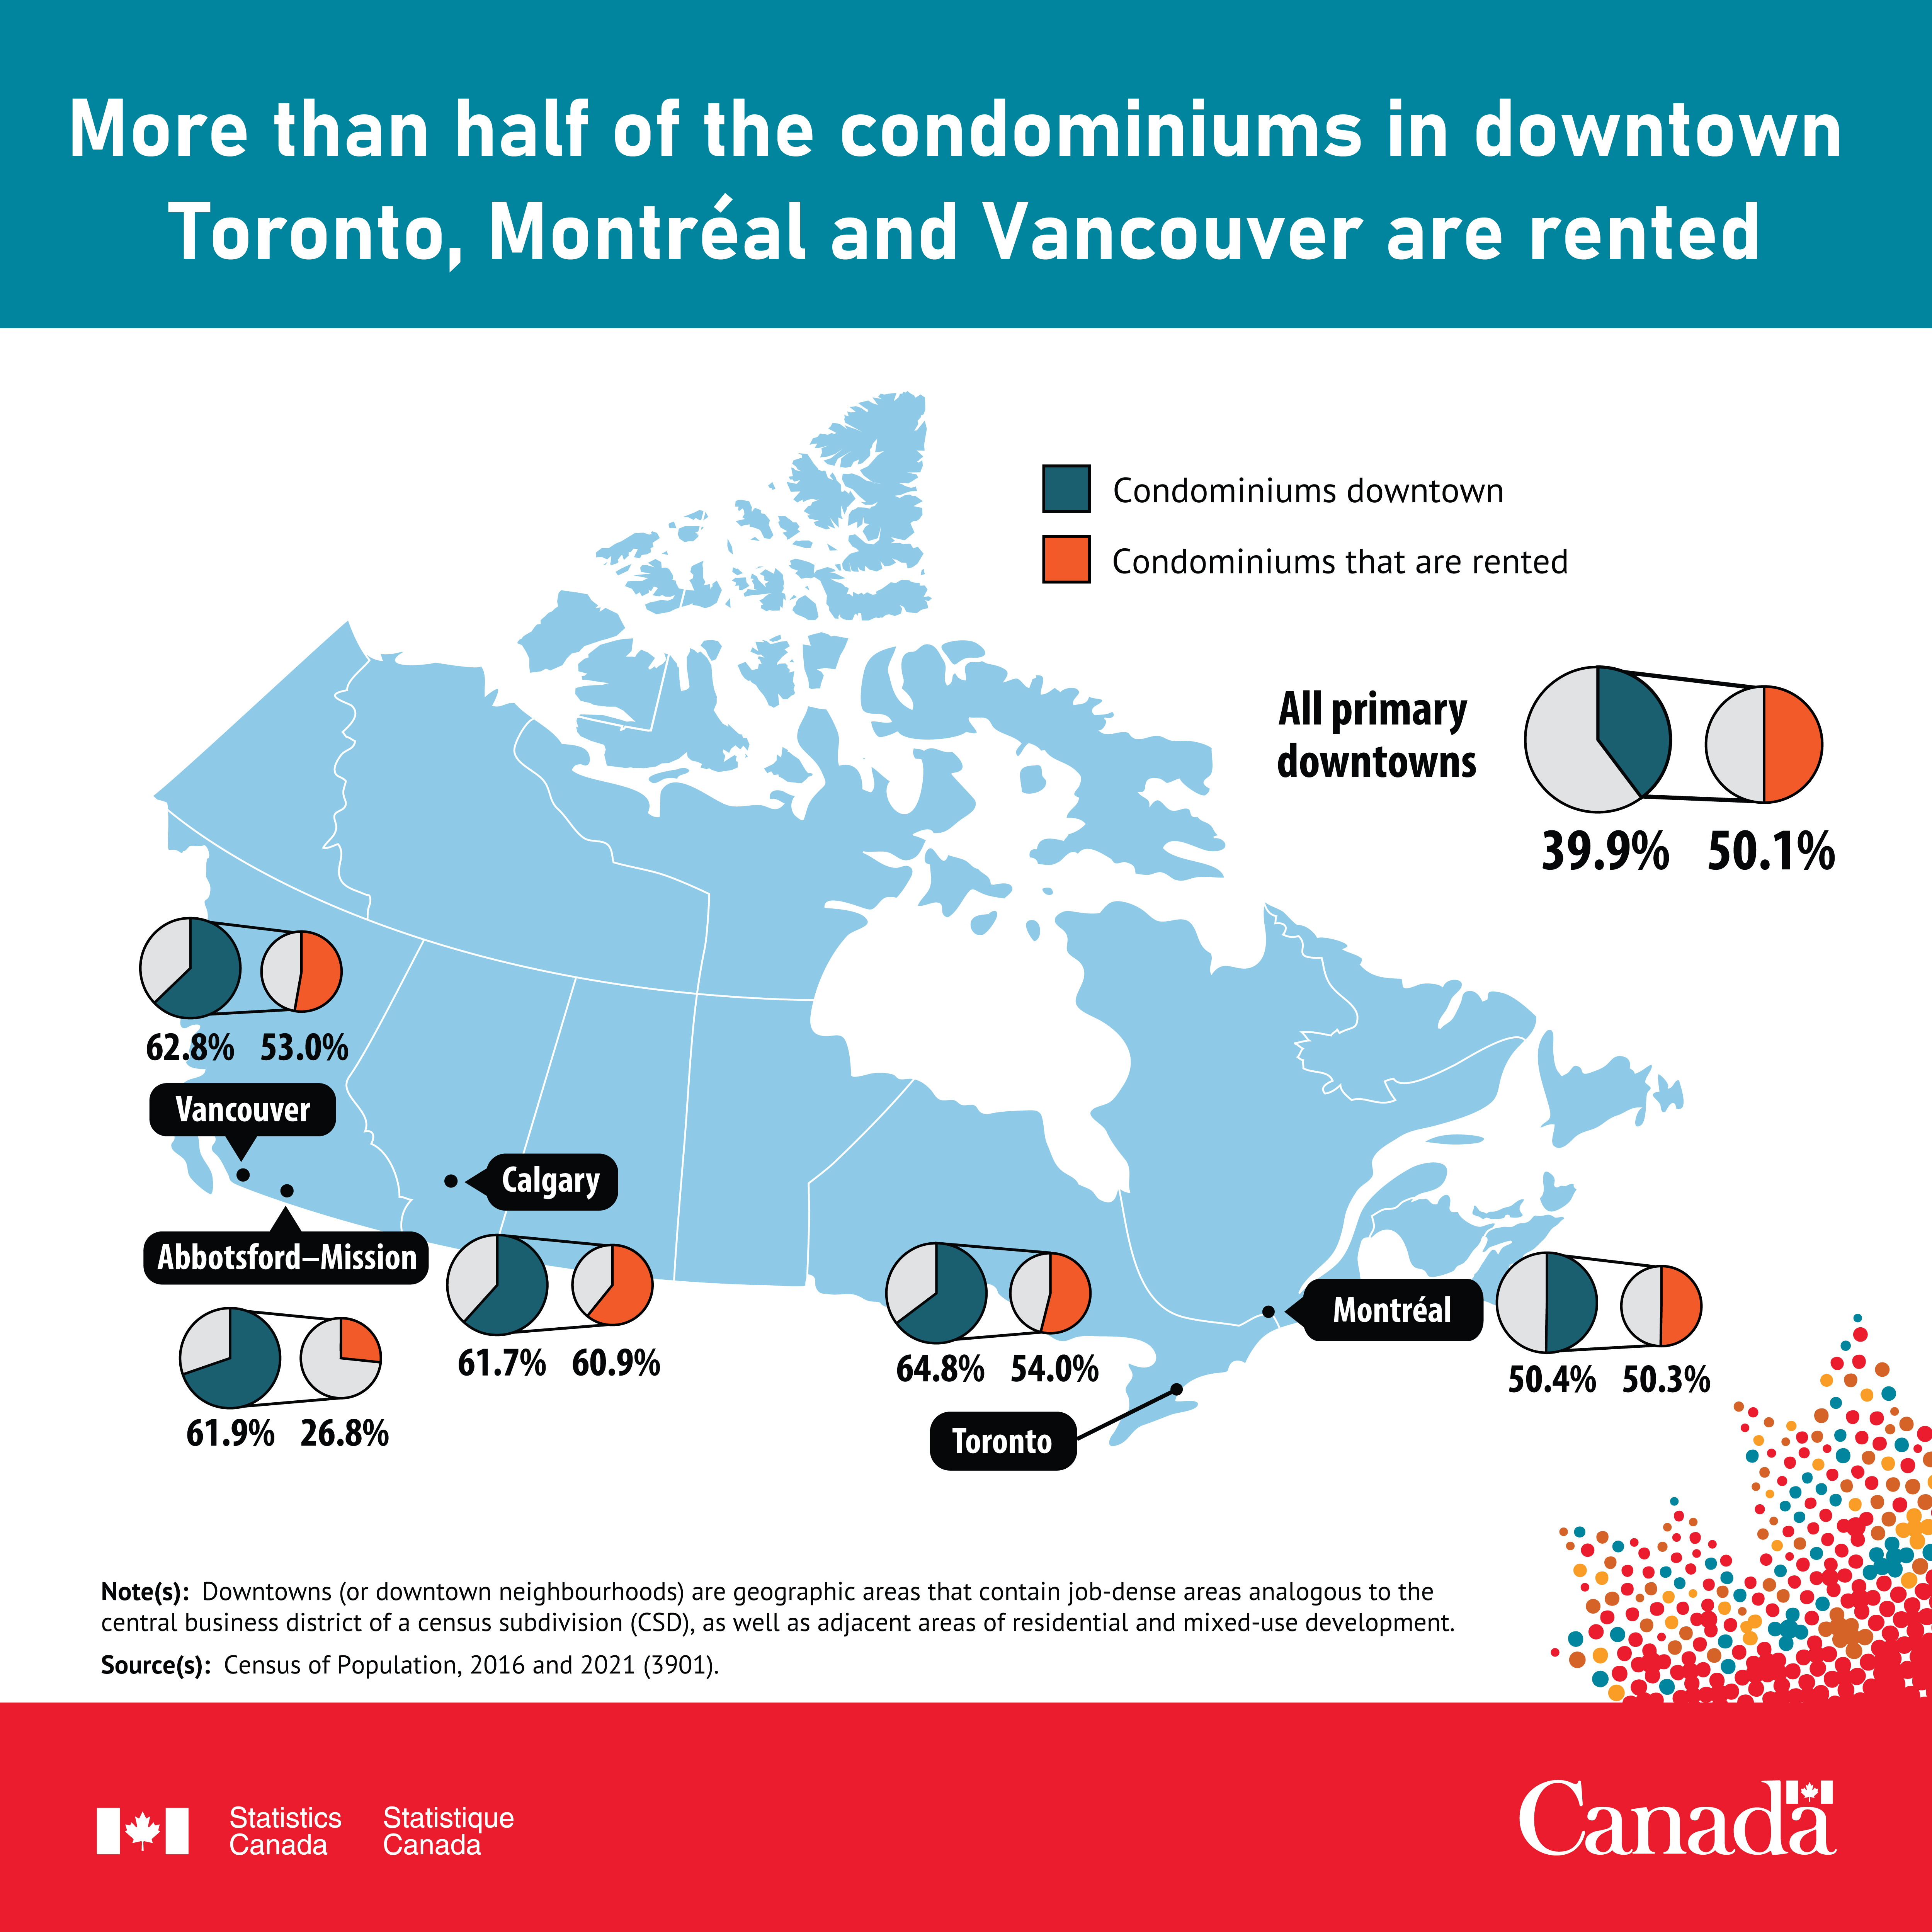
More than half the condominiums in downtown Toronto, Montréal and Vancouver are rented.
This is a map of Canada showing the five primary downtowns with the highest percentage of condominiums in 2021. The map also shows, for these five primary downtowns, the percentage of the condominiums that are rented.
In all primary downtowns, the percentage of occupied dwellings that were condominiums in 2021 was 39.9% and the percentage of these condominiums that were rented was 50.1%.
In the primary downtown of the Toronto census metropolitan area, the percentage of occupied dwellings that were condominiums in 2021 was 64.8%, and the percentage of these condominiums that were rented was 54.0%.
In the primary downtown of the Vancouver census metropolitan area, the percentage of occupied dwellings that were condominiums in 2021 was 62.8%, and the percentage of these condominiums that were rented was 53.0%.
In the primary downtown of the Abbotsford–Mission census metropolitan area, the percentage of occupied dwellings that were condominiums in 2021 was 61.9%, and the percentage of these condominiums that were rented was 26.8%.
In the primary downtown of the Calgary census metropolitan area, the percentage of occupied dwellings that were condominiums in 2021 was 61.7%, and the percentage of these condominiums that were rented was 60.9%.
In the primary downtown of the Montréal census metropolitan area, the percentage of occupied dwellings that were condominiums in 2021 was 50.4%, and the percentage of these condominiums that were rented was 50.3%.
Note(s): Downtowns (or downtown neighbourhoods) are geographic areas that contain job‑dense areas analogous to the central business district of a census subdivision (CSD), as well as adjacent areas of residential and mixed‑use development.
Source(s): Census of Population, 2021 (3901).
Suggested text:
Did you know that more than half of the condominiums in downtown Toronto, Montreal and Vancouver are rented?
Check out the new #2021Census data for more info: https://bit.ly/3xrvWUs
Post 2
Alt text / description - Post 2 image
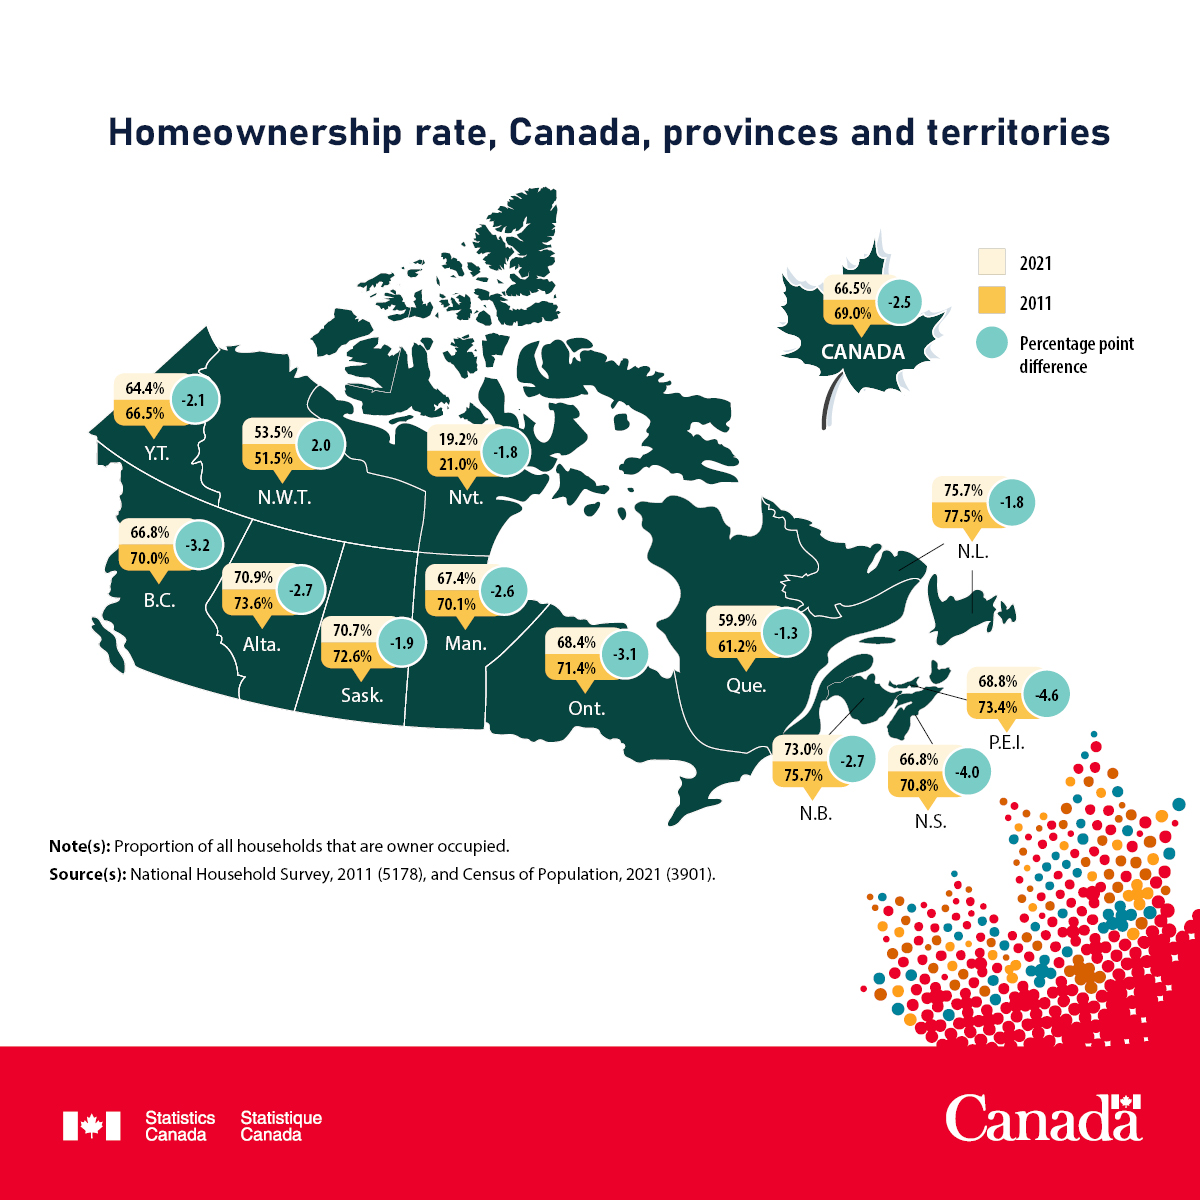
Homeownership rate, Canada, provinces and territories
This is a map of Canada showing the homeownership rate by province and territory in 2011 and 2021, and the change in the homeownership rate from 2011 to 2021.
In Canada, the homeownership rate in 2021 was 66.5%, and it fell 2.5 percentage points from 69.0% in 2011.
In Newfoundland and Labrador, the homeownership rate in 2021 was 75.7%, and it fell 1.8 percentage points from 77.5% in 2011.
In Prince Edward Island, the homeownership rate in 2021 was 68.8%, and it fell 4.6 percentage points from 73.4% in 2011.
In Nova Scotia, the homeownership rate in 2021 was 66.8%, and it fell 4.0 percentage points from 70.8% in 2011.
In New Brunswick, the homeownership rate in 2021 was 73.0%, and it fell 2.7 percentage points from 75.7% in 2011.
In Quebec, the homeownership rate in 2021 was 59.9%, and it fell 1.3 percentage points from 61.2% in 2011.
In Ontario, the homeownership rate in 2021 was 68.4%, and it fell 3.1 percentage points from 71.4% in 2011.
In Manitoba, the homeownership rate in 2021 was 67.4%, and it fell 2.6 percentage points from 70.1% in 2011.
In Saskatchewan, the homeownership rate in 2021 was 70.7%, and it fell 1.9 percentage points from 72.6% in 2011.
In Alberta, the homeownership rate in 2021 was 70.9%, and it fell 2.7 percentage points from 73.6% in 2011.
In British Columbia, the homeownership rate in 2021 was 66.8%, and it fell 3.2 percentage points from 70.0% in 2011.
In Yukon, the homeownership rate in 2021 was 64.4%, and it fell 2.1 percentage points from 66.5% in 2011.
In the Northwest Territories, the homeownership rate in 2021 was 53.5%, and it rose 2.0 percentage points from 51.5% in 2011.
In Nunavut, the homeownership rate in 2021 was 19.2%, and it fell 1.8 percentage points from 21.0% in 2011.
Note(s): Proportion of all households that are owner occupied.
Source(s): National Household Survey, 2011 (5178), and Census of Population, 2021 (3901).
Suggested text:
The homeownership rate in Canada has declined in almost all provinces and territories since 2011.
Learn more about the recently released #2021Census housing data: https://bit.ly/3xrvWUs
Post 3
Alt text / description - Post 3 image
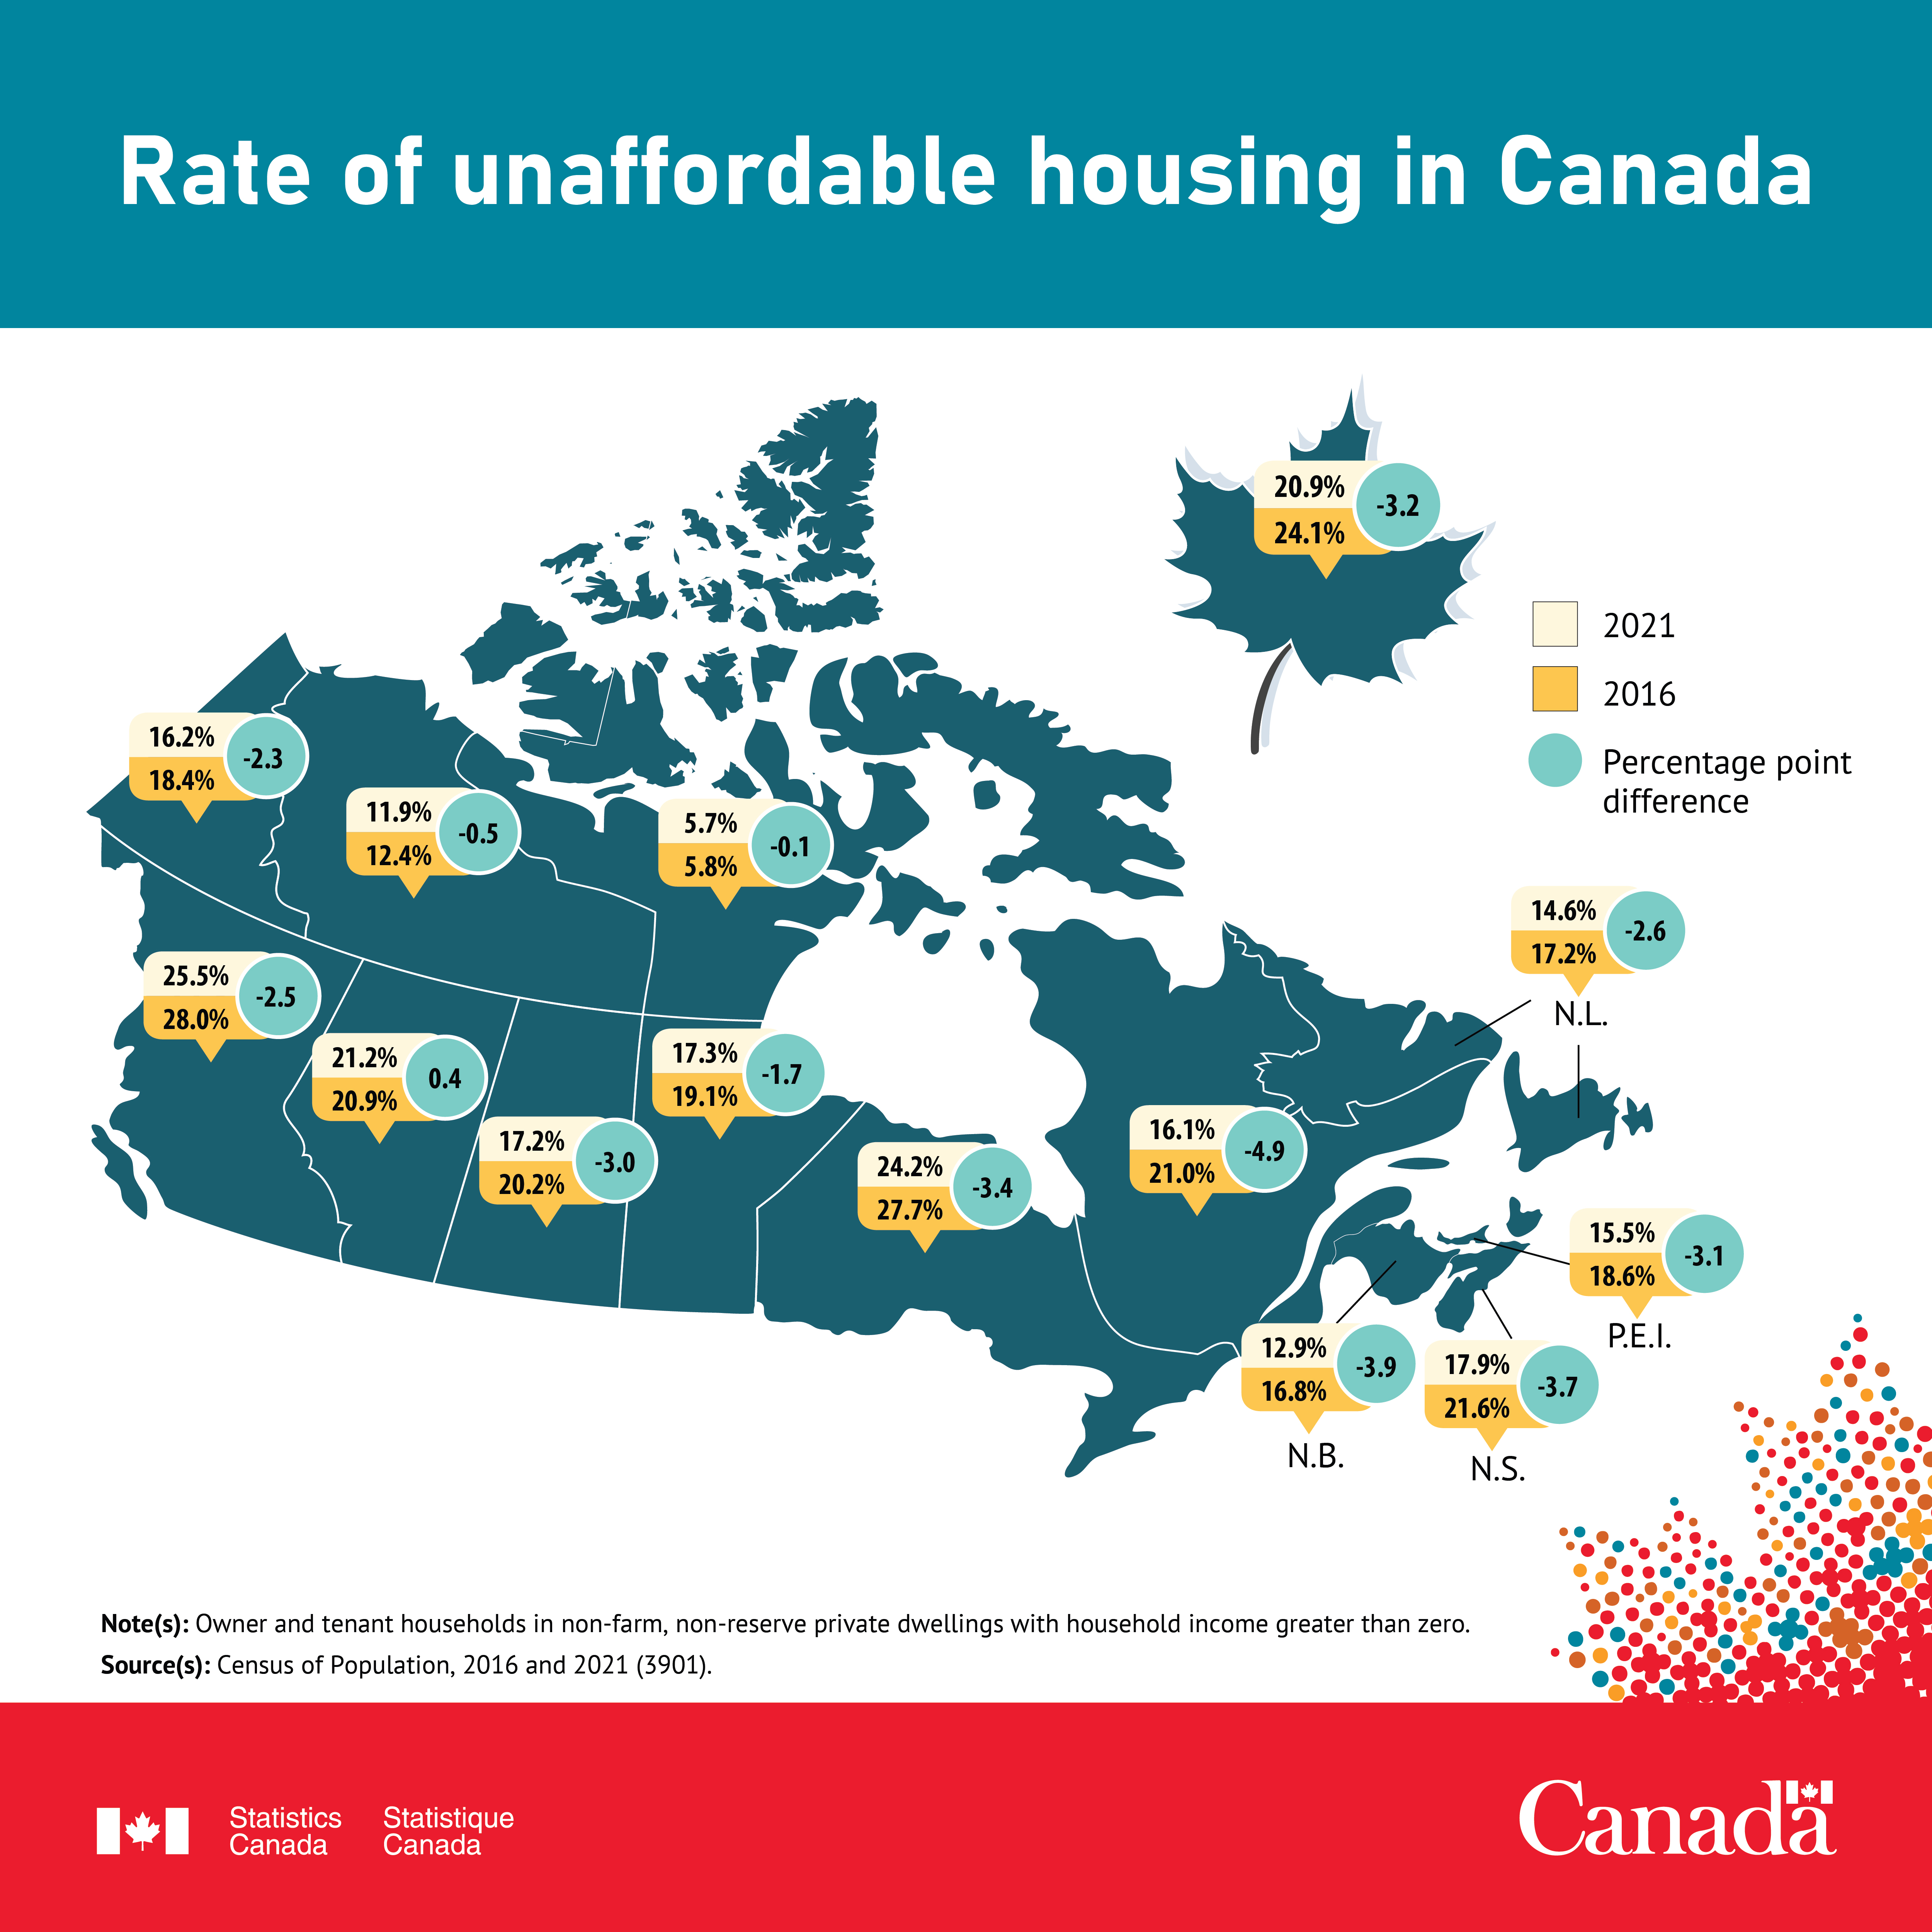
This is a map of Canada showing the unaffordable housing rate by province and territory in 2016 and 2021, and the change in the unaffordable housing rate from 2016 to 2021.
In Canada, the unaffordable housing rate in 2021 was 20.9%, and it fell 3.2 percentage points from 24.1% in 2016.
In Newfoundland and Labrador, the unaffordable housing rate in 2021 was 14.6%, and it fell 2.6 percentage points from 17.2% in 2016.
In Prince Edward Island, the unaffordable housing rate in 2021 was 15.5%, and it fell 3.1 percentage points from 18.6% in 2016.
In Nova Scotia, the unaffordable housing rate in 2021 was 17.9%, and it fell 3.7 percentage points from 21.6% in 2016.
In New Brunswick, the unaffordable housing rate in 2021 was 12.9%, and it fell 3.9 percentage points from 16.8% in 2016.
In Quebec, the unaffordable housing rate in 2021 was 16.1%, and it fell 4.9 percentage points from 21.0% in 2016.
In Ontario, the unaffordable housing rate in 2021 was 24.2%, it fell 3.4 percentage points from 27.7% in 2016.
In Manitoba, the unaffordable housing rate in 2021 was 17.3%, and it fell 1.7 percentage points from 19.1% in 2016.
In Saskatchewan, the unaffordable housing rate in 2021 was 17.2%, it fell 3.0 percentage points from 20.2% in 2016.
In Alberta, the unaffordable housing rate in 2021 was 21.2%, and it rose 0.4 percentage points from 20.9% in 2016.
In Yukon, the unaffordable housing rate in 2021 was 16.2%, and it fell 2.3 percentage points from 18.4% in 2016.
In the Northwest Territories, the unaffordable housing rate in 2021 was 11.9%, and it fell 0.5 percentage points from 12.4% in 2016.
In Nunavut, the unaffordable housing rate in 2021 was 5.7%, and it fell 0.1 percentage points from 5.8% in 2016.
Note(s): Owner and tenant households in non-farm, non-reserve private dwellings with household income greater than zero.
Suggested text:
New #2021Census data show that Ontario and British Columbia have the highest rates of unaffordable housing in the country.
Learn more about housing in Canada: https://bit.ly/3xrvWUs
Post 4
Share the news on Instagram. Create your own Instagram story using this downloadable image. Don't forget to add census stickers by searching "2021 Census" in the stickers search bar.
Web Images

Terms of use
See the terms of use for information on the approved use of official wordmarks, identifiers and content.