
Help spread the word about 2021 census data on immigration, place of birth, and citizenship in Canada. These data were released on October 26, 2022.
Quick facts
- Almost 1 in 4 people (23.0%) counted during the 2021 Census are or have been a landed immigrant or permanent resident in Canada. This was the highest proportion since Confederation, topping the previous record of 22.3% in 1921, and the largest proportion among G7 countries.
- Just over 1.3 million new immigrants settled permanently in Canada from 2016 to 2021, the highest number of recent immigrants recorded in a Canadian census.
- The share of recent immigrants settling in Atlantic Canada almost tripled in 15 years, rising from 1.2% in 2006 to 3.5% in 2021.
- Over half of recent immigrants living in Canada were admitted under the economic category. Of these 748,120 economic immigrants, just over one-third (34.5%) were selected through skilled worker programs and another one-third (33.6%) through the Provincial Nominee Program.
- The proportion of immigrants who first came to Canada temporarily on work or study permits or as asylum claimants before being admitted as permanent residents was especially high among recent immigrants who settled since 2016 (36.6%).
- Asia, including the Middle East, remained the continent of birth for most recent immigrants (62.0%).
- Almost one in five recent immigrants (18.6%) were born in India, making it the leading country of birth for recent immigration to Canada.
- In contrast, the share of recent immigrants from Europe continued to decline, falling from 61.6% in 1971 to 10.1% in 2021.
- The vast majority (92.7%) of recent immigrants are able to conduct a conversation in either English or French.
- The share of second-generation Canadians (children of immigrants) younger than 15 years with at least one foreign-born parent rose from 26.7% in 2011 to 31.5% in 2021.
Resources
Social media content
Statistics Canada encourages our community supporters to share our content and images to their own social media accounts. You can save the images to your device and copy and paste the text content to your social media platforms.
Post 1
Alt text / description - Post 1 image
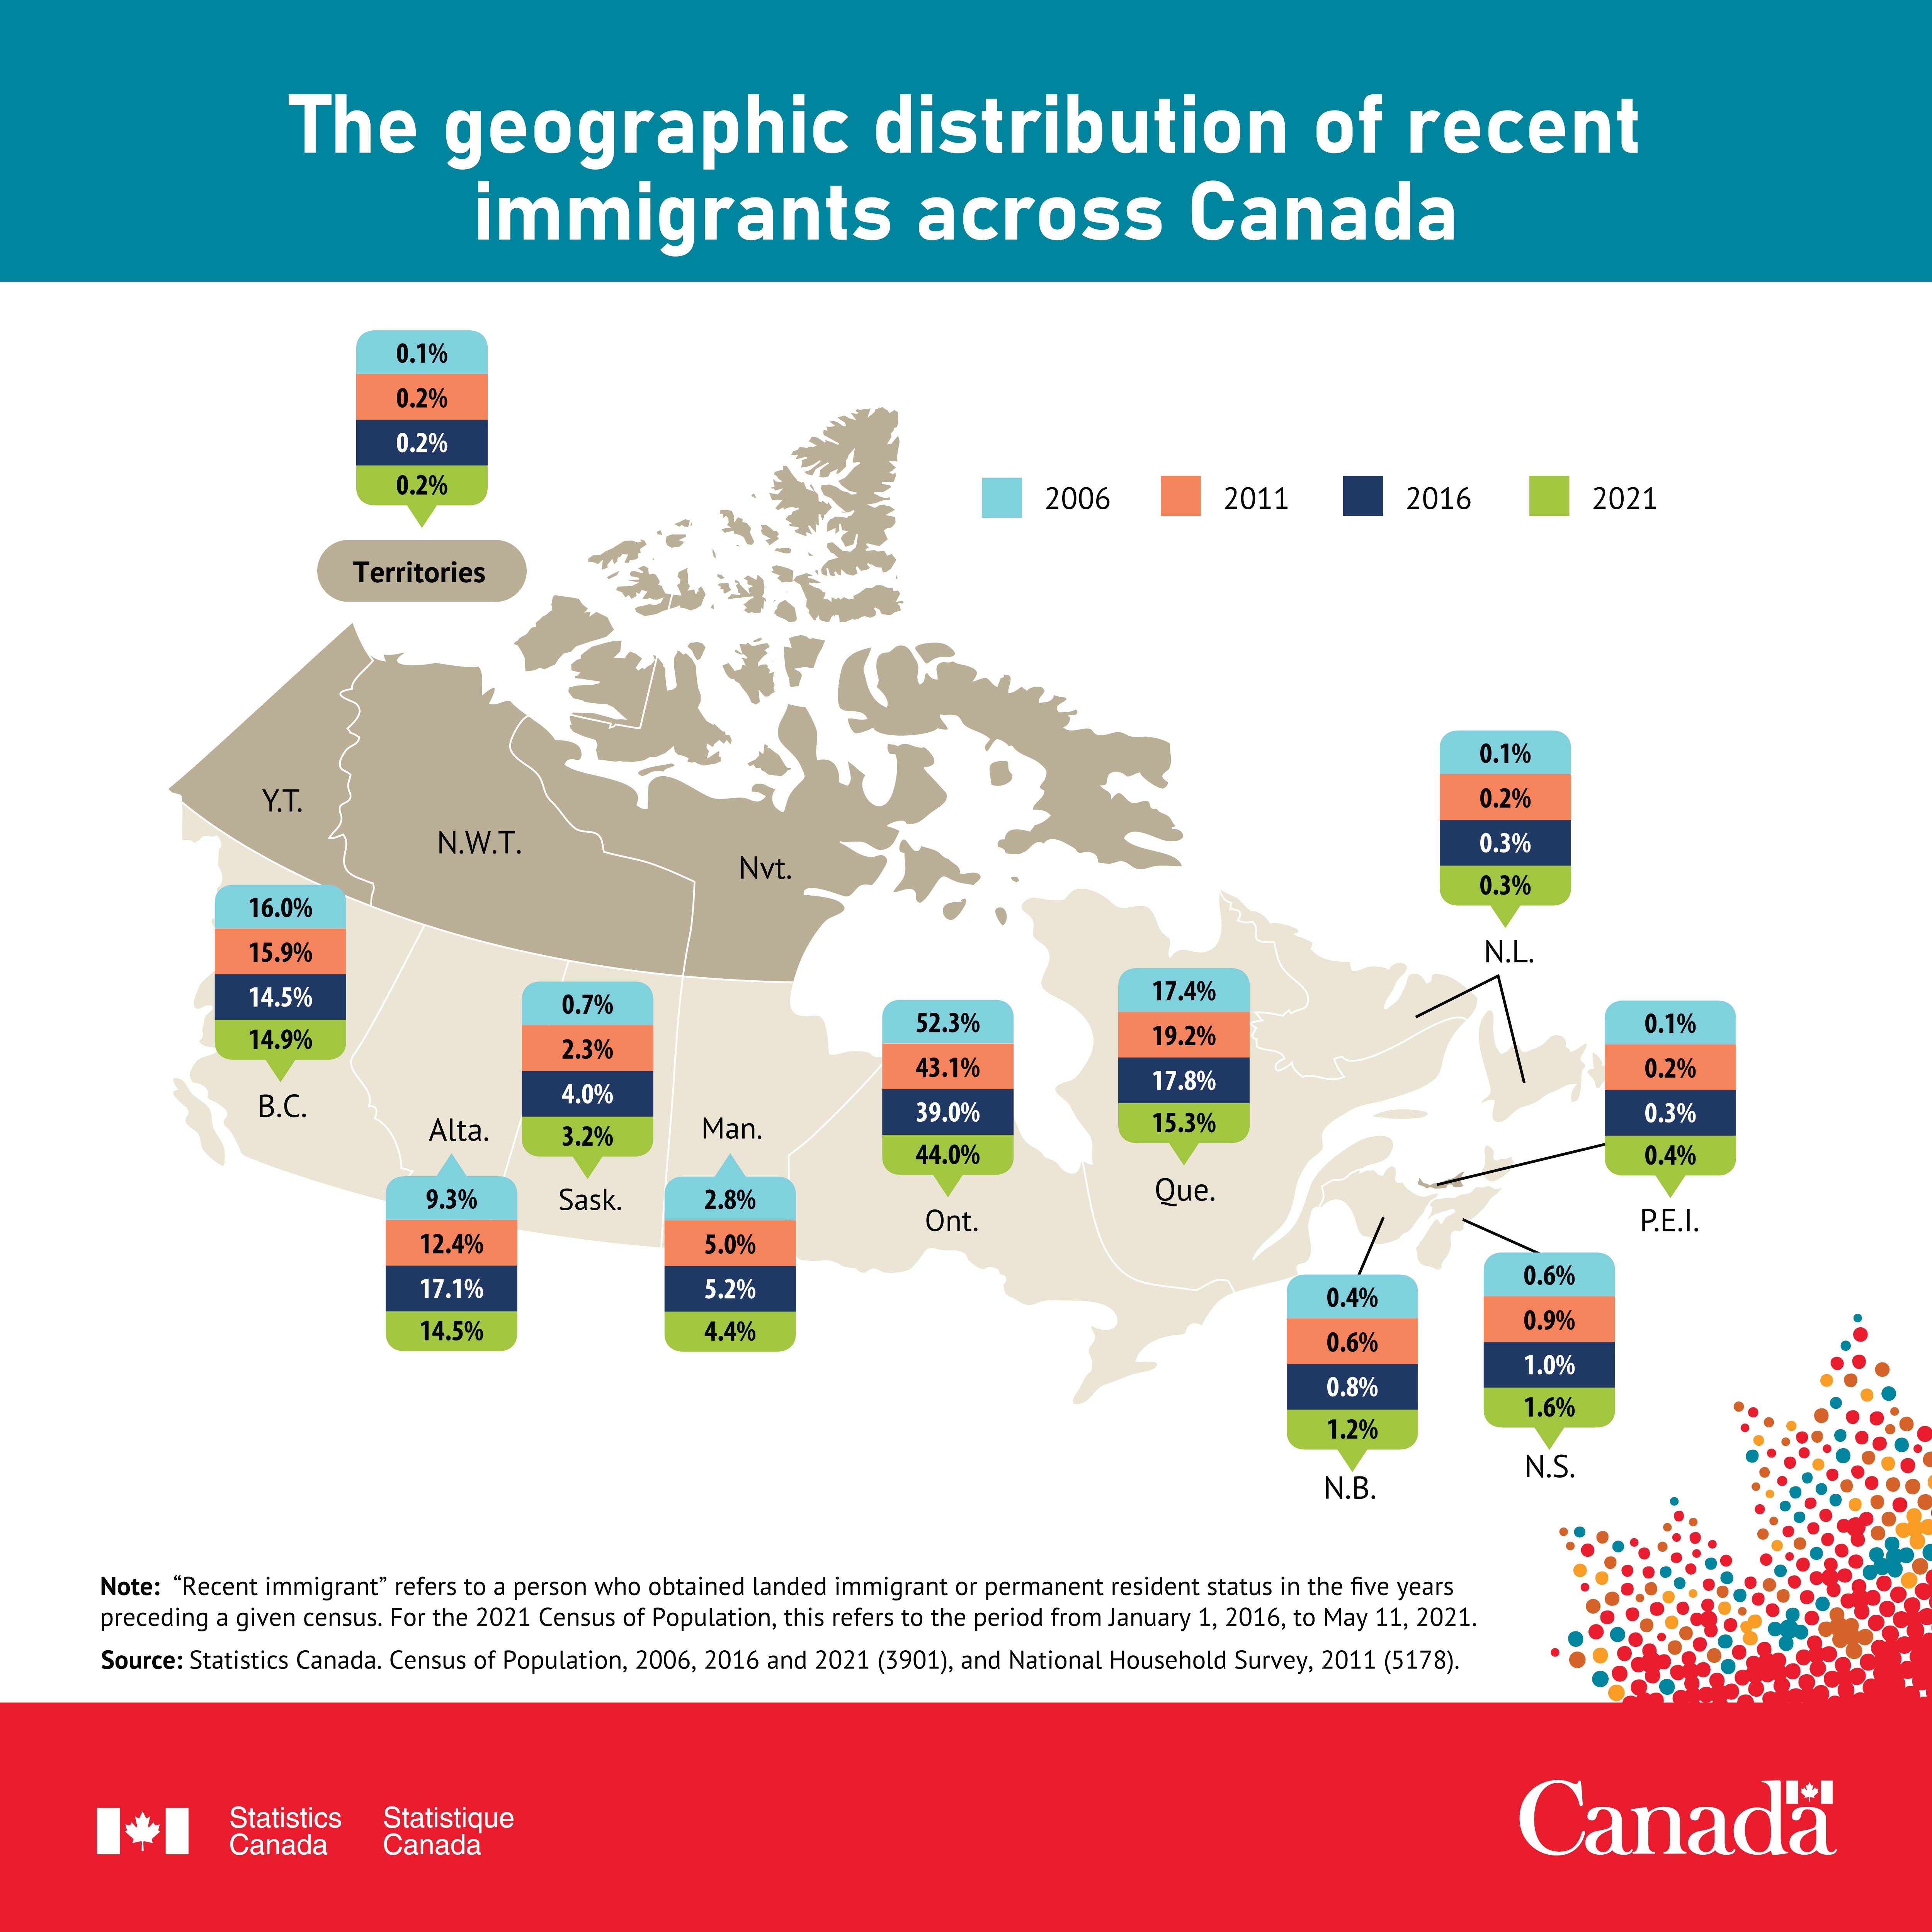
The geographic distribution of recent immigrants across Canada
This is a map of Canada showing the share of recent immigrants by province and territory in 2006, 2011, 2016 and 2021.
In 2021, the proportion of recent immigrants in Newfoundland and Labrador was 0.3%. The proportion of recent immigrants in Newfoundland and Labrador was 0.3% in 2016; 0.2% in 2011; and 0.1% in 2006.
In 2021, the proportion of recent immigrants in Prince Edward Island was 0.4%. The proportion of recent immigrants in Prince Edward Island was 0.3% in 2016; 0.2% in 2011; and 0.1% in 2006.
In 2021, the proportion of recent immigrants in Nova Scotia was 1.6%. The proportion of recent immigrants in Nova Scotia was 1.0% in 2016; 0.9% in 2011; and 0.6% in 2006.
In 2021, the proportion of recent immigrants in New Brunswick was 1.2%. The proportion of recent immigrants in New Brunswick was 0.8% in 2016; 0.6% in 2011; and 0.4% in 2006.
In 2021, the proportion of recent immigrants in Quebec was 15.3%. The proportion of recent immigrants in Quebec was 17.8% in 2016; 19.2% in 2011; and 17.4% in 2006.
In 2021, the proportion of recent immigrants in Ontario was 44.0%. The proportion of recent immigrants in Ontario was 39.0% in 2016; 43.1% in 2011; and 52.3% in 2006.
In 2021, the proportion of recent immigrants in Manitoba was 4.4%. The proportion of recent immigrants in Manitoba was 5.2% in 2016; 5.0% in 2011; and 2.8% in 2006.
In 2021, the proportion of recent immigrants in Saskatchewan was 3.2%. The proportion of recent immigrants in Saskatchewan was 4.0% in 2016; 2.3% in 2011; and 0.7% in 2006.
In 2021, the proportion of recent immigrants in Alberta was 14.5%. The proportion of recent immigrants in Alberta was 17.1% in 2016; 12.4% in 2011; and 9.3% in 2006.
In 2021, the proportion of recent immigrants in British Columbia was 14.9%. The proportion of recent immigrants in British Columbia was 14.5% in 2016; 15.9% in 2011; and 16.0% in 2006.
In 2021, the proportion of recent immigrants in the Territories (Yukon, the Northwest Territories and Nunavut) was 0.2%. The proportion of recent immigrants in the territories was 0.2% in 2016; 0.2% in 2011; and 0.1% in 2006.
Note(s): "Recent immigrant" refers to a person who obtained landed immigrant or permanent resident status in the five years preceding a given census. For the 2021 Census of Population, this refers to the period from January 1, 2016, to May 11, 2021.
Source(s): Census of Population, 2006, 2016 and 2021 (3901), and National Household Survey, 2011 (5178).
Suggested text:
The Atlantic provinces welcomed higher shares of recent immigrants in Canada than in previous censuses, while Quebec and the Prairies saw their shares decrease.
Read more about the #2021Census data:
bit.ly/3TFCeIP
Post 2
Alt text / description - Post 2 image
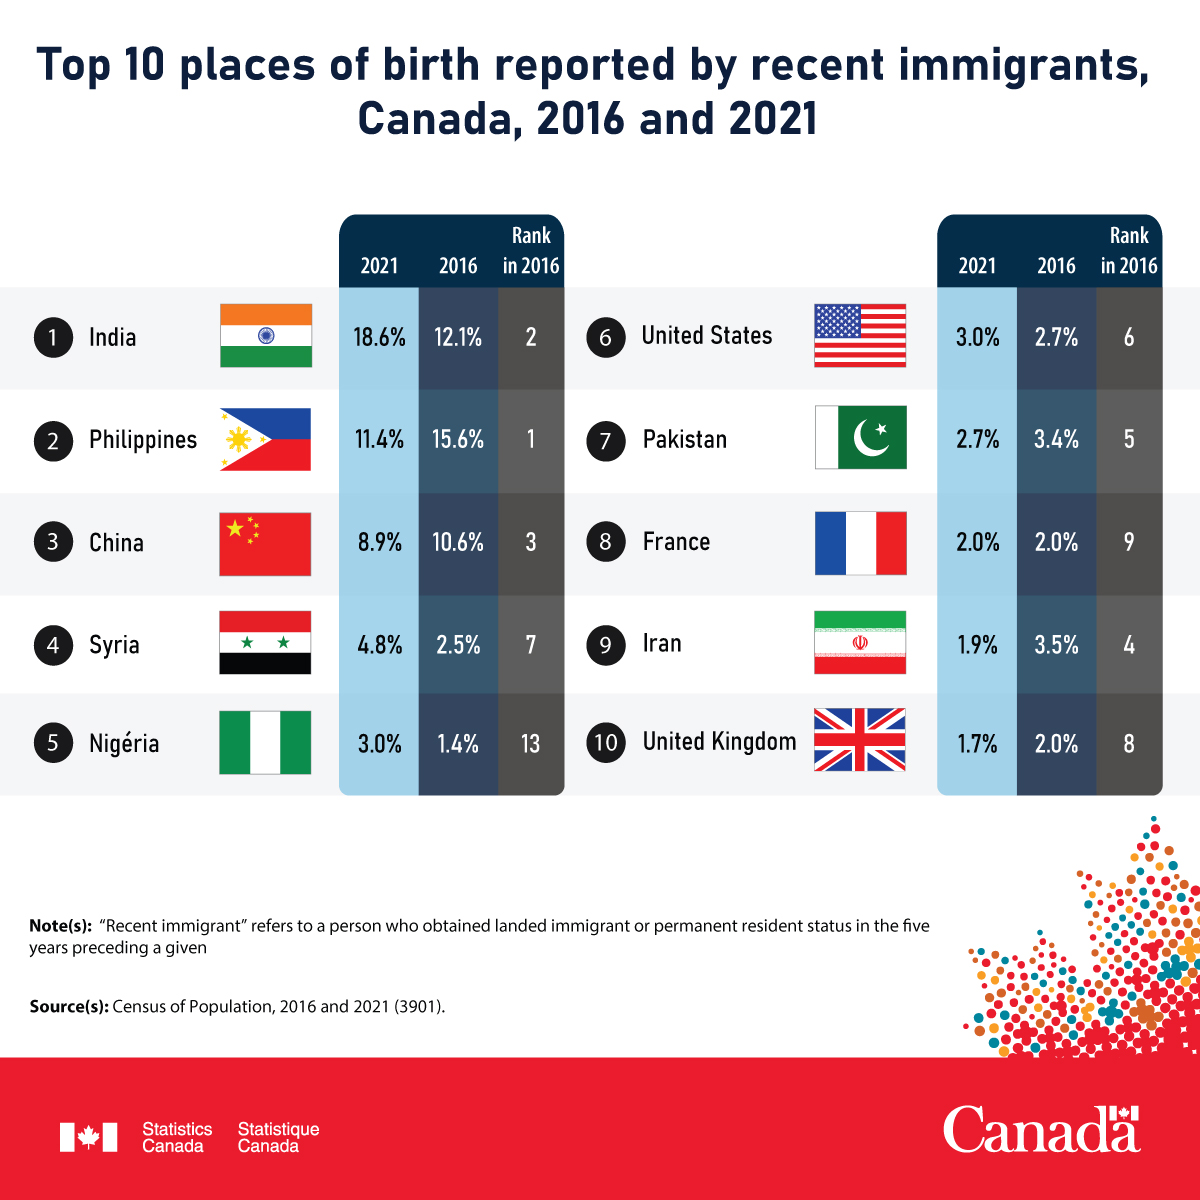
Top 10 places of birth reported by recent immigrants, Canada, 2016 and 2021
This is an image that ranks the top 10 places of birth based on the share of recent immigrants from the 2021 Census, including the flag of place of birth, the share of recent immigrants from that place of birth in 2021 and 2016, and its rank for 2016.
The most frequently reported place of birth by recent immigrants in 2021 was India, with 18.6% of recent immigrants in 2021. In 2016, 12.1% of recent immigrants reported India as their place of birth. India was the second most frequent place of birth reported on the census in 2016.
The second most frequently reported place of birth by recent immigrants in 2021 was the Philippines, with 11.4% of recent immigrants in 2021. In 2016, 15.6% of recent immigrants reported the Philippines as their place of birth. Philippines was the most frequent place of birth reported on the census in 2016.
The third most frequently reported place of birth by recent immigrants in 2021 was China, with 8.9% of recent immigrants in 2021. In 2016, 10.6% of recent immigrants reported China as their place of birth. China was the third most frequent place of birth reported on the census in 2016.
The fourth most frequently reported place of birth by recent immigrants in 2021 was Syria, with 4.8% of recent immigrants in 2021. In 2016, 2.5% of recent immigrants reported Syria as their place of birth. Syria was the seventh most frequent place of birth reported on the census in 2016.
The fifth most frequently reported place of birth by recent immigrants in 2021 was Nigeria, with 3.0% of recent immigrants in 2021. In 2016, 1.4% of recent immigrants reported Nigeria as their place of birth. Nigeria was the 13th most frequent place of birth reported on the census in 2016.
The sixth most frequently reported place of birth by recent immigrants in 2021 was the United States, with 3.0% of recent immigrants in 2021. In 2016, 2.7% of recent immigrants reported the United States as their place of birth. The United States was the sixth most frequent place of birth reported on the census in 2016.
The seventh most frequently reported place of birth by recent immigrants in 2021 was Pakistan, with 2.7% of recent immigrants in 2021. In 2016, 3.4% of recent immigrants reported Pakistan as their place of birth. Pakistan was the fifth most frequent place of birth reported on the census in 2016.
The eighth most frequently reported place of birth by recent immigrants in 2021 was France, with 2.0% of recent immigrants in 2021. In 2016, 2.0% of recent immigrants reported France as their place of birth. France was the ninth most frequent place of birth reported on the census in 2016.
The ninth most frequently reported place of birth by recent immigrants in 2021 was Iran, with 1.9% of recent immigrants in 2021. In 2016, 3.5% of recent immigrants reported Iran as their place of birth. Iran was the fourth most frequent place of birth reported on the census in 2016.
The 10th most frequently reported place of birth by recent immigrants in 2021 was the United Kingdom, with 1.7% of recent immigrants in 2021. In 2016, 2.0% of recent immigrants reported the United Kingdom as their place of birth. United Kingdom was the eighth most frequent place of birth reported on the census in 2016.
Note(s): "Recent immigrant" refers to a person who obtained landed immigrant or permanent resident status in the five years preceding a given census. For the 2021 Census of Population, this refers to the period from January 1, 2016, to May 11, 2021.
Source(s): Census of Population, 2016 and 2021 (3901).
Suggested text:
Just over 1.3 million new immigrants settled permanently in Canada from 2016 to 2021, the highest number of recent immigrants recorded in a Canadian census.
For more info from the #2021Census:
bit.ly/3TFCeIP
Web Images

Terms of use
See the terms of use for information on the approved use of official wordmarks, identifiers and content.