
Help spread the word about 2021 Census data on income in Canada. These data were released on July 13, 2022.
Quick facts
- The median household after-tax income in Canada was $73,000 in 2020.
- The proportion of Canadians receiving employment income fell in most provinces and territories. Some provinces and territories reported higher median employment income in 2020 as lower-earning jobs disappeared.
- Household after-tax income growth accelerated from 2015 to 2020, particularly among families with children, driven by increases in government transfers.
- From 2015 to 2020, income inequality fell in all provinces and territories, with Alberta recording the largest decline.
- The low-income rate fell in 2020, especially for families with children, but less for seniors and people living alone.
Resources
Social media content
Statistics Canada encourages our community supporters to:
- Share and amplify our social media content about the 2021 Census.
- Make your own posts with downloadable images and text.


Post 1
Alt text / description - Post 1 image
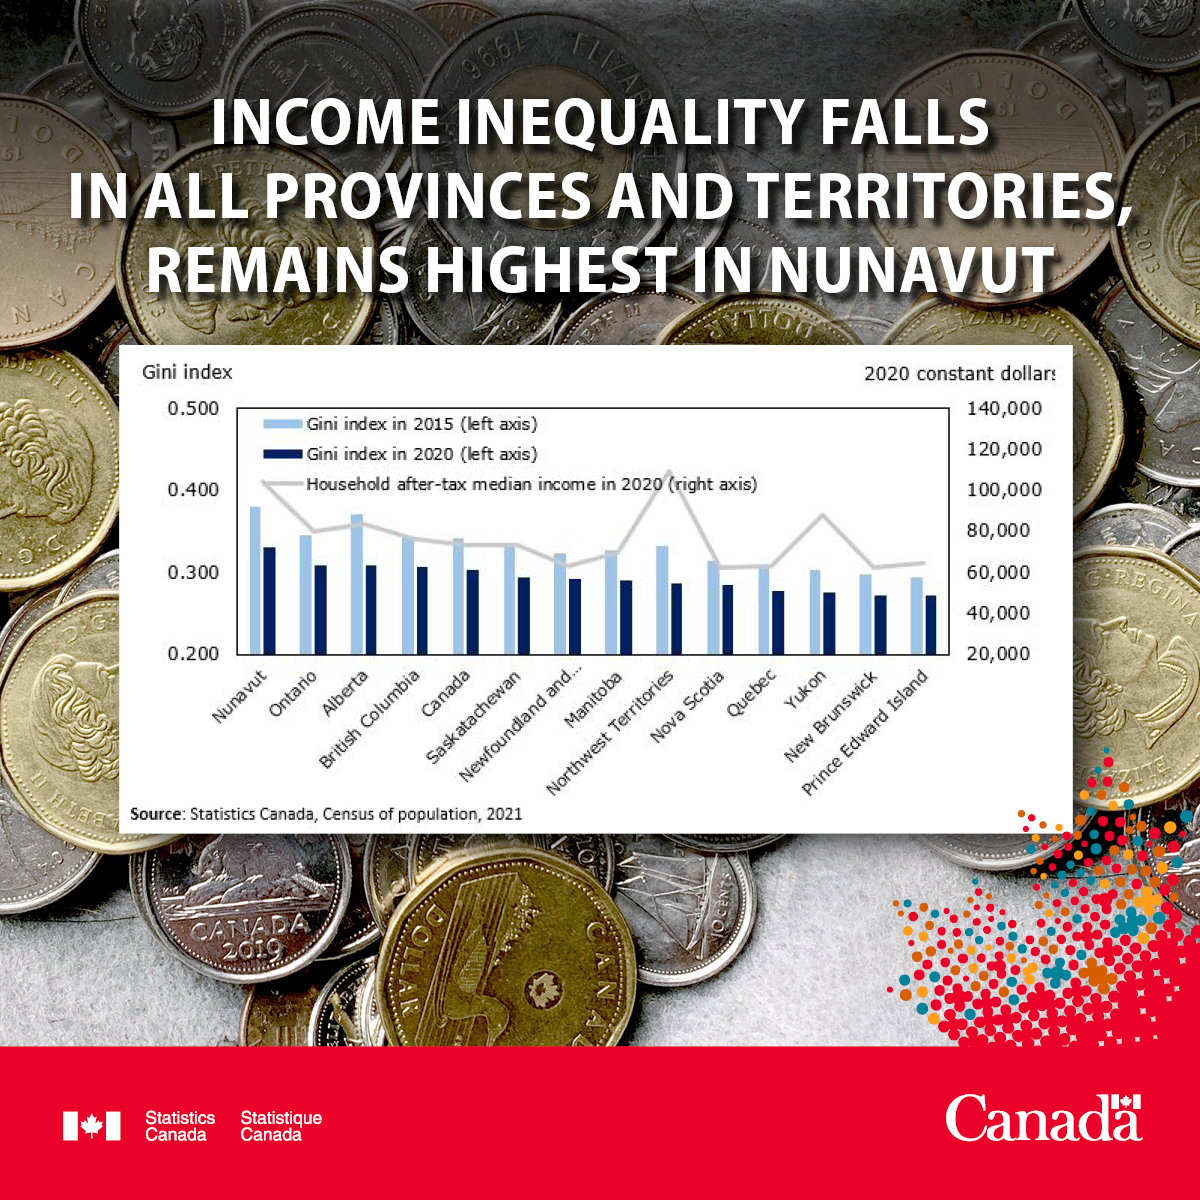
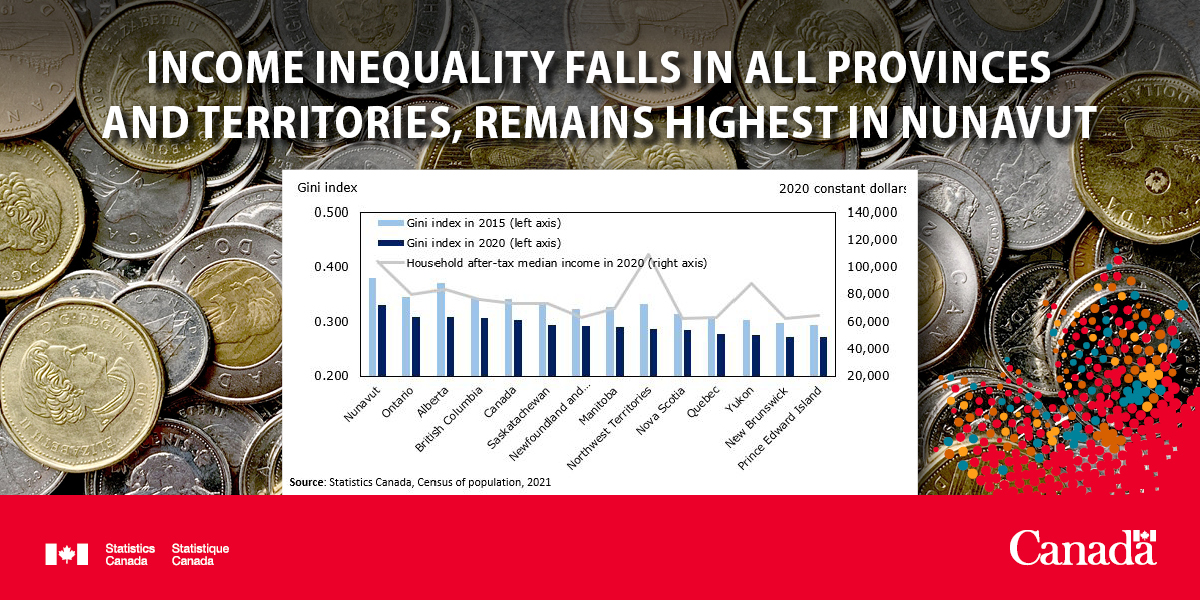
The title of the infographic is "Income inequality falls in all provinces and territories, remains highest in Nunavut"
This is a combination bar chart and line graph.
The vertical axis to the left shows the Gini index from 0.200 to 0.500, by increments 0.1.
The vertical axis to the right shows 2020 constant dollars from 20,000 to 140,000 , by increments of 20,000.
The horizontal axis shows all the provinces and territories in Canada, including a bar showing Canada's average.
The first set of bars represents the Gini index in 2015, with Nunavut at 0.379, Ontario at 0.344, Alberta at 0.371, British Columbia at 0.343, Canada at 0.342, Saskatchewan at 0.331, Newfoundland and Labrador at 0.323, Manitoba at 0.328, Northwest Territories at 0.332, Nova Scotia at 0.314, Quebec at 0.307, Yukon at 0.302, New Brunswick at 0.298, and Prince Edward Island at 0.294.
The second set of bars represents the Gini index in 2020, with Nunavut at 0.331, Ontario at 0.308, Alberta at 0.307, British Columbia at 0.306, Canada at 0.302, Saskatchewan at 0.293, Newfoundland and Labrador at 0.29, Manitoba at 0.29, Northwest Territories at 0.287, Nova Scotia at 0.282, Quebec at 0.28, Yukon at 0.275, New Brunswick at 0.272, and Prince Edward Island at 0.271.
The line represents household after-tax median income in 2020 ($). The points show Nunavut with $104,000, Ontario with $79,500, Alberta with $83,000, British Columbia with $76,000, Canada with $73,000, Saskatchewan with $73,000, Newfoundland and Labrador with $63,200, Manitoba with $69,000, Northwest Territories with $109,000, Nova Scotia with $62,400, Quebec with $63,200, Yukon with $88,000, New Brunswick with $62,000, and Prince Edward Island with $64,000.
Source(s): Census of Population, 2016 and 2021 (3901).
Did you know that income inequality fell from 2015 to 2020 in all provinces and territories? Learn more about newly released income data from the #2021Census: https://bit.ly/3nRBN0j
Post 2
Alt text / description - Post 2 image
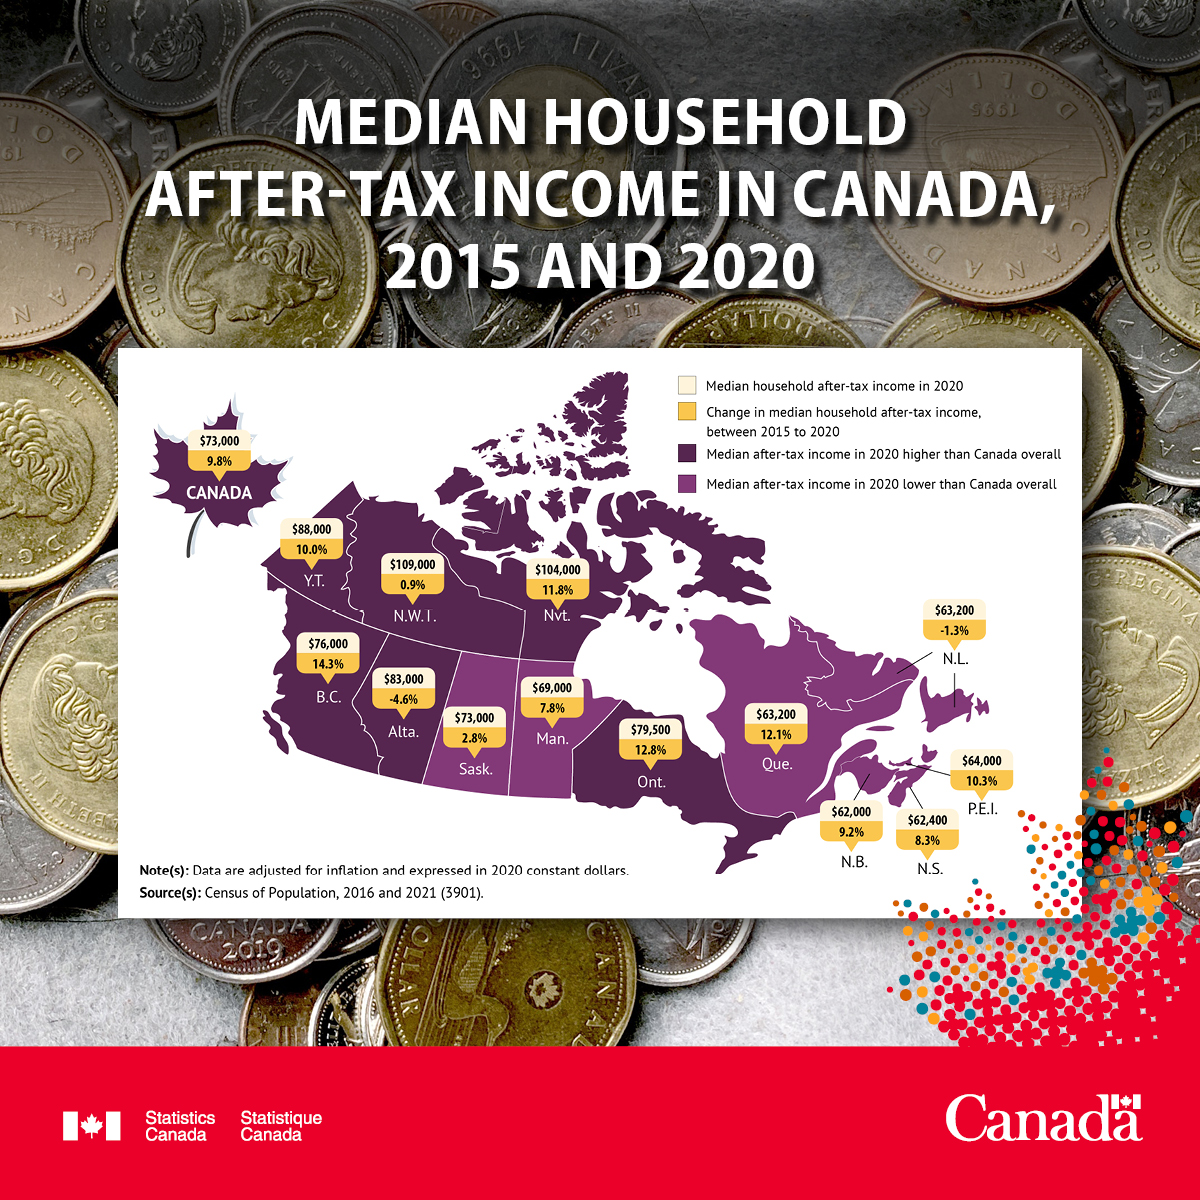
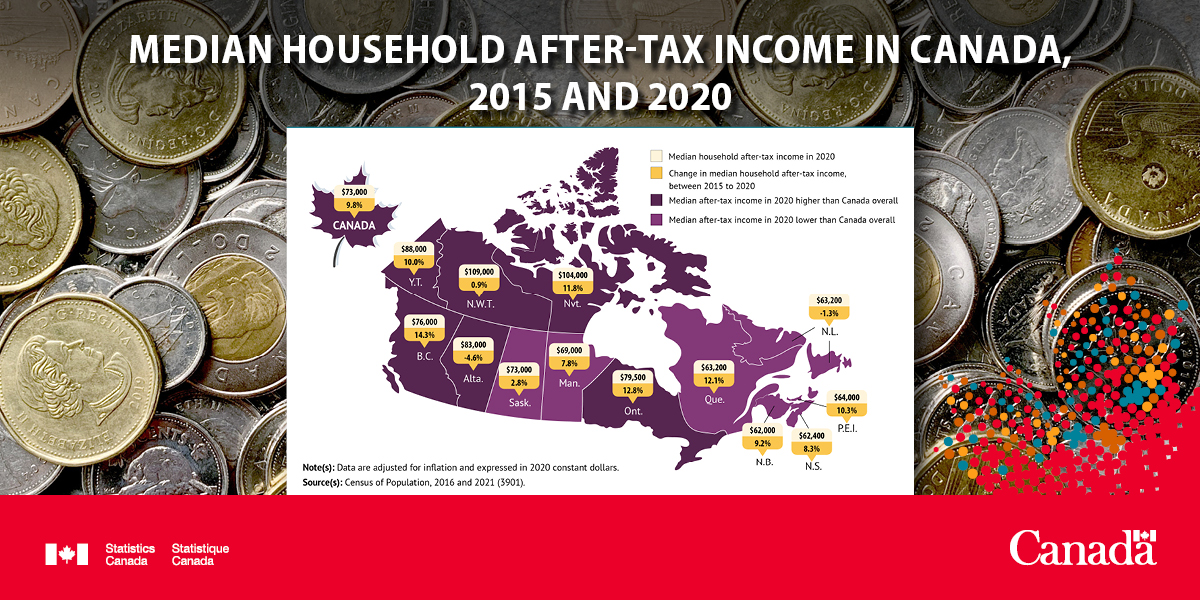
The title of the map is "Median household after-tax income in Canada, 2015 and 2020"
This is a map of Canada by province and territory showing the median household after-tax income in 2020 and the change in the median household after-tax income between 2015 and 2020.
The map also highlights provinces and territories where the median household after-tax income in 2020 was below the national average, and where the median household after-tax income in 2020 was above the national average.
The median household after-tax income in 2020 was below the national average in Newfoundland and Labrador, Prince Edward Island, Nova Scotia, New Brunswick, Quebec, Manitoba and Saskatchewan. It was above the national average in Ontario, Alberta, British Columbia, Yukon, Northwest Territories, and Nunavut.
In Canada, the median household after-tax income in 2020 was $73,000, and the change in the median household after-tax income between 2015 and 2020 was 9.8%.
In Newfoundland and Labrador, the median household after-tax income in 2020 was $63,2000, and the change in the median household after-tax income between 2015 and 2020 was -1.3%.
In Prince Edward Island, the median household after-tax income in 2020 was $64,000, and the change in the median household after-tax income between 2015 and 2020 was 10.3%.
In Nova Scotia, the median household after-tax income in 2020 was $62,400, and the change in the median household after-tax income between 2015 and 2020 was 8.3%.
In New Brunswick, the median household after-tax income in 2020 was $62,000, and the change in the median household after-tax income between 2015 and 2020 was 9.2%.
In Quebec, the median household after-tax income in 2020 was $63,200, and the change in the median household after-tax income between 2015 and 2020 was 12.1%.
In Ontario, the median household after-tax income in 2020 was $79,500, and the change in the median household after-tax income between 2015 and 2020 was 12.8%.
In Manitoba, the median household after-tax income in 2020 was $69,000, and the change in the median household after-tax income between 2015 and 2020 was 7.8%.
In Saskatchewan, the median household after-tax income in 2020 was $73,000, and the change in the median household after-tax income between 2015 and 2020 was 2.8%.
In Alberta, the median household after-tax income in 2020 was $83,000, and the change in the median household after-tax income between 2015 and 2020 was -4.6%.
In British Columbia, the median household after-tax income in 2020 was $76,000, and the change in the median household after-tax income between 2015 and 2020 was 14.3%.
In Yukon, the median household after-tax income in 2020 was $88,000, and the change in the median household after-tax income between 2015 and 2020 was 10.0%.
In the Northwest Territories, the median household after-tax income in 2020 was $109,000, and the change in the median household after-tax income between 2015 and 2020 was 0.9%.
In Nunavut, the median household after-tax income in 2020 was $104,000, and the change in the median household after-tax income between 2015 and 2020 was 11.8%.
Note(s): Data are adjusted for inflation and expressed in 2020 constant dollars.
Source(s): Census of Population, 2016 and 2021 (3901).
The median household after-tax income in Canada was $73,000 in 2020. Find out the median income for your region in the newly released #2021Census data: https://bit.ly/3z7pUd7
Post 3

Share the news on Instagram. Create your own Instagram story using this downloadable image. Don't forget to add census stickers by searching "2021 Census" in the stickers search bar.
Web images

Terms of use
See the Census engagement toolkits—Terms of use for information on the approved use of official wordmarks, identifiers and content.