
Exploring the Modgen application RiskPaths
The user interface
Parameter tables
Performing a simulation run
Table output: aggregates and distributions
Model help and documentation
Graphical output of individual histories
In the remainder of this discussion we provide a quick explorative tour of the visual interface provided by Modgen for the RiskPaths model. To run RiskPaths, both the Modgen Prerequisites application and the RiskPaths executable have to be installed on your computer. As is true for all Modgen applications, RiskPaths contains a help system including documentation on the (model-independent) Modgen user interface and the actual RiskPaths model itself. Accordingly, in the description below, we concentrate on the central steps of running RiskPaths, leaving it to you to explore the model and software in depth with the assistance of the detailed help files.
The user interface
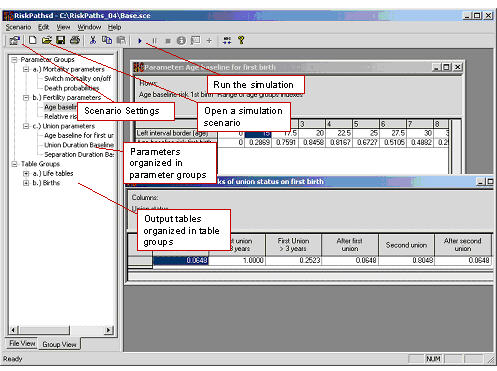
All Modgen applications have the same graphical user interface (Figure 1) which consists of the following parts:
- a menu bar and a toolbar to administer and run scenarios, as well as to get help
- a selection window containing a hierarchically grouped list of all model parameters and output tables
- a frame in which all corresponding parameters or tables can be displayed
When starting the RiskPaths.exe application, the selection window and table frame are empty, as we first have to load (or create) a simulation scenario. To do so, follow the following steps:
- Open the simulation scenario 'base.sce'. This can be done by clicking the 'Open' button or by selecting 'Open.' from the 'Scenario' menu.
- Choose the scenario settings--the settings dialog box can be accessed by clicking the 'Settings' button or by selecting 'Settings.' from the 'Scenario' menu. Specify a small number of simulated cases (e.g.10,000) so that your first model runs quickly. Also, ensure that 'MS Access tracking' is switched on. This will allow you to view individual biographies using the BioBrowser tool that comes with Modgen
- Save your scenario under a new name by selecting 'Save as.' from the 'Scenario' menu.
Parameter tables
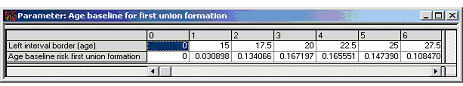
Users of a Modgen application have control over all parameters contained in the model's parameter tables. An individual parameter table can be selected by clicking its list entry in the selection window. The table is then displayed in the display frame in which it can also be edited. Modgen parameter tables can have any number of dimensions, ranging from a parameter with a single checkbox to parameters with numerous characteristics or dimensions (e.g.region, sex, age, time).
Performing a simulation run
Click the 'Run/resume' button or select 'Run/resume' from the 'Scenario' menu. The progress of the simulation is displayed in a progress dialog box. A small sample of 10,000 actors takes around 20 seconds to run. After the model run is complete, all output tables will have been updated by Modgen.
Table output: aggregates and distributions
Simulation results are written to predefined output tables. Note that the values displayed in the output table represent only one of several possible views on the results. By right-clicking a table, a properties sheet for the table can be accessed. Among other things, this allows the display of distributional information (standard errors and the coefficient of variation) of all simulated values. Table contents can also be copied and pasted. You have the choice to copy the table as displayed, or all dimensions of the table at once (if there are more than two dimensions).
Model help and documentation
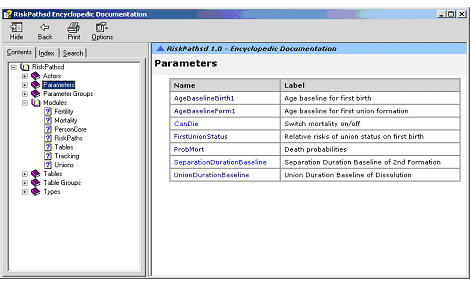
As is true with all Modgen applications, RiskPaths provides help files of various types. Two are related to Modgen itself--a general user guide for the visual interface plus release notes for Modgen. The other help files are model-specific. All Modgen applications contain a detailed encyclopaedic model documentation file. This documentation is automatically created from properly commented code.
Graphical output of individual histories
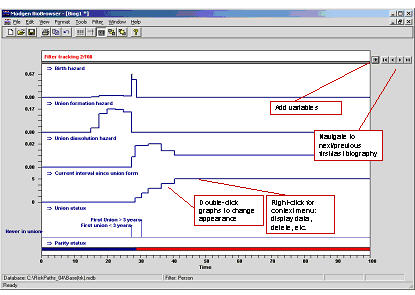
The Modgen Biography Browser (BioBrowser) application is a tool for the graphical display of individual life courses. This view on the simulation results is especially useful for model debugging. In order to use the tool, the tracking feature has to be switched on in the scenario settings. The list of variables to be tracked also has to be declared by the model developer in the model code via a tracking statement. Modgen than tracks all changes of those variables included in the tracking statement for a sample of simulated actors (where the size of this sample is specified as one of the scenario settings).
To display biographies created by RiskPaths, just start the BioBrowser application and load the tracking-file of your simulation scenario, e.g.Base(trk).mdb.
- Date modified: