
")
Source: Table 32-10-0098-01.
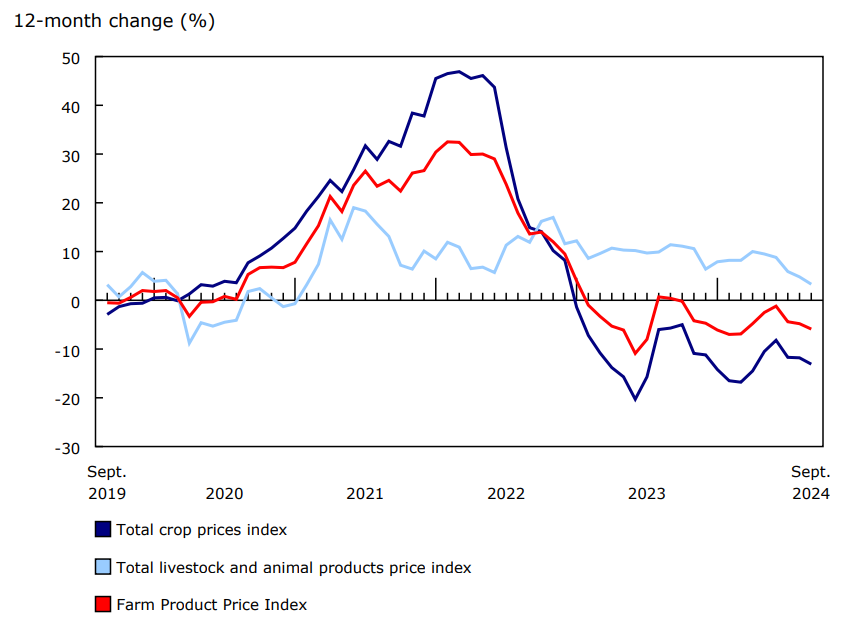
Chart 1: 12-month change in the Farm Product Price Index
Description - Chart 1: 12-month change in the Farm Product Price Index
Data table: 12-month change in the Farm Product Price Index
Source: Table 32-10-0098-01.
Lower prices for major grains and oilseeds lead to drop in the crops index
The crops index was down 13.1% in September, the second consecutive year-over-year decrease. The decline in the crops index was mainly attributable to lower prices for major grains, oilseeds and specialty crops.
In September, the grain index fell 22.9 compared with the same month one year earlier. The decline was driven by lower prices for all major grains, led by durum (-39.5%), barley (-25.1%) and corn (-23.6%). Competition from other exporting countries led to a drop in demand for Canadian grains. Canadian exports for most grains were lower in the first three quarters of 2024 compared with the same period in 2023.
The oilseeds index (-18.8%) also decreased in September 2024 compared with the same month one year earlier, owing to lower prices for canola (-19.8%) and soybeans (-17.1%). This marked the fifth consecutive month of year-over-year declines in the oilseeds index. Higher soybean production in the United States put downward pressure on oilseed prices in the 2024/2025 crop year.
In September, the specialty crops index (-6.9%) also reported a decline compared with September 2023. Prices were lower across all specialty crops in September 2024, led by chickpeas (-17.5%).
Meanwhile, the indexes for fresh fruit (+12.3%), fresh potatoes (+8.6%) and fresh vegetables (+2.0%) recorded gains, moderating the year-over-year decline in the crops index in September 2024.
The livestock and animal products index rises, supported by strong demand for cattle
In September, the livestock and animal products index increased 3.3% compared with the same month one year earlier. This marked the sixth consecutive year-over-year gain for the month of September.
The cattle and calves price index rose 6.7% from one year earlier in September. Cattle prices were supported by a smaller cattle herd and strong demand, including exports of live cattle. In the third quarter of 2024, both the value (+38.0%) and volume (+19.0%) of live cattle exported to the United States for immediate slaughter were up compared with the same quarter in 2023. The gain in the volume of cattle exported was largely driven by an increase in steers (+64.9%) and heifers (+8.9%) exported for immediate slaughter.
In September 2024, the hogs (+0.2%) and dairy (+3.7%) indexes reported gains compared with September 2023, while the poultry (-0.8%) and eggs (-0.4%) indexes both declined.
Table 1: Farm Product Price Index
Note to readers
For the latest information on the Census of Agriculture, visit the Census of Agriculture portal.
For more information on agriculture and food, visit the Agriculture and food statistics portal.
Reference
Data tables: 32-10-0098-01, 32-10-0099-01 and 32-10-0100-01.
- Note: some data tables may best be viewed on desktop.
Definitions, data sources and methods: survey number 5040
Previous release: Farm Product Price Index, June 2024
Contact information
For more information, or to enquire about the concepts, methods or data quality of this release, contact us (toll-free 1-800-263-1136; 514-283-8300; infostats@statcan.gc.ca) or Media Relations (statcan.mediahotline-ligneinfomedias.statcan@statcan.gc.ca).