

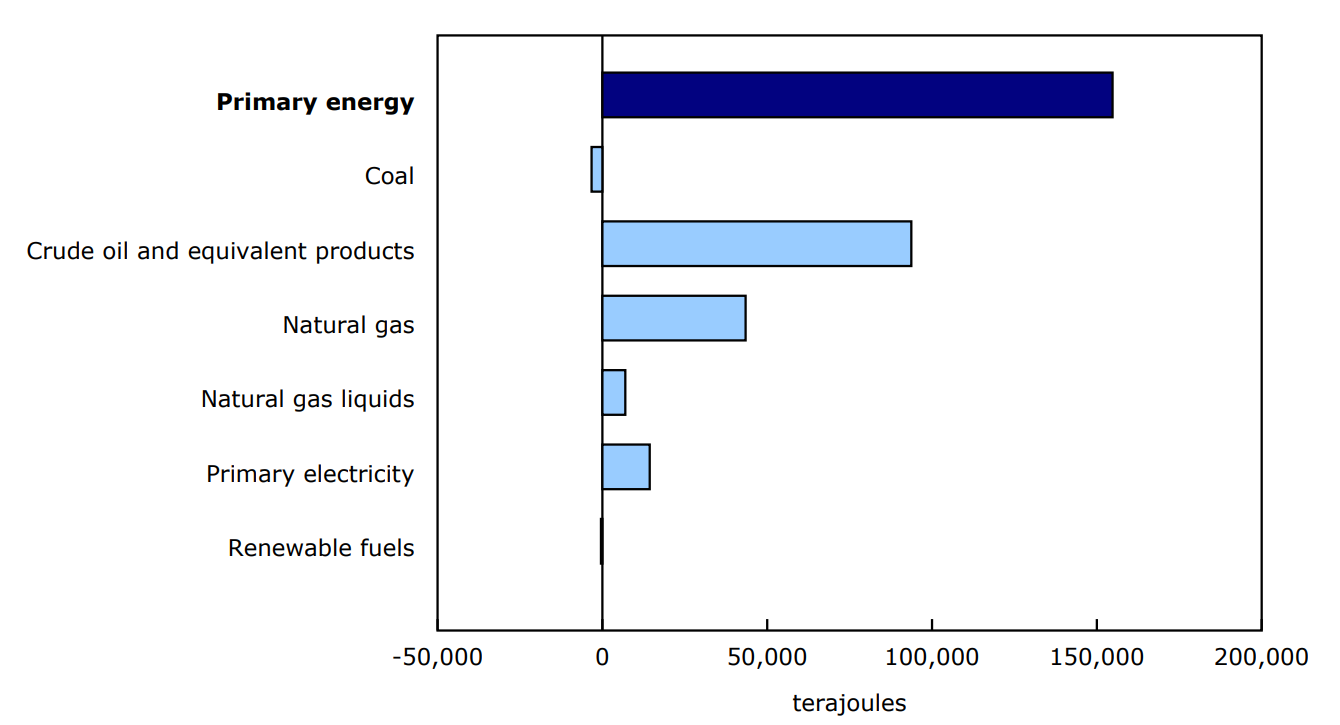
Canadian primary energy production had a strong start to 2025, recording a year-over-year increase of 7.8% to 2.1 million terajoules in January, the second-highest level since the series began in 2020.
Secondary energy production posted a year-over-year gain of 3.9% in January 2025, largely due to the increase in the refined petroleum products sector (+4.6%).
Chart 1: Year over year contribution to change in primary energy production
Description - Chart 1
Data table: Year over year contribution to change in primary energy production
Source: Table 25-10-0079-01.
The 2024 annual crude oil article (Another record year for Canadian crude oil: Crude oil year in review, 2024) is now available on StatsCAN Plus.
Crude oil production and exports continue to rise
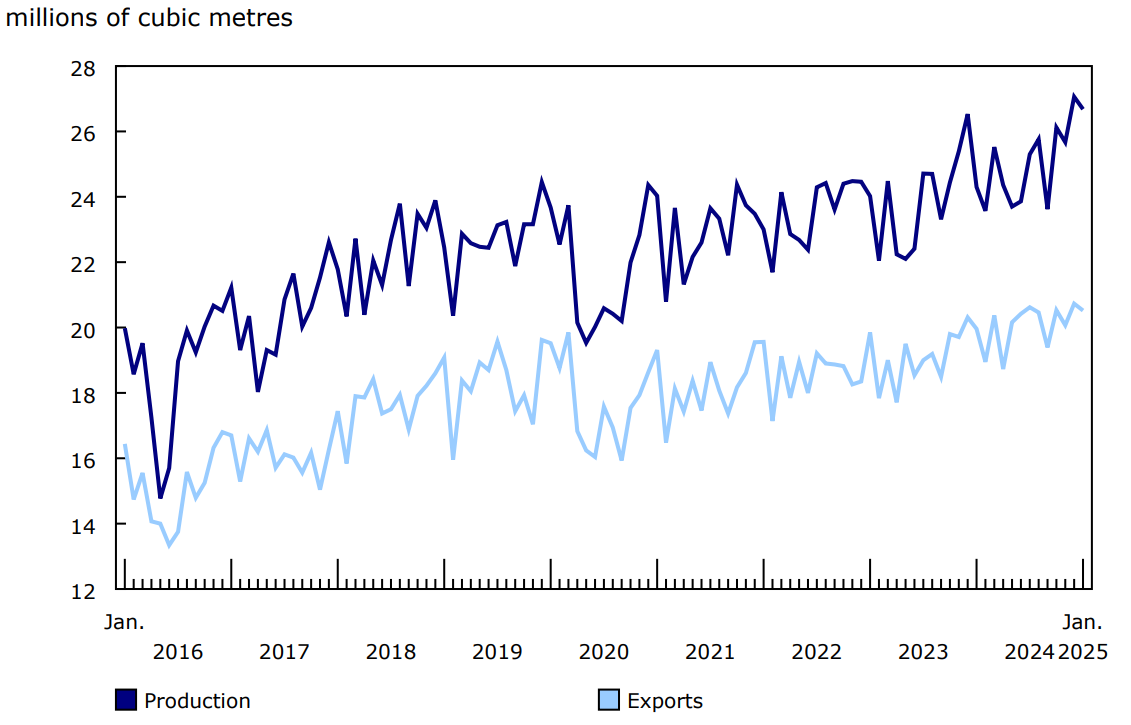
Production of crude oil and equivalent products rose 9.8% to 26.7 million cubic metres in January, the 16th consecutive monthly year-over-year increase and the largest increase in the same period. January 2025 production was largely uninterrupted compared with the same month one year earlier, when a cold snap in western Canada prompted some shut-ins at crude oil facilities.
The largest contribution to the overall gain in production came from oil sands, which rose 10.1% to 17.5 million cubic metres in January. Production of crude bitumen was up 8.9% to 10.5 million cubic metres, while production of synthetic crude reached a new record of 7.0 million cubic metres (+12.0%).
Oil extraction (light, medium and heavy crude oil) also contributed to the production increase in January, up 7.3% to 6.3 million cubic metres, returning to pre-COVID-19 pandemic production levels in December and January.
Exports of crude oil and equivalent products rose 2.8% year over year to 20.5 million cubic metres in January. The gain was driven by exports to countries other than the United States, which rose sharply in January (+263.0% to 1.1 million cubic metres) from lower levels observed in January 2024. The majority of these exports moved through the Trans Mountain pipeline and were loaded to ships in British Columbia. Exports to the United States by pipeline edged up 0.4% to 18.4 million cubic metres in January 2025.
Chart 2: Production and exports of crude oil and equivalent products
Description - Chart 2
Data table: Production and exports of crude oil and equivalent products
Source: Table 25-10-0063-01.
The newly expanded Trans Mountain pipeline began operation in May 2024, transporting crude oil and refined petroleum products from Edmonton, Alberta, to the port of Burnaby, British Columbia. This expansion nearly tripled the capacity of the existing line built in 1953, opening more Canadian crude oil for export to the global market. As a result, year-over-year rates of change are expected to be significant for some data series through to April 2025.
New series highs for domestic consumption and exports of natural gas to the United States
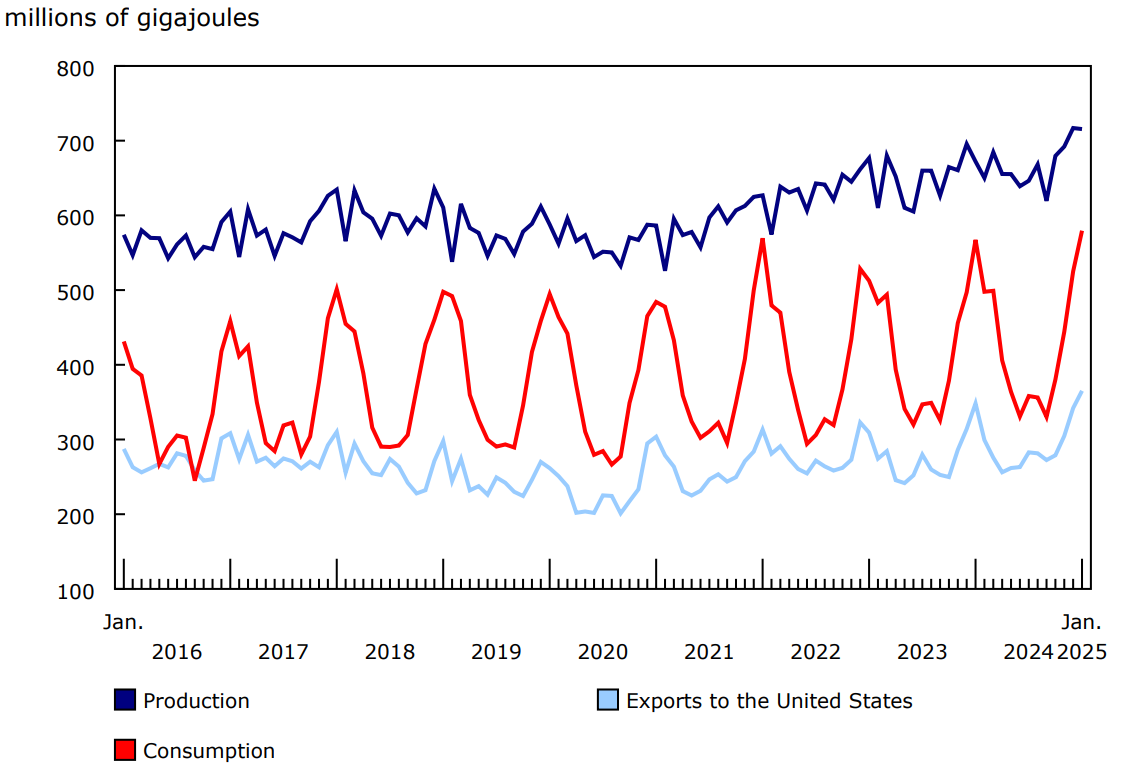
Total marketable production of natural gas increased 6.5% year over year to 715.5 million gigajoules in January.
Canadian demand for natural gas rose 2.2% year over year to 579.5 million gigajoules in January, the highest level of consumption in the series. The increase was driven by deliveries to the commercial and institutional (+8.0%) and residential (+6.5%) sectors. Colder temperatures across much of Canada in January compared with the same month one year earlier contributed to the uptick in consumption.
Exports of natural gas to the United States climbed 4.8% year over year to 365.2 million gigajoules in January, another series high. Like Canada, much of the United States experienced colder January temperatures compared with the previous year, leading to increased demand.
Chart 3: Canadian production of natural gas, domestic consumption and exports to the United States
Description - Chart 3
Data table: Canadian production of natural gas, domestic consumption and exports to the United States
Source: Table 25-10-0055-01.
Electricity generation and consumption set new records
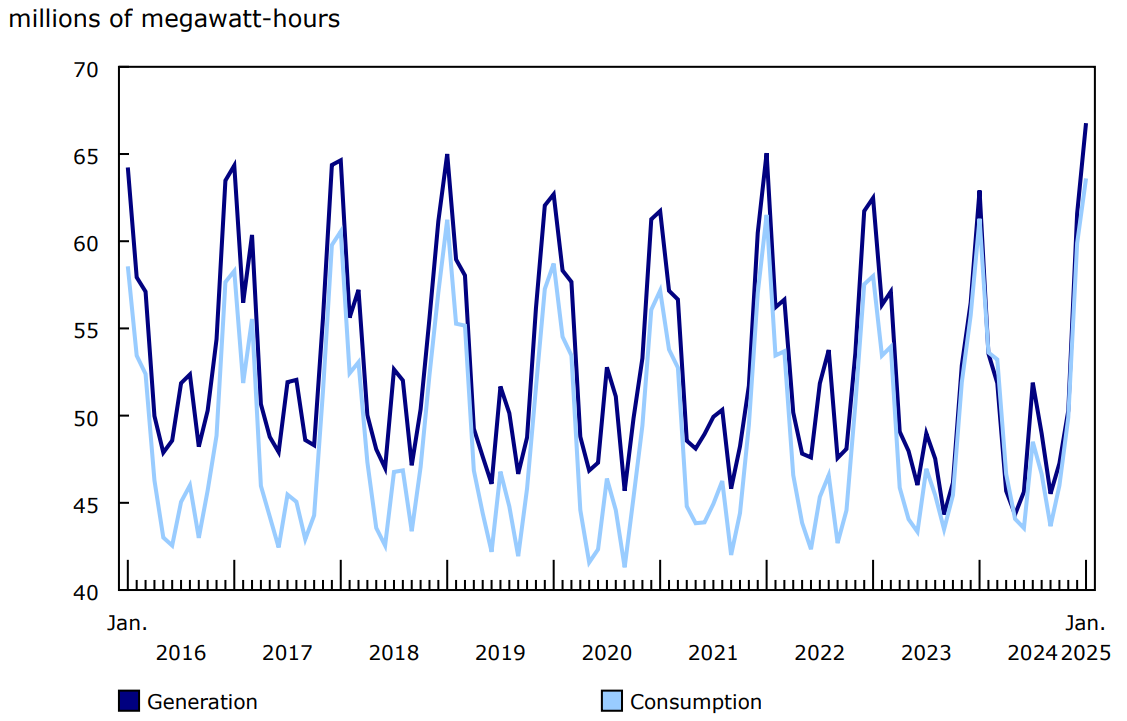
Total electricity generation in Canada climbed 6.1% year over year to 66.8 million megawatt-hours (MWh) in January. While generation always peaks in the winter, the generation recorded in January 2025 was the highest level recorded since this series was redesigned in 2016. Quebec, where hydroelectric generation (+12.0%) rebounded following reduced generation throughout 2024 due to dry conditions, was the main contributor to the overall increase in January 2025.
Electricity generated from wind was up 29.9% year over year to 5.6 million MWh in January, largely due to Alberta (+51.5%), where new capacity came online in the past 12 months.
Canadian electricity consumption rose 3.8% year over year to 63.6 million MWh in January, the highest level since the series redesign. Consumption was up due in large part to colder temperatures compared with January 2024.
Chart 4: Canadian electricity generation and consumption
Description - Chart 4
Data table: Canadian electricity generation and consumption
Source: Table 25-10-0016-01.
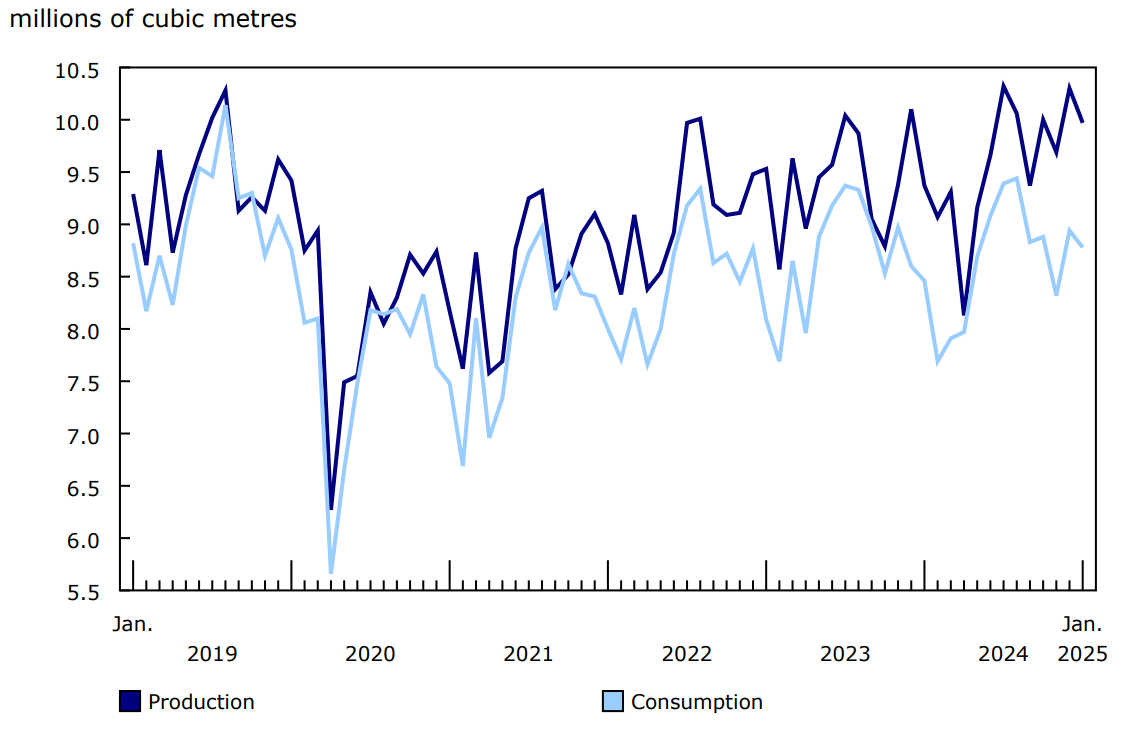
Production and consumption of refined petroleum products rise in January
Production of refined petroleum products rose 6.4% year over year to 10.0 million cubic metres in January 2025, with distillate fuel oil (+8.5%), finished motor gasoline (+7.4%) and kerosene-type jet fuel (+31.7%) all posting gains. Temporary refinery shutdowns in Alberta and British Columbia in January 2024 due to a short, regional cold snap, combined with some maintenance, likely contributed to the significant year-over-year increases in January 2025.
Consumption of refined petroleum products rose 3.8% year over year to 8.8 million cubic metres in January. Like production, consumption was driven by distillate fuel oil (+11.3%), finished motor gasoline (+2.5%) and kerosene-type jet fuel (+6.6%).
Chart 5: Canadian production and consumption of refined petroleum products
Description - Chart 5
Data table: Canadian production and consumption of refined petroleum products
Source: Table 25-10-0081-01.
Focus on Canada and the United States
On an annual basis, in 2024, Canada produced a total of 23.7 million terajoules of primary energy. Almost two-thirds of this energy was exported to the United States, including 100% of exported electricity and natural gas and over 95% of exported crude oil.
In January 2025, Canada exported a total of 4.8 million megawatt-hours (MWh) of electricity to the United States, or 7.1% of the total national generation for the month. Ontario accounted for 41.3% of total Canadian electricity exported to the United States in January, followed by Quebec (29.0%), British Columbia (11.7%) and Manitoba (6.5%). At the same time, imports of electricity from the United States amounted to 1.6 million MWh, with British Columbia importing almost half (48.3%) of the total.
For more data and insights on areas touched by the socio-economic relationship between Canada and the United States, see the Focus on Canada and the United States webpage.
Note to readers
The Energy Statistics Program relies on data collected from respondents and administrative sources.
The Consolidated Energy Statistics table (25-10-0079-01) presents monthly data on primary and secondary energy by fuel type (crude oil, natural gas, electricity, coal, etc.) in terajoules and supply and demand characteristics (production, exports, imports, etc.) for Canada. For more information, consult the Consolidated Energy Statistics Table: User Guide.
Data in this release are not seasonally adjusted.
The following survey programs support the "Energy statistics" release:
- Crude oil and natural gas (survey number 2198; tables 25-10-0036-01, 25-10-0055-01 and 25-10-0063-01)
- Energy transportation and storage (survey number 5300; tables 25-10-0075-01 and 25-10-0077-01)
- Natural gas transmission, storage and distribution (survey numbers 2149, 5210 and 5215; tables 25-10-0057-01, 25-10-0058-01 and 25-10-0059-01)
- Refined petroleum products (survey number 2150; table 25-10-0081-01).
- Renewable fuel and hydrogen (survey number 5294; table 25-10-0082-01)
- Electric power statistics (survey number 2151; tables 25-10-0015-01 and 25-10-0016-01)
- Coal and coke statistics (survey numbers 2147 and 2003; tables 25-10-0045-01 and 25-10-0046-01).
Revisions
Energy survey data and administrative sources are subject to revisions to reflect new or updated information. Historical revisions will be processed periodically.
Occasionally, data from Environment and Climate Change Canada are referenced by the Energy Statistics Program using Cooling Degree Days (CDDs) or Heating Degree Days (HDDs) as a measure of temperature. CDDs reflect the relationship between outdoor temperatures and the need to cool indoors to maintain room temperature. As temperatures outside rise, the number of CDDs increases. HDDs are the opposite and reflect the need to heat indoors to maintain room temperature. As temperatures outside fall, the number of HDDs increases.
Reference
Data tables: Access the latest tables.
- Note: some data tables may best be viewed on desktop.
Definitions, data sources and methods: See the associated survey numbers.
Previous release: Energy statistics, December 2024.
Contact information
For more information, or to enquire about the concepts, methods or data quality of this release, contact us (toll-free 1-800-263-1136; 514-283-8300; infostats@statcan.gc.ca) or Media Relations (statcan.mediahotline-ligneinfomedias.statcan@statcan.gc.ca).