
The average operating revenue of agricultural operations increased 7.5% year over year to $760,886 in 2023. Average operating expenses rose 7.3% to $618,420. As a result, average net operating income was up by 8.2% to $142,466.
Crop revenue accounted for just under half (48.7%) of operating revenue earned by Canadian farms in 2023, while livestock revenue accounted for 38.8%. The remaining revenue came from sources such as program payments, insurance proceeds, custom work and machine rental.
Chart 1: Average operating revenue and expenses, by farm type, Canada, 2023
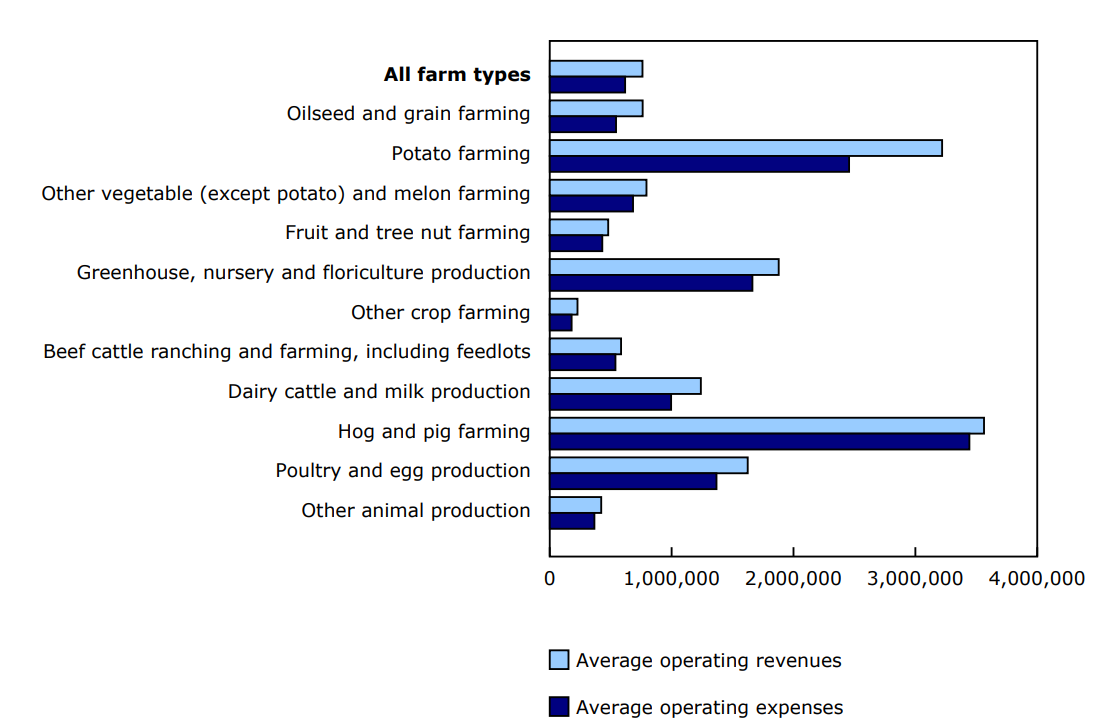
Description - Chart 1
Data table: Average operating revenue and expenses, by farm type, Canada, 2023
Source: Table 32-10-0136-01.
Oilseed and grain farms have the highest operating profit margin
Oilseed and grain revenue rose 10.3% in 2023, driven by higher wheat (+17.9%), canola (+7.8%) and barley (+17.7%). The increase was caused by a return to normal production levels in the 2022 crop year, following drought conditions in 2021.
Of the 11 major farm types, oilseed and grain farms once again saw the highest operating profit margin, at 28.7 cents per dollar of revenue in 2023.
Prairie provinces account for more than half of Canada's total farm revenue
Alberta, Saskatchewan and Manitoba had a combined total operating farm revenue of $66.4 billion in 2023, accounting for over half (56.8%) of the Canadian total.
Oilseed and grain farms in the Prairies reported earning $36.7 billion in revenue in 2023, accounting for 55.3% of the total farm operating revenue in these provinces. Saskatchewan farms had the highest operating profit margin of all provinces, at 25.9 cents per dollar of revenue.
Chart 2: Average operating profit margin per dollar of revenue, by farm type, Canada, 2023
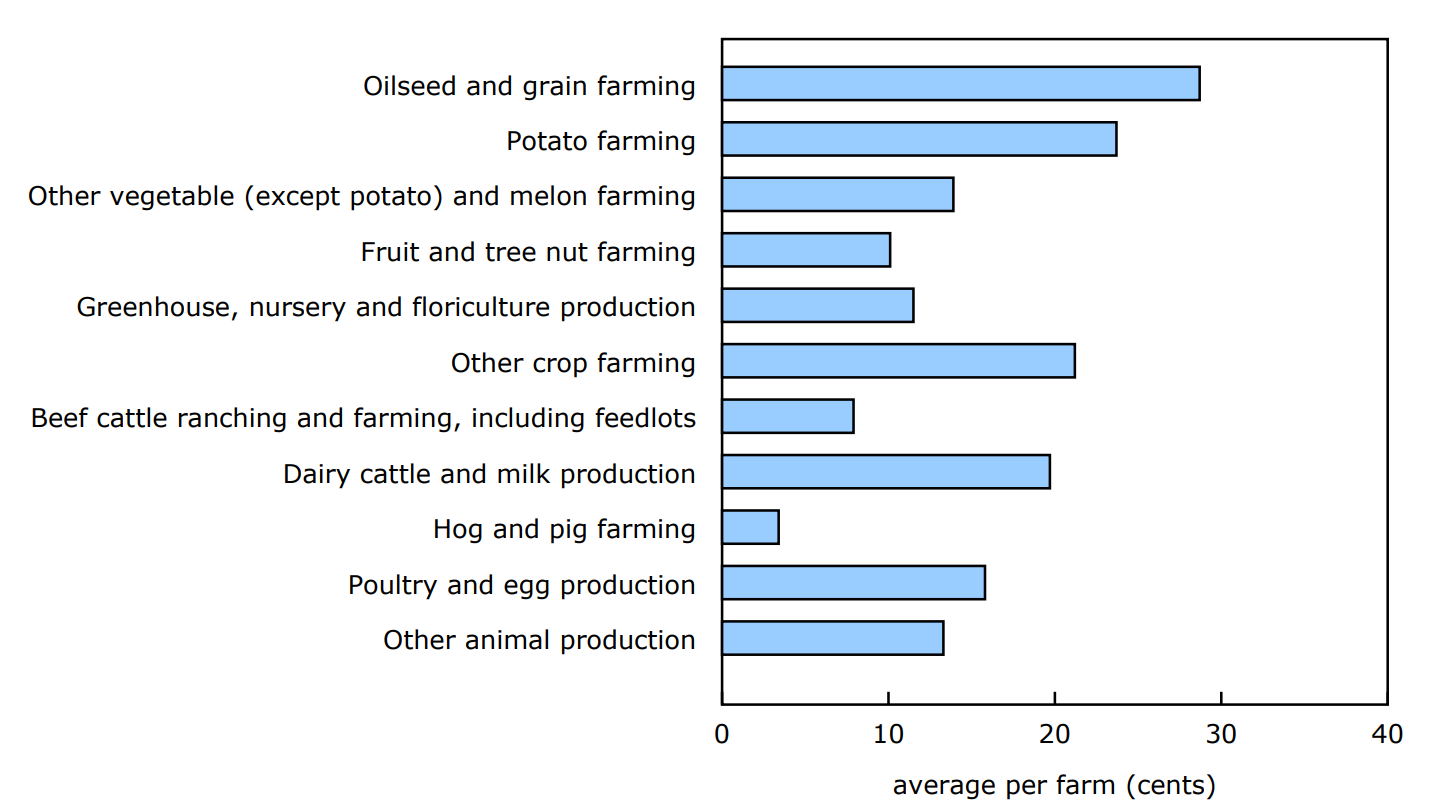
Description - Chart 2
Data table: Average operating profit margin per dollar of revenue, by farm type, Canada, 2023
Source: Table 32-10-0136-01.
Potato farm revenue grows on higher prices
Potato farms reported having an average net operating income of $763,405 in 2023, up 22.3% from 2022. This translated into an average operating profit margin of 23.7 cents per dollar of revenue in 2023, the second largest after oilseed and grain farms.
Potato farm revenue grew because of higher prices, a result of contract settlements between producers and processors. Furthermore, the resumption of exports to the United States, following trade restrictions in 2022, allowed potato farmers to regain access to key markets in 2023. Prince Edward Island accounted for one-fifth of potato farming revenue in Canada.
Cattle revenue continues to rise
Total livestock revenue increased 9.3% in 2023 to $45.4 billion. Beef cattle production continued to be the top contributor in the livestock sector, accounting for over 45% of total livestock revenue. Among all cattle farms, those in Alberta accounted for 60.5% of total operating revenue.
The average operating revenue of beef cattle farms rose 12.4% year over year to $585,177 in 2023. Despite lower supply, increased demand and higher prices led to growth in beef cattle revenue.
Dairy cattle and milk production recorded $8.9 billion in revenue in 2023, ranking second in highest livestock revenue.
Decline in swine revenue leads to lower average operating profit margin
The total operating revenue of hog and pig farms decreased 2.7% to $6.9 billion in 2023. As a result, hog and pig farms registered the lowest average operating profit margin, at 3.4 cents per dollar of revenue.
Swine producers exited the industry, which was hindered by rising feed costs, labour shortages, reduced processing capacity, lower swine prices and international market issues.
Note to readers
The Agriculture Taxation Data Program uses taxation records to produce detailed data for Canada and the provinces on operating revenues and expenses for the agriculture sector. The target population consists of incorporated farms and communal farming organizations with total farm operating revenues equal to or greater than $25,000, as well as unincorporated farms with total farm operating revenues of $10,000 and over.
Starting with the 2020 reference year, a farm is defined as an operation that produces at least one agricultural product and will report revenue and/or expenses for that agricultural production to the Canada Revenue Agency, as opposed to the previous definition based on the intention to sell agricultural commodities. Data users are advised to use caution when comparing data from the previous years.
In this release, average always refers to average per farm. Table 32-10-0136-01 also presents averages per farm reporting.
Data for this series are subject to revision up to five years prior to the current reference year. Data for 2021 and 2022 have been revised.
For the latest information on the Census of Agriculture, visit the Census of Agriculture portal.
For more information on agriculture and food, visit the Agriculture and food statistics portal.
Reference
Data table: 32-10-0136-01.
- Note: some data tables may best be viewed on desktop.
Definitions, data sources and methods: survey number 3447.
Previous release: Farm operating revenues and expenses, 2023.
Contact information
For more information, or to enquire about the concepts, methods or data quality of this release, contact us (toll-free 1-800-263-1136; 514-283-8300; infostats@statcan.gc.ca) or Media Relations (statcan.mediahotline-ligneinfomedias.statcan@statcan.gc.ca).