
Economic growth maintains pace for Canada in 2024 but varies across provinces and territories
In 2024, real gross domestic product (GDP) grew in every province in Canada as the national real GDP maintained its annual pace from the previous year at 1.6%. While the pace of growth moderated for Ontario, Manitoba and British Columbia compared with 2023, GDP grew faster in other provinces, with GDP in Newfoundland and Labrador rebounding in 2024 after declining for two consecutive years.
In the territories, GDP declined in Yukon and the Northwest Territories, while Nunavut almost doubled its growth, increasing 7.5% in 2024 after rising 3.8% in 2023.
Canada's population grew by 1.8% in 2024, a slower pace than in 2023 (+3.1%) and 2022 (+2.5%). Still, this likely contributed to spurring higher output in the service-producing industries. Services bolstered overall economic growth during a challenging year for goods-producing industries in six of the Canadian jurisdictions.
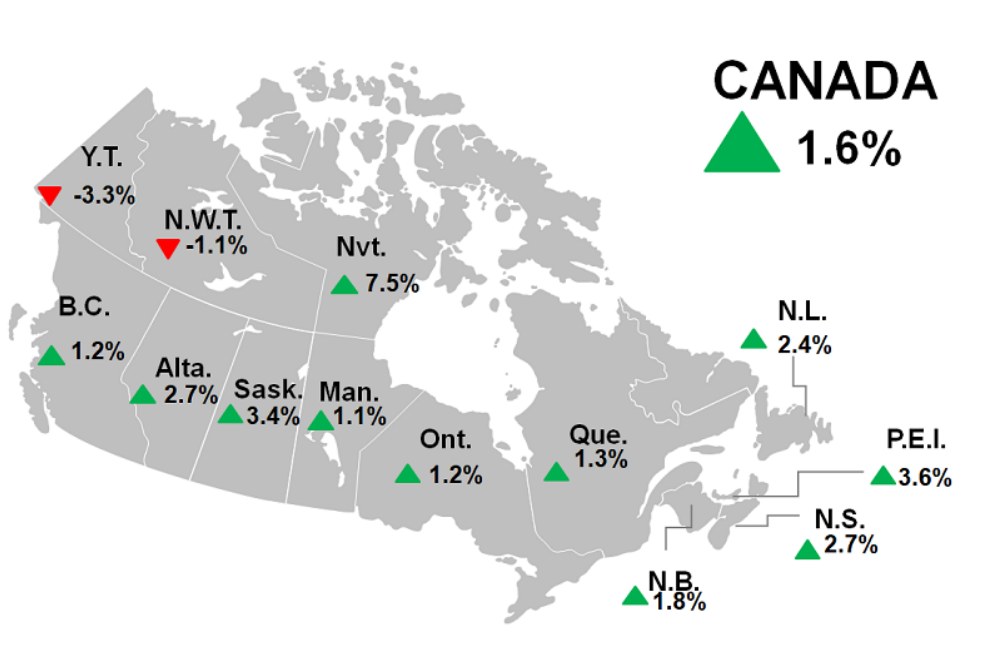
Map 1: Real gross domestic product growth, Canada, provinces and territories, 2024
Description - Map 1
The title of the map is "Real gross domestic product growth, Canada, provinces and territories, 2024"
This is a map of Canada showing the annual growth rates of real gross domestic product by industry in each province and territory in 2024. Green arrows pointing in an upward direction represent an increase, while red arrows pointing in a downward direction represent a decrease.
In Canada, real gross domestic product (GDP) was up 1.6%.
In Newfoundland and Labrador, real GDP was up 2.4%.
In Prince Edward Island, real GDP was up 3.6%.
In Nova Scotia, real GDP was up 2.7%.
In New Brunswick, real GDP was up 1.8%.
In Quebec, real GDP was up 1.3%.
In Ontario, real GDP was up 1.2%.
In Manitoba, real GDP was up 1.1%.
In Saskatchewan, real GDP was up 3.4%.
In Alberta, real GDP was up 2.7%.
In British Columbia, real GDP was up 1.2%.
In Yukon, real GDP was down 3.3%.
In the Northwest Territories, real GDP was down 1.1%.
In Nunavut, real GDP was up 7.5%.
Sources: Tables 36-10-0402-02 and 36-10-0434-03.
Ontario, Alberta and Quebec are the largest contributors to economic growth in 2024
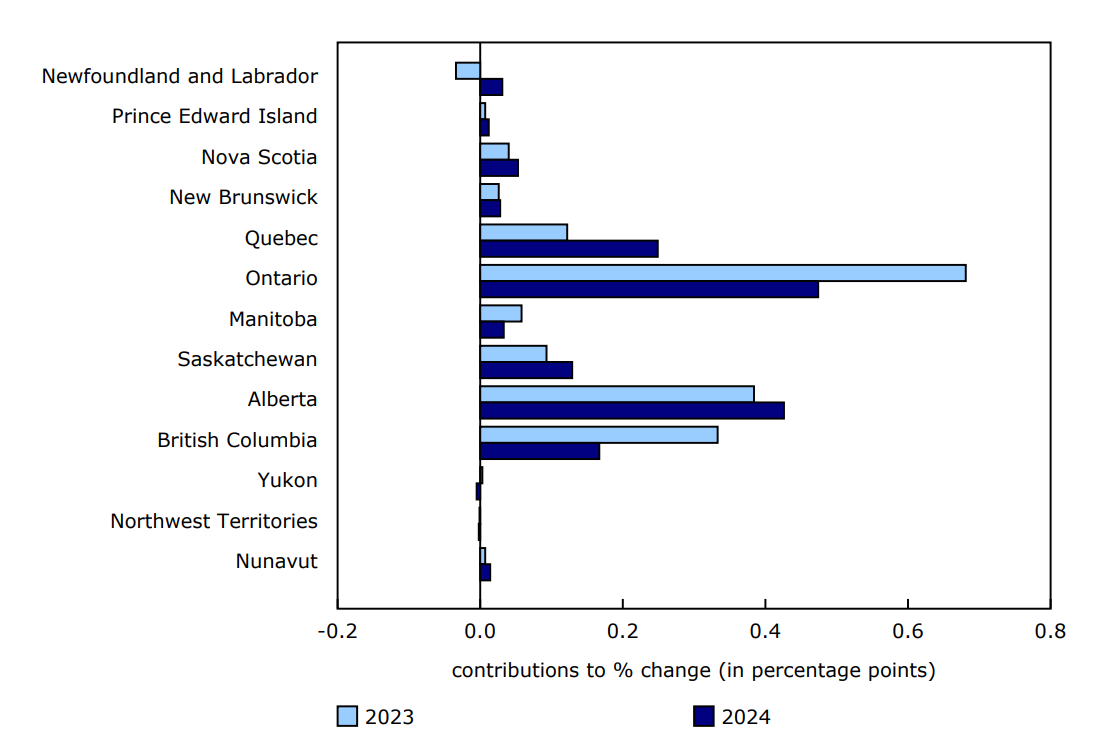
Although the Canadian economy grew at a similar pace in 2024 and 2023, the contributions from jurisdictions varied from one year to the other.
In 2024, Ontario (contribution of +0.47 percentage points) was the largest contributor to Canada's economic growth, mainly because of the size of its economy.
Based on the latest Canadian population estimates, the Prairie region accounted for approximately one-fifth (19%) of Canada's population. However, together, Alberta, Saskatchewan and Manitoba contributed more than one-third of the 1.6% increase in national GDP in 2024, with Alberta (+0.43 percentage points) contributing almost as much as Ontario.
Quebec (+0.25 percentage points), British Columbia (+0.17 percentage points) and the Atlantic region (+0.12 percentage points), along with Nunavut (+0.01 percentage points), also contributed to national economic growth. In contrast, the Northwest Territories and Yukon (-0.01 percentage points combined) were the only jurisdictions that detracted from national economic growth.
Chart 1: Provincial and territorial contributions to national percentage change, total economic growth, 2023 and 2024
Description - Chart 1
Data table: Provincial and territorial contributions to national percentage change, total economic growth, 2023 and 2024
Source: Table 36-10-0658-01.
Services continue to drive growth, but at a slower pace than in 2023 for most of Canada
Growth in the value-added of service-producing industries decelerated in every jurisdiction except Newfoundland and Labrador, New Brunswick, Quebec, the Northwest Territories and Nunavut in 2024.
Although the growth in services kept the real GDP growth of New Brunswick, Quebec, Ontario and British Columbia positive, it was not enough to offset the decline in goods production in the Northwest Territories and Yukon.
Prince Edward Island (+2.8%) had the largest increase in services, led by the real estate and rental and leasing (+5.0%) and health care and social assistance (+4.4%) sectors.
After falling in 2023, activity at offices of real estate agents rebounded in 2024 as the Bank of Canada began a series of consecutive interest rate cuts in the middle of the year.
The public sector (consisting of educational services, health care and social assistance, and public administration) was a significant contributor to nationwide growth. However, growth in 2024 slowed relative to 2023 in the provinces (excluding Quebec and New Brunswick) and in the Northwest Territories. Educational services rebounded in Quebec after a strike at elementary and secondary schools late in 2023, while New Brunswick saw public administration, and health care and social assistance increase at a faster pace than 2023 as employment grew, in part to address ongoing shortages in the health care system.
The growth in accommodation and food services slowed across much of the country in 2024. In addition, after strong gains from 2021 to 2023, growth in the motion picture and video exhibition industry slowed in 2024, mainly because of the effects of the Hollywood writers' and actors' strikes in 2023, which led to fewer releases and lower movie theatre attendance in 2024.
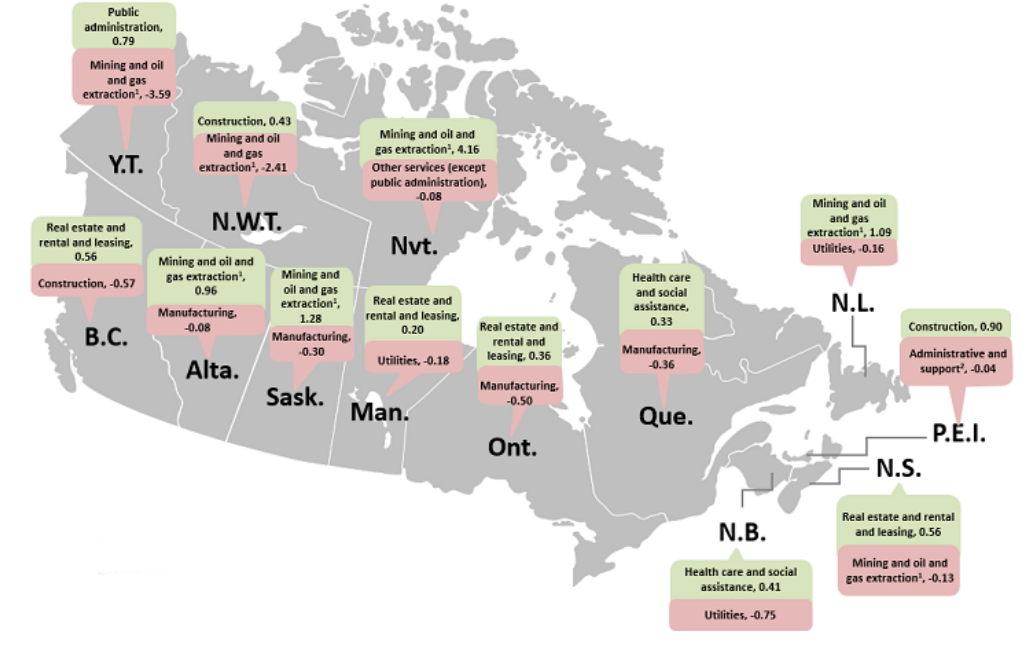
Map 2: Top contributing sectors (increasing or decreasing) to the variation in provincial and territorial real gross domestic product, in percentage points, 2024
Description - Map 2
The title of the map is "Top contributing sectors (increasing or decreasing) to the variation in provincial and territorial real gross domestic product, in percentage points, 2024"
This is a map of Canada showing the primary contributing (increasing or decreasing) sectors to the percentage change (in percentage points) in real gross domestic product (GDP) by industry in each province and territory in 2024.
In Newfoundland and Labrador, the mining, quarrying, and oil and gas extraction sector contributed +1.09 percentage points to the percentage change in real GDP and the utilities sector contributed -0.16 percentage points to the percentage change in real GDP.
In Prince Edward Island, the construction sector contributed +0.90 percentage points to the percentage change in real GDP and the administrative and support, waste management and remediation services sector contributed -0.04 percentage points to the percentage change in real GDP.
In Nova Scotia, the real estate and rental and leasing sector contributed +0.56 percentage points to the percentage change in real GDP and the mining, quarrying, and oil and gas extraction sector contributed -0.13 percentage points to the percentage change in real GDP.
In New Brunswick, the health care and social assistance sector contributed +0.41 percentage points to the percentage change in real GDP and the utilities sector contributed -0.75 percentage points to the percentage change in real GDP.
In Quebec, the health care and social assistance sector contributed +0.33 percentage points to the percentage change in real GDP and the manufacturing sector contributed -0.36 percentage points to the percentage change in real GDP.
In Ontario, the real estate and rental and leasing sector contributed +0.36 percentage points to the percentage change in real GDP and the manufacturing sector contributed -0.50 percentage points to the percentage change in real GDP.
In Manitoba, the real estate and rental and leasing sector contributed +0.20 percentage points to the percentage change in real GDP and the utilities sector contributed -0.18 percentage points to the percentage change in real GDP.
In Saskatchewan, the mining, quarrying, and oil and gas extraction sector contributed +1.28 percentage points to the percentage change in real GDP and the manufacturing sector contributed -0.30 percentage points to the percentage change in real GDP.
In Alberta, the mining, quarrying, and oil and gas extraction sector contributed +0.96 percentage points to the percentage change in real GDP and the manufacturing sector contributed -0.08 percentage points to the percentage change in real GDP.
In British Columbia, the real estate and rental and leasing sector contributed +0.56 percentage points to the percentage change in real GDP and the construction sector contributed -0.57 percentage points to the percentage change in real GDP.
In Yukon, the public administration sector contributed +0.79 percentage points to the percentage change in real GDP and the mining, quarrying, and oil and gas extraction sector contributed -3.59 percentage points to the percentage change in real GDP.
In the Northwest Territories, the construction sector contributed +0.43 percentage points to the percentage change in real GDP and the mining, quarrying, and oil and gas extraction sector contributed -2.41 percentage points to the percentage change in real GDP.
In Nunavut, the mining, quarrying, and oil and gas extraction sector contributed +4.16 percentage points to the percentage change in real GDP and the other services (except public administration) sector contributed -0.08 percentage points to the percentage change in real GDP.
Note: Values shown are in percentage points.
Source: Table 36-10-0402-01.
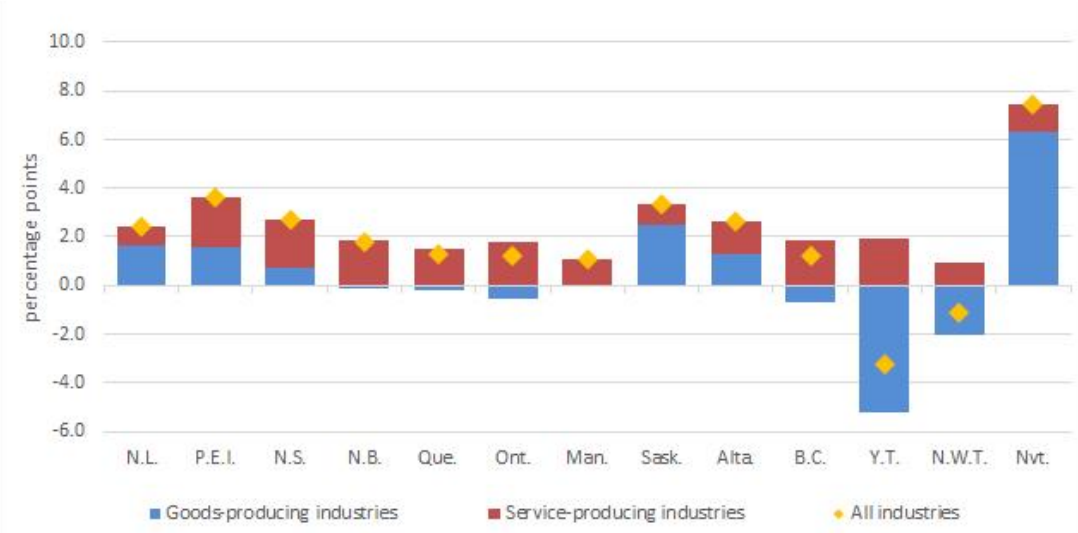
Variability in output from goods-producing industries across Canada
In 2024, the economic activity from goods-producing industries declined in New Brunswick (-0.4%), Quebec (-0.8%), Ontario (-2.3%), British Columbia (-2.9%), Yukon (-19.9%) and the Northwest Territories (-6.8%), while it rose in all other jurisdictions.
The increased output of goods-producing industries in some jurisdictions contributed to their overall growth, propelling their economies to grow at a faster pace than the national economy.
Chart 2: Contributions to percentage change of goods-producing industries and service-producing industries to real gross domestic product, provinces and territories, in percentage points, 2024
Description - Chart 2
The title of the chart is "Contributions to percentage change of goods-producing industries and service-producing industries to real gross domestic product, provinces and territories, in percentage points, 2024"
This is a combination chart showing the annual contributions (positive or negative) of real gross domestic product (GDP) by industry in each province and territory. Goods-producing industries are represented by blue stacked bars and service-producing industries are represented by red stacked bars. The all industries category is represented by a yellow marker.
In Newfoundland and Labrador, goods-producing industries contributed 1.65 percentage points to the percentage change in real GDP, service-producing industries contributed 0.74 percentage points, and all industries growth was 2.39%.
In Prince Edward Island, goods-producing industries contributed 1.61 percentage points to the percentage change in real GDP, service-producing industries contributed 2.01 percentage points, and all industries growth was 3.63%.
In Nova Scotia, goods-producing industries contributed 0.72 percentage points to the percentage change in real GDP, service-producing industries contributed 1.96 percentage points, and all industries growth was 2.68%.
In New Brunswick, goods-producing industries contributed -0.09 percentage points to the percentage change in real GDP, service-producing industries contributed 1.88 percentage points, and all industries growth was 1.79%.
In Quebec, goods-producing industries contributed -0.22 percentage points to the percentage change in real GDP, service-producing industries contributed 1.51 percentage points, and all industries growth was 1.29%.
In Ontario, goods-producing industries contributed -0.53 percentage points to the percentage change in real GDP, service-producing industries contributed 1.77 percentage points, and all industries growth was 1.24%.
In Manitoba, goods-producing industries contributed 0.02 percentage points to the percentage change in real GDP, service-producing industries contributed 1.04 percentage points, and all industries growth was 1.06%.
In Saskatchewan, goods-producing industries contributed 2.52 percentage points to the percentage change in real GDP, service-producing industries contributed 0.85 percentage points, and all industries growth was 3.37%.
In Alberta, goods-producing industries contributed 1.30 percentage points to the percentage change in real GDP, service-producing industries contributed 1.36 percentage points, and all industries growth was 2.66%.
In British Columbia, goods-producing industries contributed -0.68 percentage points to the percentage change in real GDP, service-producing industries contributed 1.88 percentage points, and all industries growth was 1.20%.
In Yukon, goods-producing industries contributed -5.19 percentage points to the percentage change in real GDP, service-producing industries contributed 1.92 percentage points, and all industries growth was -3.27%.
In the Northwest Territories, goods-producing industries contributed -2.03 percentage points to the percentage change in real GDP, service-producing industries contributed 0.91 percentage points, and all industries growth was -1.12%.
In Nunavut, goods-producing industries contributed 6.33 percentage points to the percentage change in real GDP, service-producing industries contributed 1.13 percentage points, and all industries growth was 7.46%.
Source: Table 36-10-0402-01.
The industrial production sector—encompassing output from manufacturing; mining, quarrying, and oil and gas extraction; and utilities—showed increased activity for five provinces and one territory.
Increased output in oil and gas extraction in Alberta (+3.7%), along with a rebound in Newfoundland and Labrador (+4.6%) after three consecutive years of declines, were among the top contributors to growth in these provinces' respective economies.
Mining and quarrying (except oil and gas) was among the top contributors to growth because of increased output in other metal ore mining (+35.5%) and potash mining (+8.3%) in Saskatchewan; gold and silver (+11.9%) and iron ore mining (+5.3%) in Nunavut; and copper, nickel, lead and zinc ore mining production (+33.7%) in Newfoundland and Labrador.
Conversely, mining activity was the top detractor from growth in the Northwest Territories, with a continued decline in diamond production (-11.6%); in Yukon (-33.7%), as operations halted at Eagle Gold Mine; and in Nova Scotia, following the closure of the Touquoy Gold Mine.
Activity in the utilities sector fell in four provinces and two territories, while it rose in other jurisdictions. The utilities sector was the largest detractor from growth in New Brunswick (-18.1%), Newfoundland and Labrador (-7.3%), and Manitoba (-5.1%).
In New Brunswick, the decline was attributable to lower electricity generation and out-of-province sales of electricity for 2024.
Output from the manufacturing sector decreased in five provinces, acting as a drag on growth in British Columbia (-6.2%), Ontario (-4.7%), Saskatchewan (-4.6%), Quebec (-2.6%), and Alberta (-1.1%).
Construction remains volatile in 2024
Construction activity fell in British Columbia (-5.7%), Ontario (-2.0%) and Yukon (-12.4%) in 2024, while it increased in other jurisdictions.
The decline in British Columbia was driven by residential construction (-8.8%) and engineering construction (-9.0%). In Ontario, residential construction declined for the third consecutive year.
In contrast, construction was among the most significant contributors to growth in Prince Edward Island (+12.4%), Saskatchewan (+13.2%), the Northwest Territories (+6.7%) and Nunavut (+26.9%).
The increased construction activity in Prince Edward Island was led by residential construction (+14.4%), as total housing starts recorded the second-highest levels since 1973. Ongoing construction of a new gold mine in Nunavut and a new potash mine in Saskatchewan were among the projects contributing to growth in engineering construction in those jurisdictions.
Focus on Canada and the United States
There were 10 jurisdictions where at least 10% of the gross domestic product (GDP) was dependent on exports to the United States in 2021.
The impact of international trade on the Canadian economy can be analyzed using the Value-Added in Exports database, which provides data on the direct and indirect impact of exports on GDP and jobs by industry. As described in the document "Value-added exports: measurement framework," direct impacts refer to the jobs or GDP generated within the exporting industry itself, while indirect impacts pertain to the jobs or GDP created through the demand for the industry's products by other exporting industries. An industry's output attributed to foreign demand refers to the jobs and GDP generated through both direct and indirect impacts.
The Value-Added in Exports database covers the period from 2007 to 2021 for the provinces and territories and is derived from the supply and use tables. Due to their comprehensive nature and availability of data sources, these tables are published with a three-year lag.
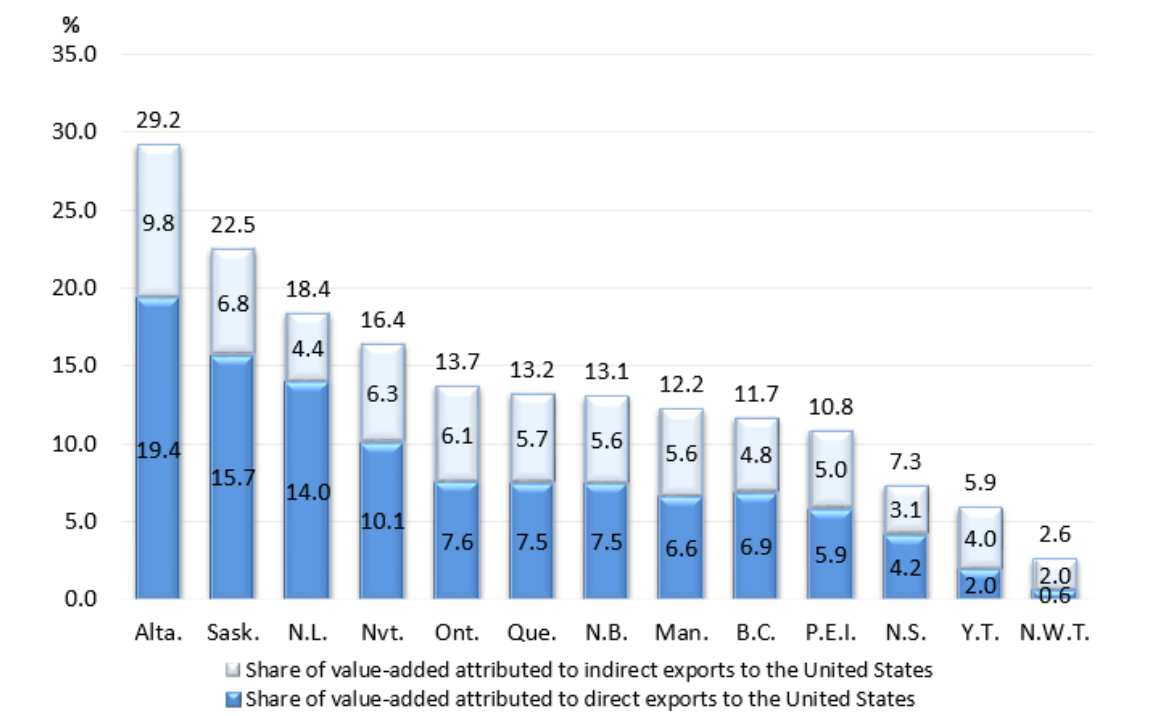
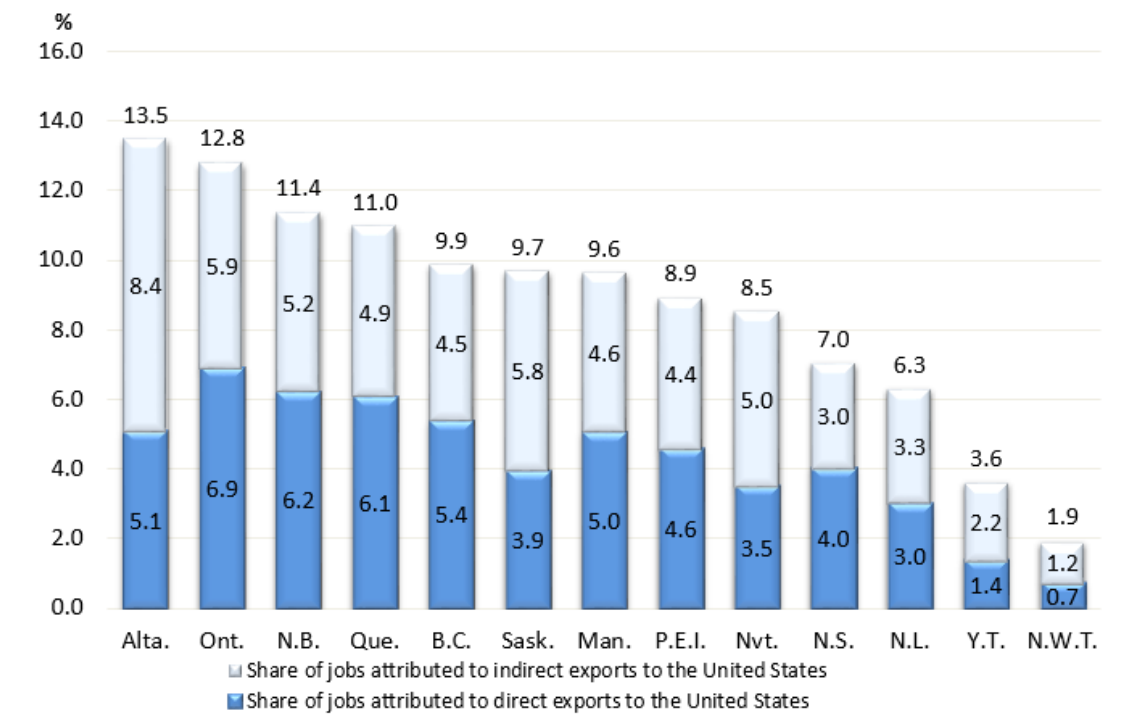
Among the 10 provinces, the Canadian exports to the United States accounted for 29.2% of Alberta's total GDP and 22.5% of Saskatchewan's total GDP in 2021 (see Infographic 4), while the jobs associated with the exports accounted for 13.5% of total jobs in Alberta and 12.8% of total jobs in Ontario (see Infographic 5).
For Alberta's total GDP exposure of 29.2% in 2021, 19.4% was due to the direct impact of exports, while 9.8% was due to indirect impacts (see Infographic 4). On the other hand, 5.1% of Alberta's jobs were directly associated with exports to the United States, while 8.4% were indirectly dependent on exports to the United States in 2021 (see Infographic 5).
The direct impact of exports from oil and gas extraction due to the demand from the United States accounted for 14.4% of the 19.4% of the total direct impact in Alberta, 11.8% of the 14.0% of the total direct impact in Newfoundland and Labrador and 8.2% of the 15.7% of the total direct impact in Saskatchewan in 2021.
For more data and insights on areas touched by the socio-economic relationship between Canada and the United States, see the Focus on Canada and the United States webpage.
Chart 3: Provincial and territorial dependency on the United States (share of value-added attributed to direct and indirect exports to the United States), 2021
Description - Chart 3
The title of the chart is "Provincial and territorial dependency on the United States (share of value-added attributed to direct and indirect exports to the United States), 2021"
This is a stacked bar graph showing the share of value-added attributed to direct and indirect exports to the United States by provinces and territories. Percentages can be read along the y-axis, within the bar segments, and above the bars (for the total). The dark blue segment shows the share of value-added attributed to direct exports to the United States and the light blue shows the share of value-added attributed to indirect exports to the United States.
For Alberta, 19.4% of value-added is attributed to direct exports and 9.8% of value-added is attributed to indirect exports for a total of 29.2%.
For Saskatchewan, 15.7% of value-added is attributed to direct exports and 6.8% of value-added is attributed to indirect exports for a total of 22.5%.
For Newfoundland and Labrador, 14.0% of value-added is attributed to direct exports and 4.4% of value-added is attributed to indirect exports for a total of 18.4%.
For Nunavut, 10.1% of value-added is attributed to direct exports and 6.3% of value-added is attributed to indirect exports for a total of 16.4%.
For Ontario, 7.6% of value-added is attributed to direct exports and 6.1% of value-added is attributed to indirect exports for a total of 13.7%.
For Quebec, 7.5% of value-added is attributed to direct exports and 5.7% of value-added is attributed to indirect exports for a total of 13.2%.
For New Brunswick, 7.5% of value-added is attributed to direct exports and 5.6% of value-added is attributed to indirect exports for a total of 13.1%.
For Manitoba, 6.6% of value-added is attributed to direct exports and 5.6% of value-added is attributed to indirect exports for a total of 12.2%.
For British Columbia, 6.9% of value-added is attributed to direct exports and 4.8% of value-added is attributed to indirect exports for a total of 11.7%.
For Prince Edward Island, 5.9% of value-added is attributed to direct exports and 5.0% of value-added is attributed to indirect exports for a total of 10.8%.
For Nova Scotia, 4.2% of value-added is attributed to direct exports and 3.1% of value-added is attributed to indirect exports for a total of 7.3%.
For Yukon, 2.0% of value-added is attributed to direct exports and 4.0% of value-added is attributed to indirect exports for a total of 5.9%.
For Northwest Territories, 0.6% of value-added is attributed to direct exports and 2.0% of value-added is attributed to indirect exports for a total of 2.6%.
Notes: The sum of the shares of value-added attributed to direct exports to the United States and the share of value-added attributed to indirect exports to the United States may not be equal to the total share due to rounding.
Source: Custom tabulation based on table 12-10-0100-01.
Chart 4: Provincial and territorial dependency on the United States (share of total jobs attributed to direct and indirect exports to the United States), 2021
Description - Chart 4
The title of the chart is "Provincial and territorial dependency on the United States (share of total jobs attributed to direct and indirect exports to the United States), 2021"
This is a stacked bar graph showing the share of total jobs attributed to direct and indirect exports to the United States by provinces and territories. Percentages can be read along the y-axis, within the bar segments, and above the bars (for the total). The dark blue segment shows the share of jobs attributed to direct exports to the United States and the light blue segment shows the share of jobs attributed to indirect exports to the United States.
For Alberta, 5.1% of jobs are attributed to direct exports and 8.4% of jobs are attributed to indirect exports for a total of 13.5%.
For Ontario, 6.9% of jobs are attributed to direct exports and 5.9% of jobs are attributed to indirect exports for a total of 12.8%.
For New Brunswick, 6.2% of jobs are attributed to direct exports and 5.2% of jobs are attributed to indirect exports for a total of 11.4%.
For Quebec, 6.1% of jobs are attributed to direct exports and 4.9% of jobs are attributed to indirect exports for a total of 11.0%.
For British Columbia, 5.4% of jobs are attributed to direct exports and 4.5% of jobs are attributed to indirect exports for a total of 9.9%.
For Saskatchewan, 3.9% of jobs are attributed to direct exports and 5.8% of jobs are attributed to indirect exports for a total of 9.7%.
For Manitoba, 5.0% of jobs are attributed to direct exports and 4.6% of jobs are attributed to indirect exports for a total of 9.6%.
For Prince Edward Island, 4.6% of jobs are attributed to direct exports and 4.4% of jobs are attributed to indirect exports for a total of 8.9%.
For Nunavut, 3.5% of jobs are attributed to direct exports and 5.0% of jobs are attributed to indirect exports for a total of 8.5%.
For Nova Scotia, 4.0% of jobs are attributed to direct exports and 3.0% of jobs are attributed to indirect exports for a total of 7.0%.
For Newfoundland and Labrador, 3.0% of jobs are attributed to direct exports and 3.3% of jobs are attributed to indirect exports for a total of 6.3%.
For Yukon, 1.4% of jobs are attributed to direct exports and 2.2% of jobs are attributed to indirect exports for a total of 3.6%.
For Northwest and Territories, 0.7% of jobs are attributed to direct exports and 1.2% of jobs are attributed to indirect exports for a total of 1.9%.
Notes: The sum of the shares of value-added attributed to direct exports and the share of value-added attributed to indirect exports may not be equal to the total share of value-added attributed to foreign demand due to rounding.
Source: Custom tabulation based on table 12-10-0100-01.
Sustainable development goals
On January 1, 2016, the world officially began implementation of the 2030 Agenda for Sustainable Development—the United Nations' transformative plan of action that addresses urgent global challenges over the next 15 years. The plan is based on 17 specific sustainable development goals.
The release on real gross domestic product by industry for provinces and territories is an example of how Statistics Canada supports the reporting on the Global Goals for Sustainable Development. This release will be used in helping to measure the following goal:
Note to readers
The provincial and territorial gross domestic product (GDP) by industry data at basic prices are chained volume estimates with 2017 as their reference year. This means data for each industry and aggregate are obtained from a chained volume index multiplied by the industry's gross value-added in 2017.
Percentage changes for GDP by industry are calculated using volume measures, that is, adjusted for price variations.
The Economic Accounts Statistics Portal and the data visualization product Gross domestic product (GDP) by industry, provinces and territories: Interactive tool also display the latest available results.
Statistics Canada compiles "Contributions to Percentage Change" and "Contribution to National Percentage Change" figures, which provide users with additional dimensions for their analysis by delineating, respectively, how industries in the provinces or territories contribute to their own relative total economy and in turn how provinces and territories contribute to the real growth of the Canadian economy.
For more information on GDP, see the video "What is Gross Domestic Product (GDP)?"
Revisions
Estimates of provincial and territorial GDP by industry for 2024 are included with this release. No revisions have been made to data for previous years. Revised estimates of provincial–territorial GDP by industry will be published in November 2025, with the incorporation of the new benchmark Supply and Use Tables for reference year 2022 and the adoption of the North American Industry Classification System 2022.
Reference
Data tables: 36-10-0400-01, 36-10-0402-01 and 36-10-0658-01.
- Note: some data tables may best be viewed on desktop.
Definitions, data sources and methods: survey numbers 1301, 1303 and 1401.
Previous release: Gross domestic product by industry: Provinces and territories, 2023.
Contact information
For more information, or to enquire about the concepts, methods or data quality of this release, contact us (toll-free 1-800-263-1136; 514-283-8300; infostats@statcan.gc.ca) or Media Relations (statcan.mediahotline-ligneinfomedias.statcan@statcan.gc.ca).