

The Farm Product Price Index (FPPI) rose 4.0% on a year-over-year basis in March, as the gain in the total livestock and animal products index outweighed the loss in the total crops index. This marked the FPPI's fifth consecutive month of year-over-year increase.
Chart 1: 12-month change in the Farm Product Price Index
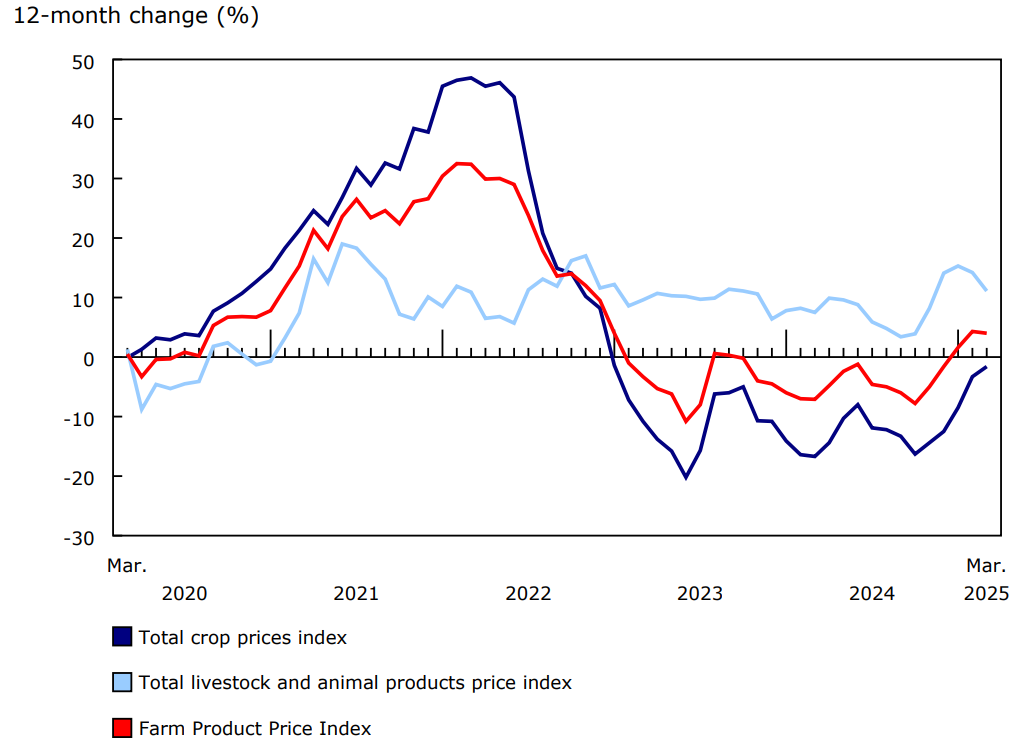
Description - Chart 1
Data table: 12-month change in the Farm Product Price Index
Source: Table 32-10-0098-01.
The total livestock and animal products index rises on strong demand for cattle and a shrinking cattle herd
The total livestock and animal products index was up 11.1% in March compared with the same month one year earlier. The increase was primarily attributable to gains in the cattle and calves index and the hogs index.
The cattle and calves index rose 17.4% in March compared with March 2024. The strong demand for cattle and a shrinking cattle herd contributed to the increase in March 2025. Year over year, the quantity of cattle exported for immediate slaughter was up 16.3%, and the value of cattle exported for immediate slaughter increased 36.5% in March. The inventory of Canadian cattle as of January 1, 2025, was the lowest level since 1989.
On a year-over-year basis, the indexes for hogs (+13.4%) and dairy (+6.0%) were up in March 2025, while the indexes for eggs (-1.2%) and poultry (-1.1%) were down.
Decline in the total crops index driven by lower prices for most crops
In March, the total crops index decreased 1.6% compared with March 2024, marking the third consecutive year-over-year decline in March. The drop in the crops index in March 2025 was driven by lower prices for most crops.
The specialty crops index fell 10.0% in March compared with the same month the previous year, mainly due to lower prices for chickpeas (-33.1%) and dry peas (-15.3%). A 100% import tariff on peas imposed by China put downward pressure on the price of Canadian dry peas.
The grains index (-5.3%) recorded a third consecutive year-over-year decline in March. Prices for all major grains (except corn) were weaker in March compared with the same month one year earlier, with rye (-24.7%) and durum (-20.2%) leading the price decreases.
In March, the oilseeds index shrank 0.5% from March 2024. The decline in March 2025 was primarily due to lower prices for soybeans (-11.4%), as increased domestic supply put downward pressure on prices.
Increases in the price indexes for fresh vegetables (+2.8%), fresh fruits (+1.6%) and fresh potatoes (+1.5%) mitigated the year-over-year decline in the total crops index in March.
Table 1: Farm Product Price Index
Note to readers
For more information on agriculture and food, visit the Agriculture and food statistics portal.
Reference
Data tables: 32-10-0098-01, 32-10-0099-01 and 32-10-0100-01.
- Note: some data tables may best be viewed on desktop.
Definitions, data sources and methods: survey number 5040.
Previous release: Farm product prices, December 2024.
Contact information
For more information, or to enquire about the concepts, methods or data quality of this release, contact us (toll-free 1-800-263-1136; 514-283-8300; infostats@statcan.gc.ca) or Media Relations (statcan.mediahotline-ligneinfomedias.statcan@statcan.gc.ca).