

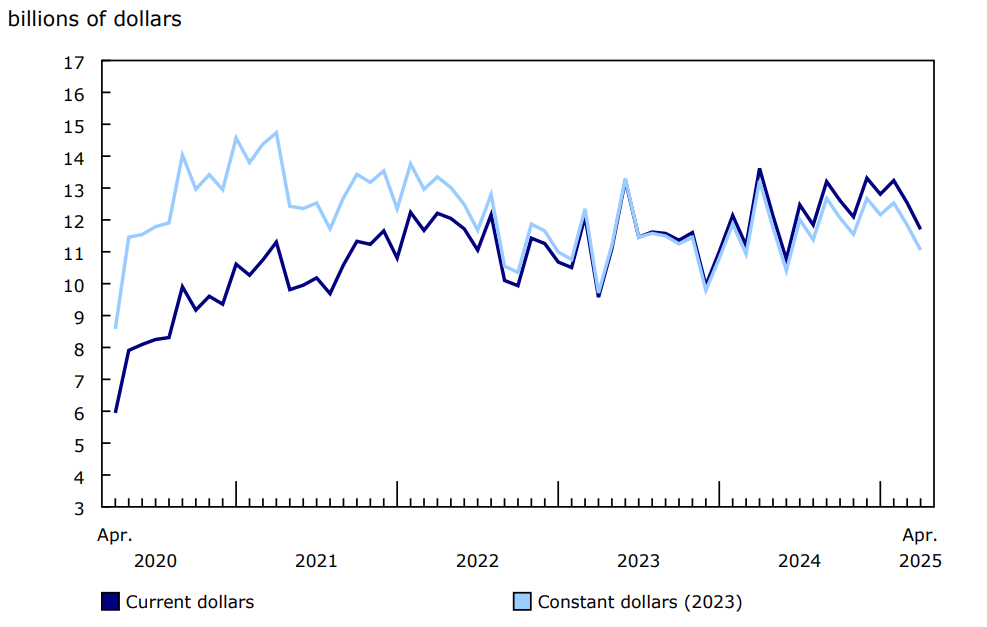
In April, the total value of building permits issued in Canada decreased by $829.6 million (-6.6%) to $11.7 billion. British Columbia (-$1.2 billion) led this decrease in construction intentions, which was mitigated by Ontario (+$299.3 million).
On a constant dollar basis (2023=100), the total value of building permits issued in April fell by 6.6% from the previous month and by 16.4% on a year-over-year basis, following a strong upward movement in April 2024.
Chart 1: Total value of building permits, seasonally adjusted
Description - Chart 1
Data table: Total value of building permits, seasonally adjusted
Source: Table 34-10-0292-01.
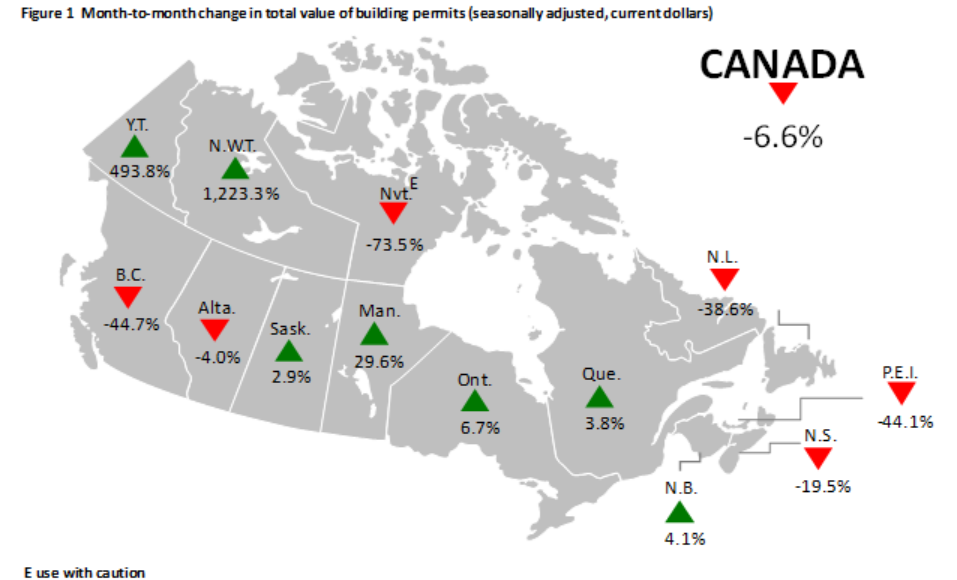
Figure 1: Month-to-month change in total value of building permits (seasonally adjusted, current dollars)
Description - Figure 1
This is a map of Canada by province and territory that shows the month-to-month percentage changes of the total building permits value. Green arrows represent an increase, while red arrows represent a decrease.
Building permit values in Canada were down 6.6% in April compared with March. Newfoundland and Labrador was down 38.6%, Prince Edward Island was down 44.1%, Nova Scotia was down 19.5%, New Brunswick was up 4.1%, Quebec was up 3.8%, Ontario was up 6.7%, Manitoba was up 29.6%, Saskatchewan was up 2.9%, Alberta was down 4.0%, British Columbia was down 44.7%, Yukon was up 493.8%, the Northwest Territories was up 1,223.3% and Nunavut was down 73.5% E (use with caution).
Source: Table 34-10-0292-01, Building permits, by type of building and type of work.
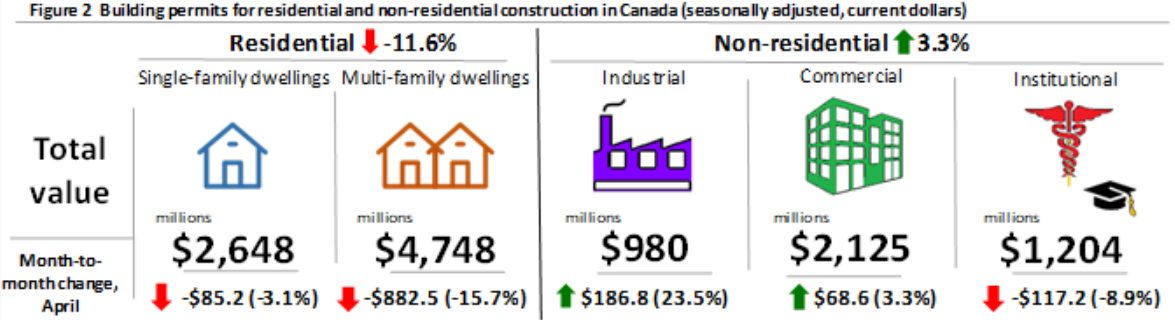
Figure 2: Building permits for residential and non-residential construction in Canada (seasonally adjusted, current dollars)
Description - Figure 2
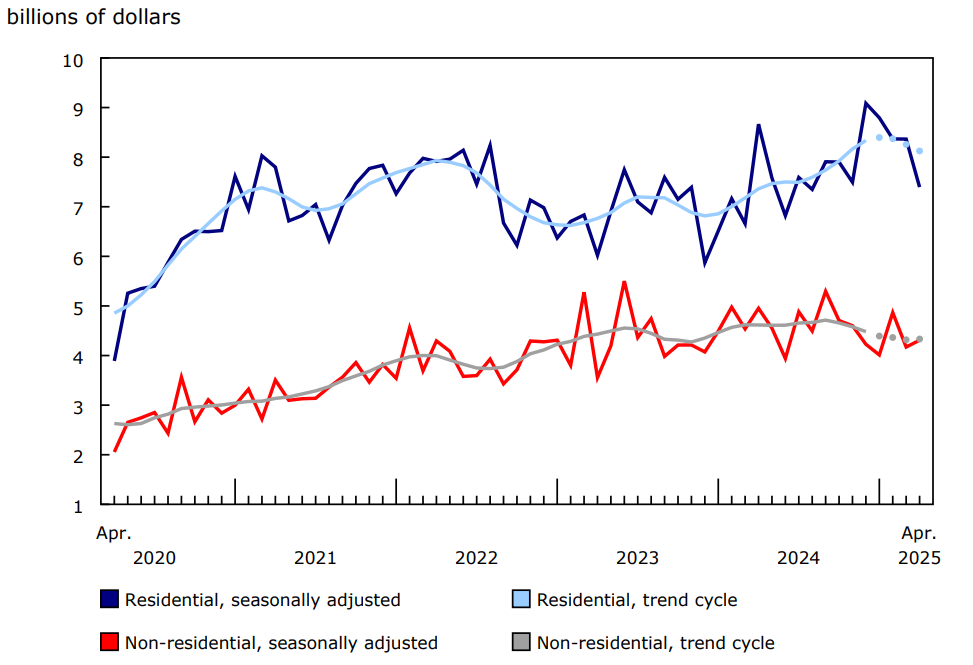
Residential: The total value was down 11.6% month over month.
Non-residential: The total value was up 3.3% month over month.
Single-family dwellings: the total value was $2,648 million, representing a month-over-month decrease of 3.1% or $85.2 million.
Multi-family dwellings: the total value was $4,748 million, representing a month-over-month decrease of 15.7% or $882.5 million.
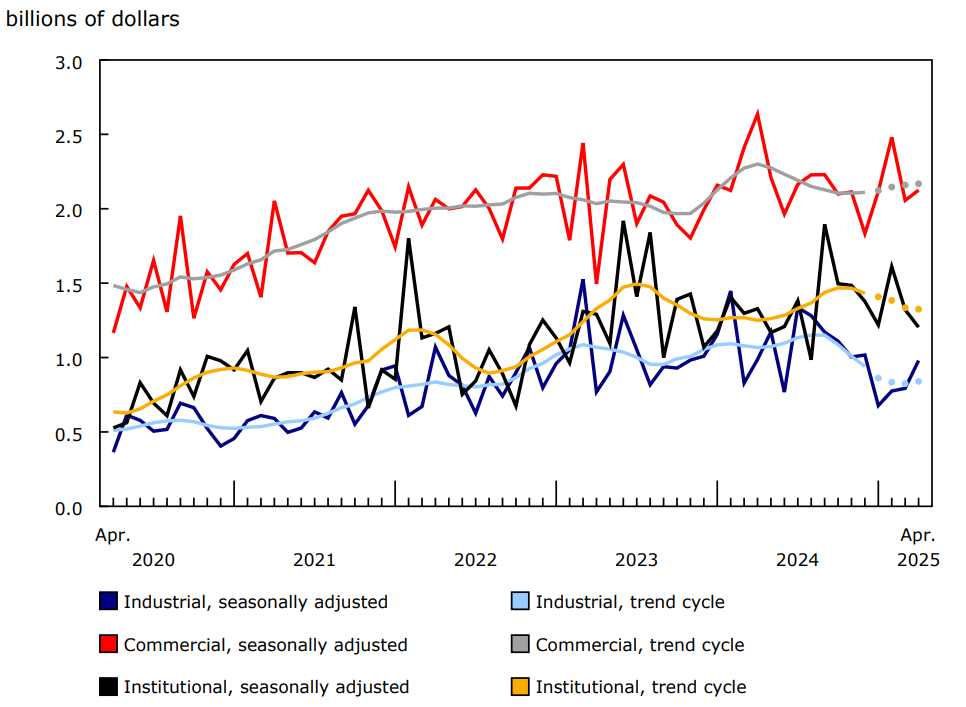
Industrial: the total value was $980 million, representing a month-over-month increase of 23.5% or $186.8 million.
Commercial: the total value was $2,125 million, representing a month-over-month increase of 3.3% or $68.6 million.
Institutional: the total value was $1,204 million, representing a month-over-month decrease of 8.9% or $117.2 million.
Source: Table 34-10-0292-01, Building permits, by type of building and type of work.
Multi-family construction intentions weigh down residential sector
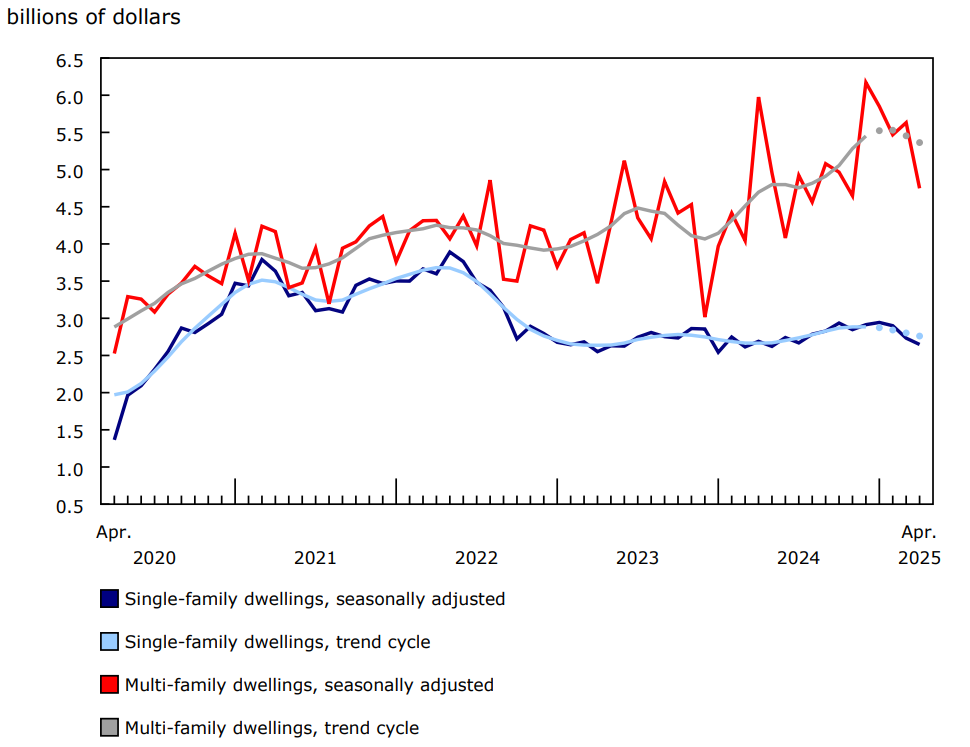
Residential construction intentions declined 11.6% (-$967.7 million) to $7.4 billion in April 2025. The multi-family segment (-$882.5 million) was the primary contributor to this decline, while the single-family component (-$85.2 million) contributed to a lesser extent.
The reduction in multi-family permit values was driven by British Columbia (-$837.4 million). The Vancouver census metropolitan area (CMA) (-$1.0 billion) drove the province's decrease, after bolstering the national multi-family component's increase during the first quarter of 2025.
The decrease in single-family construction intentions in April was most pronounced in Alberta (-$37.4 million) and was partially offset by Quebec (+$26.6 million).
Across Canada, 21,400 multi-family dwellings and 4,200 single-family dwellings were authorized for construction in April, marking a 6.5% decrease in the total number of units authorized compared with the previous month.
Chart 2: Value of building permits for the single-family and multi-family components
Description - Chart 2
Data table: Value of building permits for the single-family and multi-family components
Notes: The higher variability associated with the trend-cycle estimates is indicated with a dotted line on the chart for the current reference month and the previous three months. For more information, see the Note to readers.
Source: Table 34-10-0292-01.
Ontario leads non-residential sector gains
The total value of non-residential building permits issued in April rose by $138.2 million (+3.3%) to $4.3 billion. Growth in industrial (+$186.8 million) and commercial (+$68.6 million) construction intentions was moderated by a decline in the institutional component (-$117.2 million).
Overall, the increase in non-residential construction intentions was driven by Ontario (+$352.7 million), while British Columbia (-$341.0 million) tempered the gain.
Ontario's non-residential construction intentions rose sharply by 20.8% to $2.0 billion in April, led by the commercial component (+$259.0 million) and supported by construction intentions for office buildings in the Toronto CMA. Ontario's industrial construction intentions increased by $136.7 million, while the value of institutional permits declined by $42.9 million.
Meanwhile, the decline in British Columbia's non-residential construction intentions were widespread, with losses being mainly in the commercial (-$164.5 million) and institutional (-$158.2 million) components.
For more information on construction, please visit the Construction statistics portal.
For more information on housing, please visit the Housing statistics portal.
Chart 3: Value of building permits for the residential and non-residential sectors
Description - Chart 3
Data table: Value of building permits for the residential and non-residential sectors
Notes: The higher variability associated with the trend-cycle estimates is indicated with a dotted line on the chart for the current reference month and the previous three months. For more information, see the Note to readers.
Source: Table 34-10-0292-01.
Chart 4: Value of building permits for the industrial, commercial and institutional components
Description - Chart 4
Data table: Value of building permits for the industrial, commercial and institutional components
Notes: The higher variability associated with the trend-cycle estimates is indicated with a dotted line on the chart for the current reference month and the previous three months. For more information, see the Note to readers.
Source: Table 34-10-0292-01.
Note to readers
Unless otherwise stated, this release presents seasonally adjusted data with current dollar values, which facilitate month-to-month and quarter-to-quarter comparisons by removing the effects of seasonal variations. For information on seasonal adjustment, see Seasonally adjusted data – Frequently asked questions.
For information on trend-cycle data, see the page Trend-cycle estimates – Frequently asked questions.
Data may not add up to totals as a result of rounding.
Table 34-10-0285 has been archived and replaced by table 34-10-0292 with this release. Data from January 2018 onwards that were previously available in table 34-10-0285 remain accessible in the new table, except for the constant dollar series, which has been rebased to 2023=100.
Building components
- Single-family dwellings: Residential buildings containing only one dwelling unit (e.g., single-detached house, bungalow, linked home [linked at the foundation]).
- Multi-family dwellings: Residential buildings containing multiple dwelling units (e.g., apartment, apartment condominium, row house, semi-detached house).
- Industrial buildings: Buildings used in the processing or production of goods or related to transportation and communication.
- Commercial buildings: Buildings used in the trade or distribution of goods and services, including office buildings.
- Institutional and government buildings: Buildings used to house public and semi-public services, such as those related to health and welfare, education or public administration, and buildings used for religious services.
Revision
Data are subject to revisions based on late responses, methodological changes and classification updates. Unadjusted data have been revised for the previous month. Seasonally adjusted data have been revised for the previous three months.
Reference
Data table: 34-10-0292-01.
- Note: some data tables may best be viewed on desktop.
Definitions, data sources and methods: survey number 2802.
Previous release: Building permits, March 2025.
Next release: July 11, 2025.
Contact information
For more information, or to enquire about the concepts, methods or data quality of this release, contact us (toll-free 1-800-263-1136; 514-283-8300; infostats@statcan.gc.ca) or Media Relations (statcan.mediahotline-ligneinfomedias.statcan@statcan.gc.ca).