
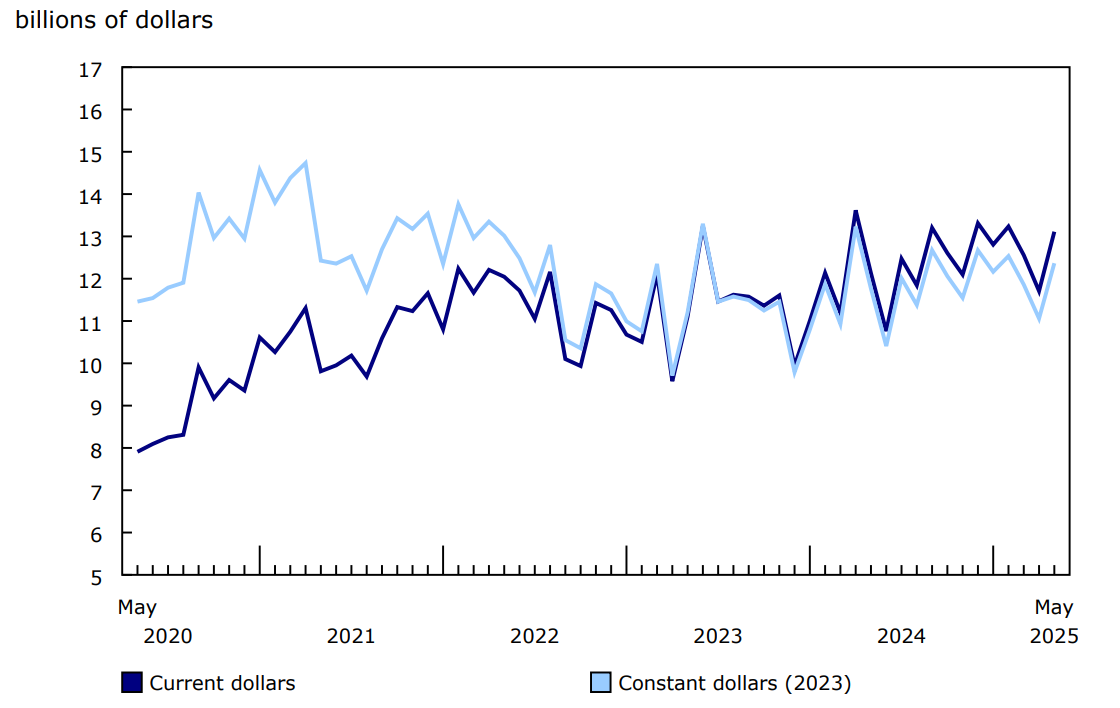
In May, the total value of building permits issued in Canada rose by $1.4 billion (+12.0%) to reach $13.1 billion. The increase in construction intentions was driven by Ontario's institutional component (+$1.3 billion).
On a constant dollar basis (2023=100), the total value of building permits issued in May increased 11.8% from the previous month and was up 5.1% on a year-over-year basis.
Chart 1: Total value of building permits, seasonally adjusted
Description - Chart 1
Data table: Total value of building permits, seasonally adjusted
Source : Table 34-10-0292-01.
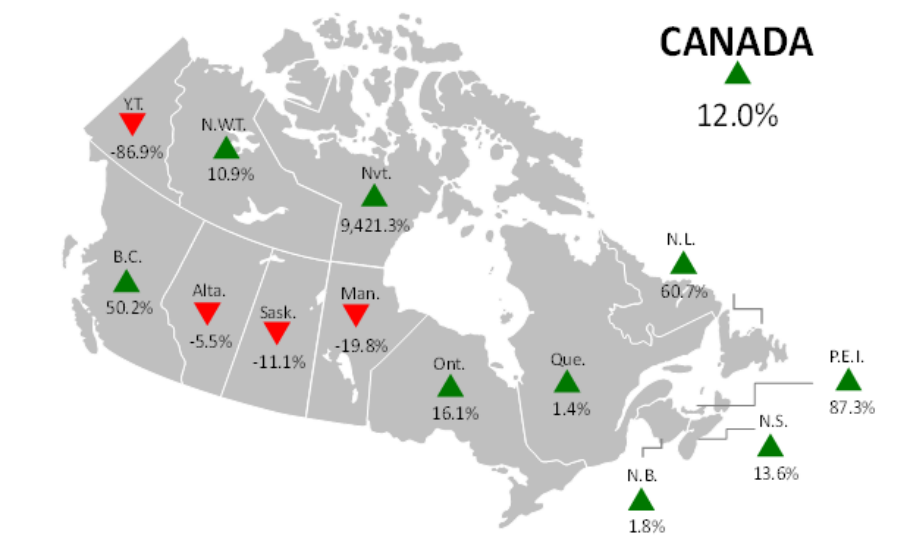
Figure 1: Month-to-month change in total value of building permits (seasonally adjusted, current dollars)
Description - Figure 1
This is a map of Canada by province and territory that shows the month-to-month percentage changes of the total building permits value. Green arrows represent an increase, while red arrows represent a decrease.
In May, building permit values in Canada were up 12.0% compared with April. Newfoundland and Labrador was up 60.7%, Prince Edward Island was up 87.3%, Nova Scotia was up 13.6%, New Brunswick was up 1.8%, Quebec was up 1.4%, Ontario was up 16.1%, Manitoba was down 19.8%, Saskatchewan was down 11.1%, Alberta was down 5.5%, British Columbia was up 50.2%, Yukon was down 86.9%, Northwest Territories was up 10.9% and Nunavut was up 9,421.3%.
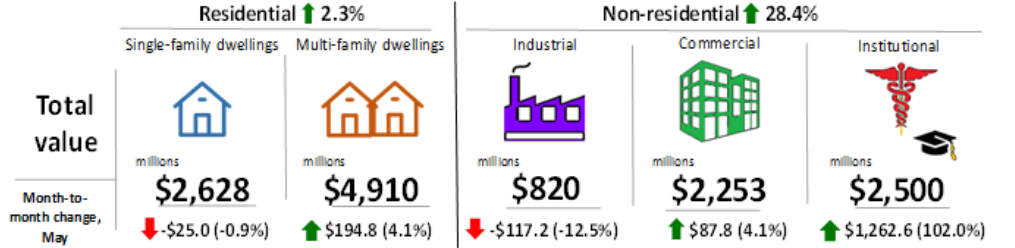
Figure 2: Building permits for residential and non-residential construction in Canada (seasonally adjusted, current dollars)
Description - Figure 2
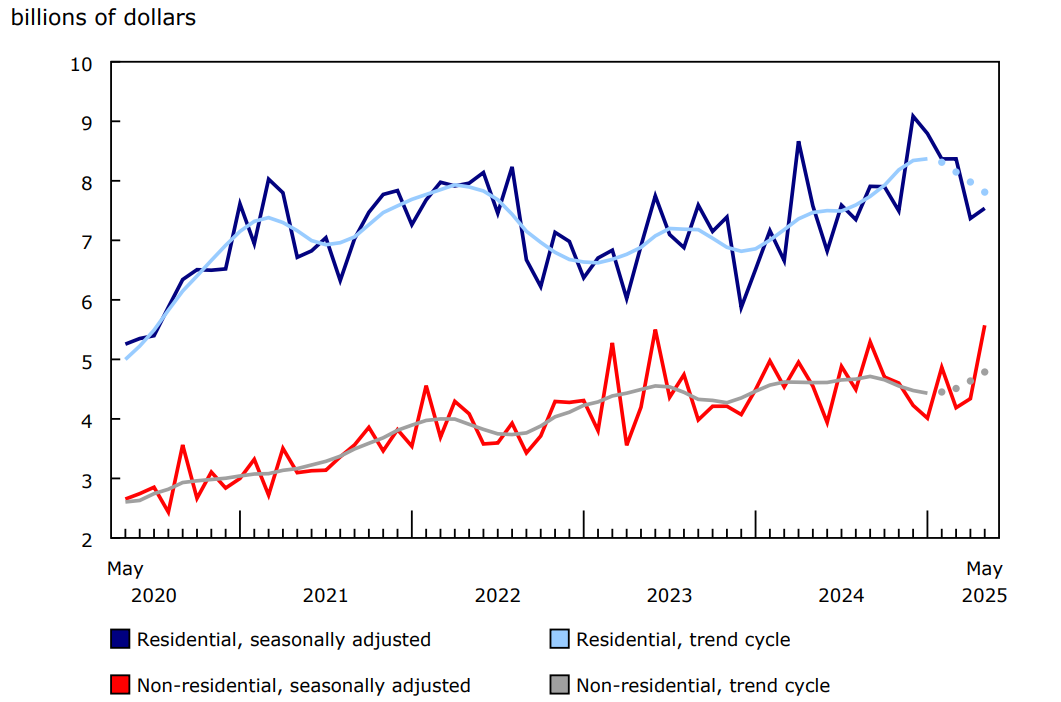
Residential: The total value was up 2.3% month over month.
Non-residential: The total value was up 28.4% month over month.
Single-family dwellings: The total value was $2,628 million, representing a month-over-month decrease of 0.9% or $25.0 million.
Multi-family dwellings: The total value was $4,910 million, representing a month-over-month increase of 4.1% or $194.8 million.
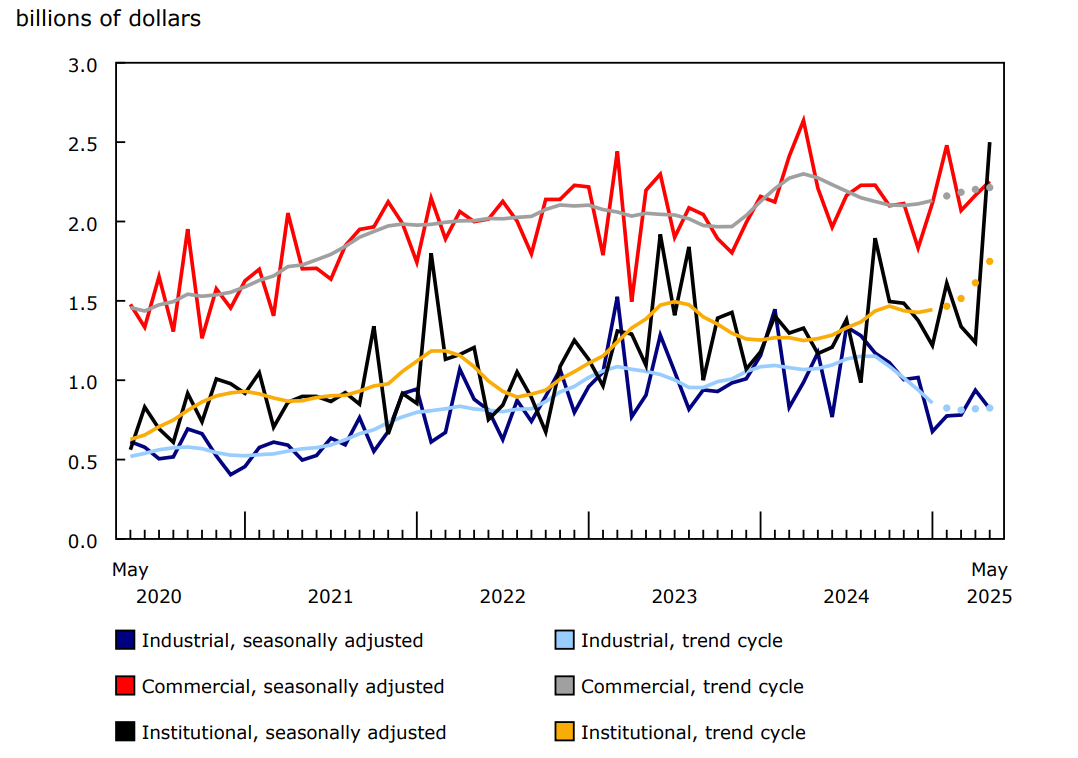
Industrial: The total value was $820 million, representing a month-over-month decrease of 12.5% or $117.2 million.
Commercial: The total value was $2,253 million, representing a month-over-month increase of 4.1% or $87.8 million.
Institutional: The total value was $2,500 million, representing a month-over-month increase of 102.0% or $1,262.6 million.
Source: Table 34-10-0292-01, Building permits, by type of building and type of work.
Ontario's institutional component drives non-residential construction intentions
The value of non-residential building permits sharply increased by $1.2 billion to $5.6 billion in May, driven by Ontario's institutional component (+$1.3 billion). Construction intentions for a new hospital in the Niagara census metropolitan area (CMA), which reached almost seven times the average value of major permits in the institutional component, led the growth in Ontario's institutional component. The hospital construction permit also drove the national institutional component upwards to a record $2.5 billion. In constant dollar terms, the institutional component also reached a series high.
Commercial permit values increased by $87.8 million to $2.3 billion in May. Quebec (+$59.1 million) led the gains recorded in eight provinces and two territories. Ontario permit values (-$71.9 million) declined the most, after contributing significantly to growth in the non-residential sector in April.
Construction intentions in the industrial component declined by $117.2 million in May; the largest decline was in Quebec (-$50.8 million), followed by decreases in six other provinces.
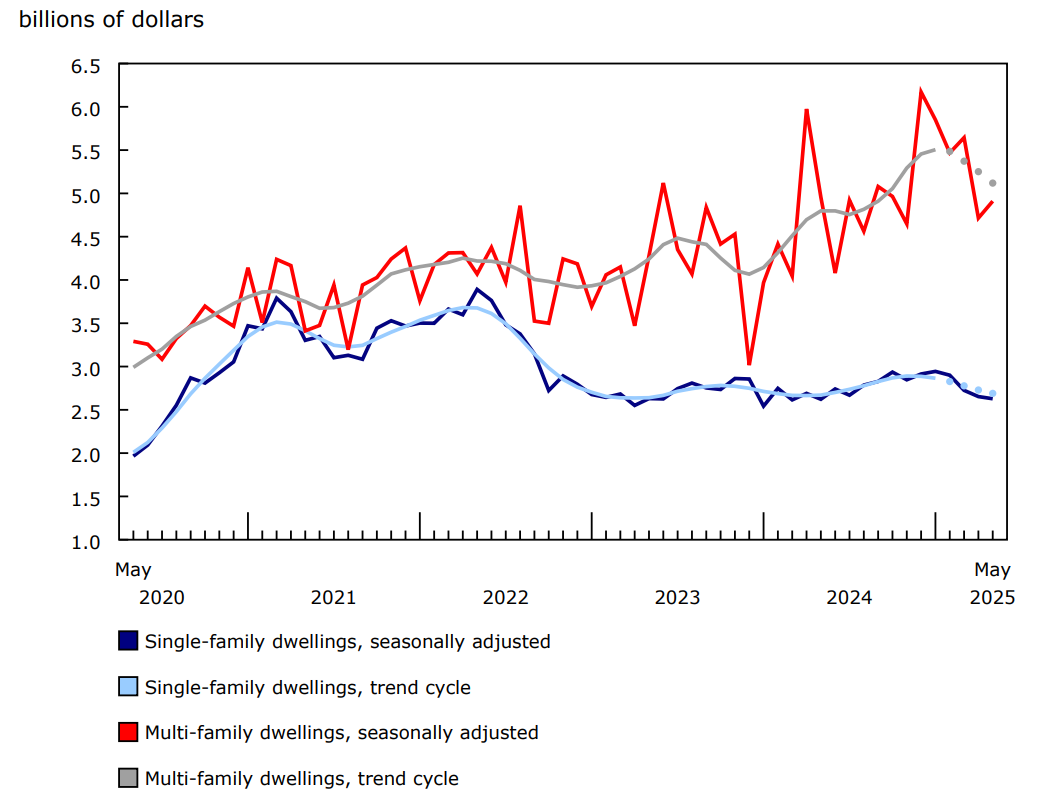
Chart 2: Value of building permits for the single-family and multi-family components
Description - Chart 2
Data table: Value of building permits for the single-family and multi-family components
Notes: The higher variability associated with the trend-cycle estimates is indicated with a dotted line on the chart for the current reference month and the previous three months. For more information, see the Note to readers.
Source: Table 34-10-0292-01.
Chart 3: Value of building permits for the residential and non-residential sectors
Description - Chart 3
Data table: Value of building permits for the residential and non-residential sectors
Notes: The higher variability associated with the trend-cycle estimates is indicated with a dotted line on the chart for the current reference month and the previous three months. For more information, see the Note to readers.
Source: Table 34-10-0292-01.
Chart 4: Value of building permits for the industrial, commercial and institutional components
Description - Chart 4
Data table: Value of building permits for the industrial, commercial and institutional components
Notes: The higher variability associated with the trend-cycle estimates is indicated with a dotted line on the chart for the current reference month and the previous three months. For more information, see the Note to readers.
Sources: Table 34-10-0292-01.
British Columbia's multi-family permits lead the residential sector
Residential construction intentions rose by $169.8 million to $7.5 billion in May. This increase was primarily led by British Columbia's multi-family component, which grew by $687.7 million to $1.5 billion.
British Columbia's multi-family component growth in May was driven by the Vancouver CMA (+$696.4 million), which rebounded after dipping in April.
Nationally, multi-family permit values increased by $194.8 million to $4.9 billion in May. Ontario's multi-family component declined by $382.8 million, counteracting part of the growth in British Columbia's multi-family component.
The value of single-family permits edged down $25.0 million to $2.6 billion in May, with the decline primarily attributed to Ontario (-$77.5 million) and mitigated by increases in seven provinces and two territories.
Across Canada, a total of 21,000 new multi-unit dwellings and 4,400 new single-family dwellings were authorized for construction in May, reflecting a slight decline of 0.2% in the total number of units authorized from the previous month.
To explore data using an interactive user interface, visit the Building permits: Interactive Dashboard.
For more information on construction, please visit the Construction statistics portal.
For more information on housing, please visit the Housing statistics portal.
Table 2: Value of building permits, by province and territory – Seasonally adjusted
Table 3: Value of building permits, by census metropolitan area – Seasonally adjusted
Note to readers
Unless otherwise stated, this release presents seasonally adjusted data with current dollar values, which facilitate month-to-month and quarter-to-quarter comparisons by removing the effects of seasonal variations. For information on seasonal adjustment, see Seasonally adjusted data – Frequently asked questions.
For information on trend-cycle data, see the page Trend-cycle estimates – Frequently asked questions.
Data may not add up to totals as a result of rounding.
Building components
- Single-family dwellings: Residential buildings containing only one dwelling unit (e.g., single-detached house, bungalow, linked home [linked at the foundation]).
- Multi-family dwellings: Residential buildings containing multiple dwelling units (e.g., apartment, apartment condominium, row house, semi-detached house).
- Industrial buildings: Buildings used in the processing or production of goods or related to transportation and communication.
- Commercial buildings: Buildings used in the trade or distribution of goods and services, including office buildings.
- Institutional and government buildings: Buildings used to house public and semi-public services, such as those related to health and welfare, education or public administration, and buildings used for religious services.
Revision
Data are subject to revisions based on late responses, methodological changes and classification updates. Unadjusted data in current dollars have been revised for the previous month; unadjusted data in constant dollars have been revised for the previous two months. Seasonally adjusted data in current dollars have been revised for the previous two months; seasonally adjusted data in constant dollars have been revised for the previous three months.
Reference
Data table: 34-10-0292-01.
- Note: some data tables may best be viewed on desktop.
Definitions, data sources and methods: survey number 2802.
Previous release: Building permits, April 2025.
Next release: August 12, 2025.
Contact information
For more information, or to enquire about the concepts, methods or data quality of this release, contact us (toll-free 1-800-263-1136; 514-283-8300; infostats@statcan.gc.ca) or Media Relations (statcan.mediahotline-ligneinfomedias.statcan@statcan.gc.ca).