

Realized net income for Canadian farmers fell by $3.3 billion (-26.0%) to $9.4 billion in 2024. This was the largest percentage decrease in realized net income since 2018. Lower farm cash receipts and slightly higher operating expenses led to the decrease in 2024. Excluding cannabis, realized net income was down 23.1% to $9.7 billion.
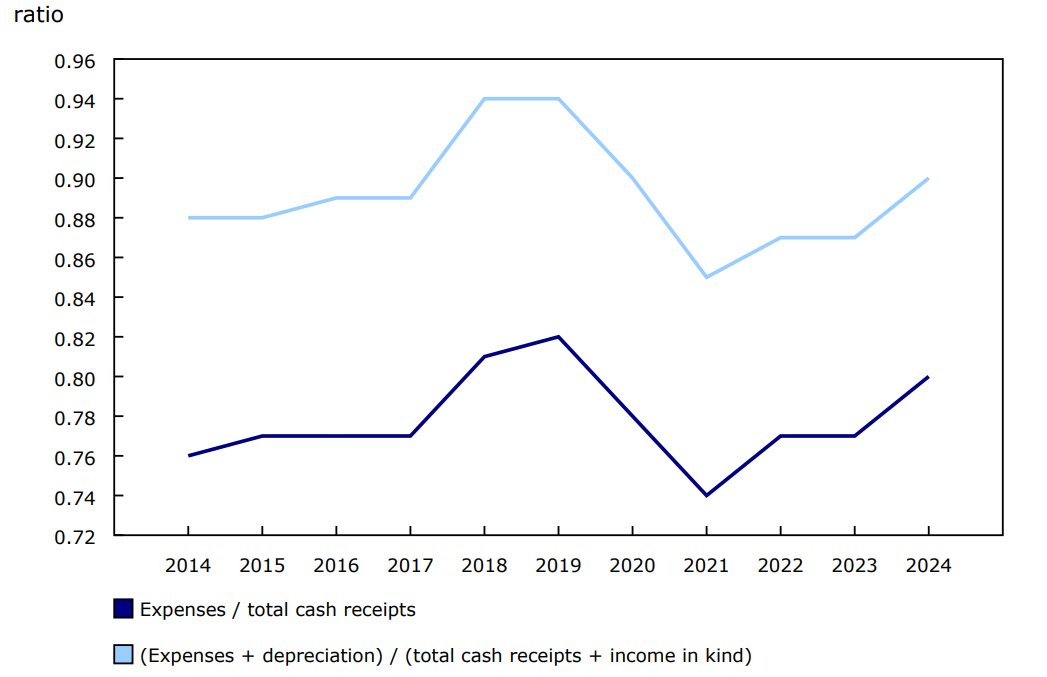
Realized net income is the difference between a farmer's cash receipts and operating expenses, minus depreciation, plus income in kind.
Chart 1: Expenses-to-receipts ratio, Canada, 2014 to 2024
Description - Chart 1
Data table: Expenses-to-receipts ratio, Canada, 2014 to 2024
Notes: Expenses / total cash receipts = Operating expenses after rebates / total cash receipts. (Expenses + depreciation) / (total cash receipts + income in kind) = (Operating expenses after rebates + depreciation) / (total cash receipts + income in kind).
Source: Table 32-10-0052-01.
Realized net income fell in every province but Newfoundland and Labrador and Nova Scotia in 2024. Saskatchewan posted the largest decline (-$1.3 billion) among the provinces, mainly due to lower crop revenues and slightly higher total farm operating expenses (+0.6%).
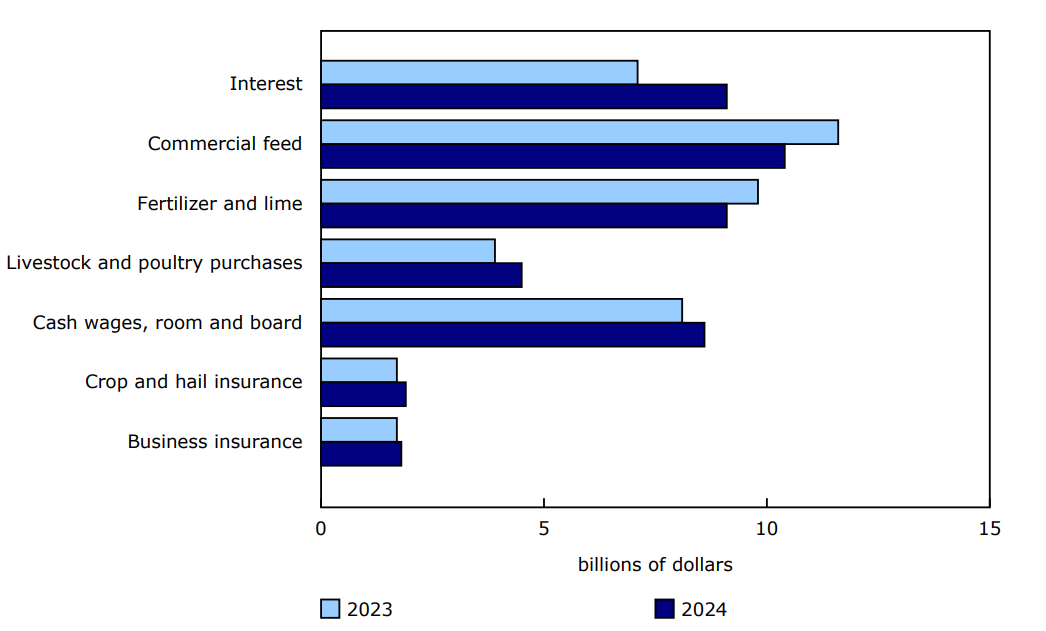
Chart 2: Rising interest costs, and livestock and poultry purchases push expenses higher, Canada, 2023 and 2024
Description - Chart 2
Data table: Rising interest costs, and livestock and poultry purchases push expenses higher, Canada, 2023 and 2024
Source: Table 32-10-0049-01.
Farm cash receipts decline for the first time since 2010
Farm cash receipts fell $1.4 billion to $98.1 billion in 2024, led by Saskatchewan (-$1.2 billion) and Manitoba (-$426.4 million).
Lower crop prices pull crop receipts down
Total crop receipts declined 6.1% to $52.2 billion in 2024, mainly on lower prices for most major grains and oilseeds. This was the largest percentage drop in crop receipts since 2003.
Prices for most major crops began to decline in 2023, following two consecutive years of strong growth, as domestic production recovered and supplies improved. Ample domestic and international supplies continued to put downward pressure on the price of grains and oilseeds in 2024, leading to lower receipts, despite higher marketings.
Crop receipts fell in six provinces in 2024, with Saskatchewan (-$1.7 billion), Alberta (-$1.1 billion) and Manitoba (-$652.5 million) reporting the largest declines.
Lower crop insurance payments push program payments down
Total direct payments to Canadian producers fell 10.8% to $5.9 billion in 2024. This was the second consecutive double-digit decline, following two years of strong increases in 2022 (+23.6%) and 2021 (+71.8%), when drought-related losses led to higher payments.
Crop insurance payments, which accounted for nearly three-fifths of total direct payments, declined 10.2% in 2024, with Alberta (-$283.9 million) and Saskatchewan (-$226.9 million) posting the largest decreases. Generally better growing conditions for some principal field crops in 2024 supported increased yields, lessening the demand for crop insurance payments.
Moderating the decrease in total direct payments in 2024 were increases in AgriStability payments (+50.5% to $600.9 million) and private hail insurance payments (+47.8% to $256.5 million).
Rising cattle prices push livestock receipts up
Livestock receipts rose 7.2% to $40.0 billion in 2024, on gains across all livestock sectors except poultry. All provinces reported higher livestock receipts.
Cattle and calves receipts were up 12.2% to $16.9 billion in 2024, accounting for more than two-thirds of the rise in total livestock receipts. The cattle market continued to record historically high prices, due to steady domestic and international demand for beef, as well as smaller herds in Canada and the United States. In 2024, average prices for cattle and calves were more than 50% above the 5- and 10-year averages.
Receipts from the supply-managed sector posted their slowest growth in four years, up 2.0% to $15.2 billion in 2024. Higher receipts from eggs (+4.2%) and unprocessed milk from bovine (+3.9%) were responsible for this gain. Conversely, receipts from turkeys for meat (-4.4%) and chickens for meat (-2.1%) were both down on lower prices. A combination of increased production and declining feed prices put downward pressure on production expenses, leading to slightly lower prices for poultry in 2024.
Total farm operating expenses rise on higher interest expenses and livestock and poultry purchases
Total farm operating expenses (after rebates) rose 2.7% to $78.5 billion in 2024.
For the second consecutive year, interest expenses led the gain in total farm operating expenses, up 28.6% in 2024 from the previous year. In response to easing inflation, the Bank of Canada began cutting its key interest rate in mid-2024 after more than two years of hikes. Producers took on more debt, driving up interest expenses. Farm debt rose 14.1% in 2024—the largest annual increase since 1981.
Chart 3: Interest expenses as a share of total operating expenses, Canada, 1981 to 2024

Description - Chart 3
Data table: Interest expenses as a share of total operating expenses, Canada, 1981 to 2024
Source: Table 32-10-0049-01.
Livestock and poultry purchases rose 16.4% to $4.5 billion in 2024. Although there were fewer cattle and hogs marketed across provincial borders compared with 2023, higher prices for these animals drove the overall increase in livestock and poultry purchases.
Commercial feed expenses moderated the increase in total farm operating expenses in 2024, falling 10.7% to $10.4 billion. Commercial feed expenses started declining in 2023, as production and supplies for most grains and oilseeds improved, following tight supplies in 2021 and 2022.
Lower prices pushed fertilizer expenses down 7.2% to $9.1 billion in 2024. Fertilizer prices continued to weaken in 2024 as supplies improved and key products involved in the production of fertilizer, such as natural gas, recorded price decreases.
Total farm expenses (after rebates), which include operating expenses (+2.7%) and depreciation (-1.3%), increased 2.2% to $88.8 billion in 2024. Total farm expenses were up in every province except Newfoundland and Labrador (-1.6%) and Manitoba (-0.9%).
Total net income declines
Total net income decreased by $4.2 billion compared with 2023 to $9.2 billion in 2024.
Total net income is realized net income adjusted for changes in farmer-owned inventories of crops and livestock. Total net income represents the return to owner's equity, unpaid farm labour, management and risk.
Excluding cannabis, total net income decreased by $3.9 billion to $9.5 billion in 2024.
Table 1: Net farm income
Table 2: Net farm income by province
Note to readers
Realized net income can vary widely from farm to farm because of several factors, including the farm's mix of commodities, prices, weather and economies of scale. This and other aggregate measures of farm income are calculated on a provincial basis employing the same concepts used to measure the performance of the overall Canadian economy. They are measures of farm business income, not farm household income.
Preliminary farm income data for the previous calendar year are first released in May of each year, five months after the reference period. Revised data are then released in November of each year, incorporating data received too late to be included in the first release. Data for the year prior to the reference period are also subject to revision.
Additional financial data for 2024, collected at the individual farm business level using surveys and other administrative sources, will be made available later this year. These data will help explain differences in the performance of various types and sizes of farms.
A summary set of farm income components excluding cannabis-related receipts and expenses is available upon request. For confidentiality reasons, non-cannabis estimates for some of the provinces are not available.
For details on farm cash receipts for the first three quarters of 2025, see the "Farm cash receipts" release in today's Daily.
For more information on agriculture and food, visit the Agriculture and food statistics portal.
Contact information
For more information, or to enquire about the concepts, methods or data quality of this release, contact us (toll-free 1-800-263-1136; 514-283-8300; infostats@statcan.gc.ca) or Media Relations (statcan.mediahotline-ligneinfomedias.statcan@statcan.gc.ca).