

Farm cash receipts in Canada totalled $73.7 billion in the first three quarters, up $2.1 billion (+2.9%) from the same period in 2024. Receipts for livestock (+$3.8 billion) rose in the first three quarters of 2025, while crop receipts (-$992.5 million) and program payments (-$658.9 million) declined.
Chart 1: Total crop, livestock and direct payment receipts as a proportion of total farm cash receipts, Canada, January to September, 2015 to 2025
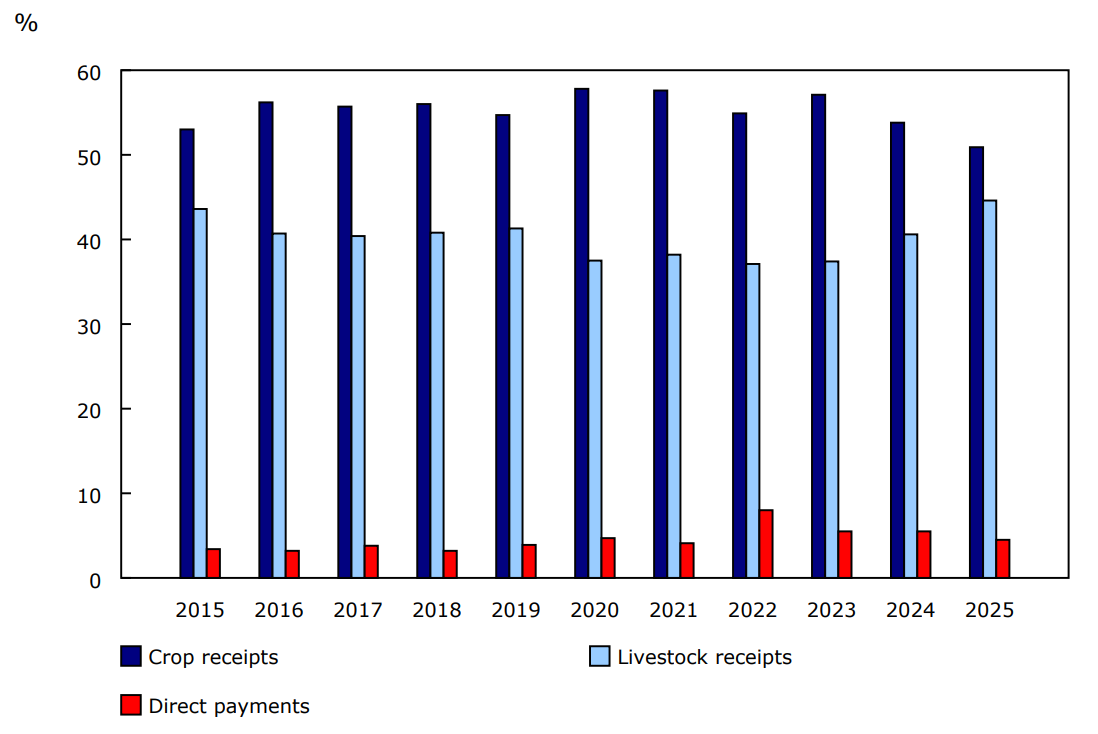
Description - Chart 1
Source: Table 32-10-0046-01.
Most provinces recorded higher farm cash receipts in the first three quarters, led by Alberta (+$1.1 billion) and Ontario (+$586.2 million), while Saskatchewan (-$433.3 million) decreased compared with the same period the previous year.
Chart 2: Farm cash receipts by category, by province or region, January to September 2025
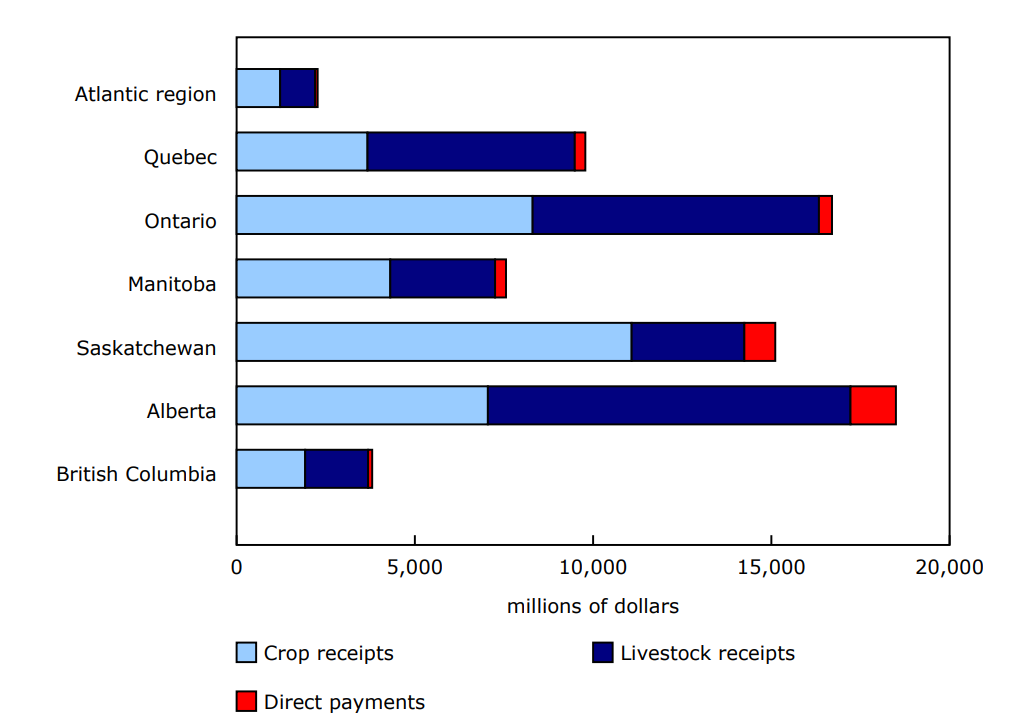
Description - Chart 2
Data table: Farm cash receipts by category, by province or region, January to September 2025
Source: Table 32-10-0046-01.
Livestock receipts up on higher prices
Total livestock receipts rose 12.9% to $32.9 billion in the first three quarters, on account of higher prices for all livestock types except poultry.
Cattle (+$2.3 billion) and hog (+$770.6 million) receipts led the increase in the first three quarters, together accounting for roughly 80% of the rise in livestock receipts. Cattle receipts were up due to higher prices (+22.6%), despite lower marketings (-1.8%) from a decline in both the number of cattle slaughtered and international exports. Hog receipts rose because of higher prices (+13.7%) and marketings (+2.4%) as strong international demand for pork products contributed to increased slaughter numbers.
Supply-managed receipts grew 3.1% to $11.7 billion in the first three quarters, representing roughly one-third of total livestock receipts. Dairy receipts (+$262.4 million) drove the increase in supply-managed receipts, caused by increases in both prices and marketings. Receipts for eggs for consumption grew $114.4 million due to increased marketings. Receipts for turkeys for meat (-$58.4 million) were down, as a reduction in the national quota caused a decline in marketings.
Lower marketings for canola drive decrease in crops receipts
In the first three quarters, crop receipts fell to $37.6 billion (-2.6%), down from the same period in 2024. Lower receipts for canola and key specialty crops drove the overall decline, while increased receipts for both durum wheat (+$275.1 million) and wheat (excluding durum) (+$116.1 million) moderated the decrease.
During the first three quarters of 2025, receipts for canola (-$845.4 million) fell compared with the same period last year on lower marketings. Tariffs imposed by China and uncertain biofuel regulations from the United States impacted the export demand for Canadian canola. Despite these market challenges, the price of canola edged up 0.5% compared with the first three quarters of the previous year, reducing the negative impact on receipts.
In 2025, tariffs on Canadian dry peas weighed on both marketings and prices compared with the same period in 2024. Receipts for dry peas fell $184.4 million (-25.2%) as international demand declined in the first three quarters of 2025.
Program payments down due to decreased crop insurance
Total direct payments dropped by $658.9 million (-16.7%) to $3.3 billion in the first three quarters. This decrease was led by Saskatchewan (-$259.6 million) and Alberta (-$192.8 million).
Crop insurance payments (-$540.6 million) accounted for over 80% of the decrease in the first three quarters, after improved growing conditions in the 2024 crop year. Saskatchewan contributed to roughly 60% of the decline in total crop insurance payments.
Table 1 : Farm cash receipts of selected commodities, Canada
Table 2: Provincial total farm cash receipts
Note to readers
Due to the US government shutdown, the transmission of international trade data has been delayed. Consequently, the international trade data used to calculate farm cash receipts has been estimated for September 2025.
Farm Cash Receipts for January to December 2025 will be released on February 26, 2026.
Preliminary estimates of net farm income for 2025 will be available on May 27, 2026.
All data in this release are in current dollars. Farm cash receipts measure the gross revenue of farm businesses. They include sales of crops and livestock products (except sales between farms in the same province) and program payments. Receipts are recorded when the money is paid to farmers. These do not represent their bottom line, as farmers must pay their expenses and loans and cover depreciation.
Farm cash receipts are, for the most part, based on monthly marketings and the monthly prices of various commodities. Marketings are quantities sold, using various units of measure.
Data are extracted from administrative files and derived from other Statistics Canada surveys and other sources. These data are subject to revision.
For details on farm cash receipts and net farm income for 2024, see the "Farm income" release in today's Daily.
For more information on agriculture and food, visit the Agriculture and Food Statistics portal.
Contact information
For more information, or to enquire about the concepts, methods or data quality of this release, contact us (toll-free 1-800-263-1136; 514-283-8300; infostats@statcan.gc.ca) or Media Relations (statcan.mediahotline-ligneinfomedias.statcan@statcan.gc.ca).