

Your municipality, your statistics
This series of articles is part of an ongoing effort by Statistics Canada to bring data to municipalities via its new Centre for Municipal and Local Data, following its established partnership with the Federation of Canadian Municipalities. Check out the first four articles in the series:
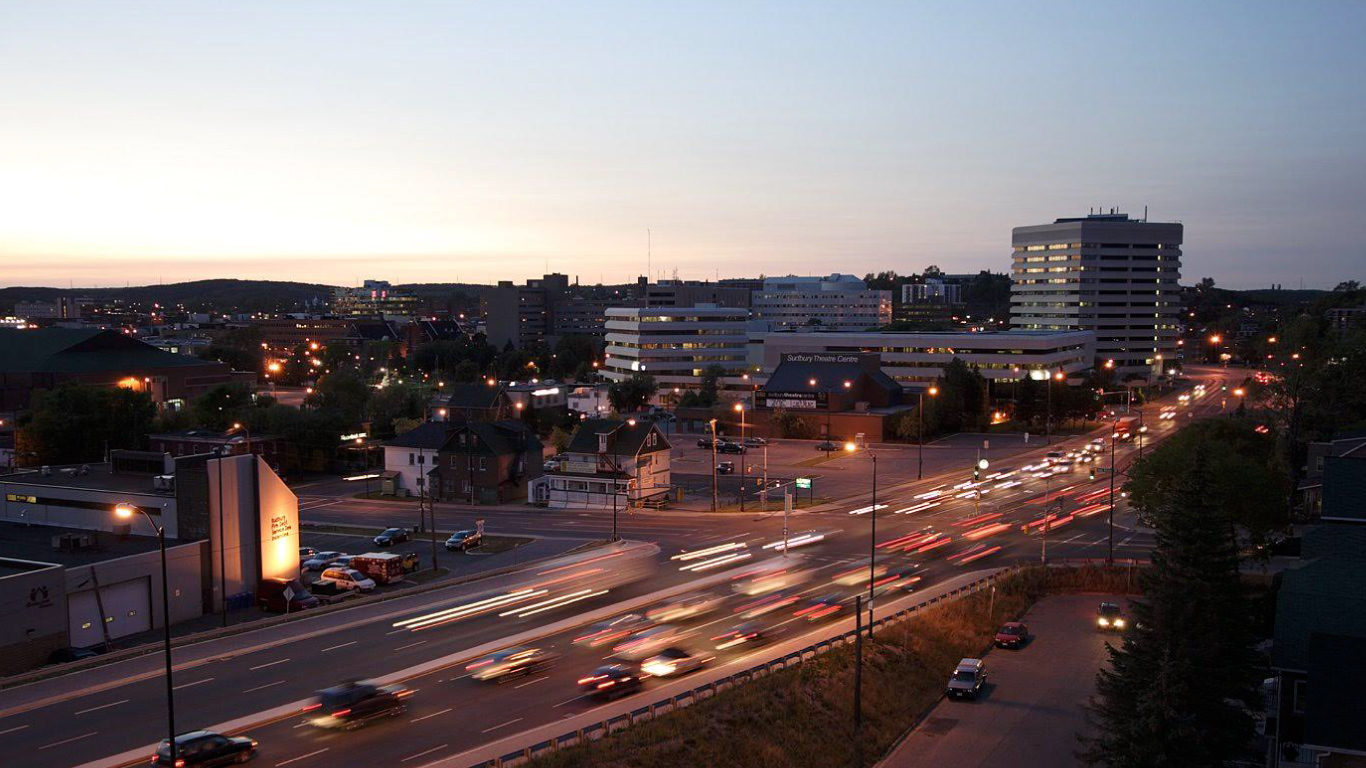
When StatsCAN Plus caught up with Kris Longston, it was in between meetings on another busy day for the Director of Planning Services for Greater Sudbury.
At 3,627 square kilometres, it’s geographically the largest municipality in Ontario, and second largest in Canada. His office is involved in everything from infrastructure, to planning subdivisions, to figuring out needs in the labour force.
Like many municipalities in the province and across the country, Sudbury uses data from Statistics Canada to help shape all sorts of decisions, big and small.
“We use StatCan data all the time, and for a wide variety of purposes,” said Longston. “Some of them are strategic in our development of official plans of our development of infrastructure. We also use it in more of a socioeconomic way when we craft policy or we’re writing grant applications, or doing neighborhood assessments.”
Like many municipalities, Greater Sudbury—a mining hub in the northeastern part of the province 390 kilometres north of Toronto—is growing. Longston said that planning updates coincide with the Census of Population.
“We update our population, household, and employment projections regularly. We usually use the year after the census. So we’re actually doing it right now,” he explained. “We update those projections every five years, and those project out about 20 years into the future—sometimes a bit further.”
“It gives us a handle on how many people can we expect, how many houses we anticipate will be built, what types of houses, (like) single-detached or apartments,” he added.
Longston said that the data can also help project how many jobs can be expected, and how much land and infrastructure will be needed to support that many years of growth.
“We’re the second largest city by geography, but our population is 170,000. So if you can imagine, we’ve got a lot of linear infrastructure because we’ve got a lot of ground to cover from that subdivision to the sewage treatment plant.”
“It’s not like Toronto or anywhere else in the GTA (Greater Toronto Area) where you’ve got a significant concentration of people,” said Longston, further explaining Sudbury’s infrastructure challenges. “They’ve got less linear infrastructure, right? Because they’ve built up—not out—and so it’s tricky for us, and we need to make sure that we have the data available to us to make informed decisions when it comes to our capital investments, and that’s where StatCan comes in for sure.”
Longston also pointed out the importance of his municipality having a land strategy—one that guides road and other infrastructure planning.
“We’ve recently completed an employment land strategy,” he explained. “And we were looking at…do we have the land needed for our growth projections for employment for the next 20 years? And then what are our infrastructure requirements, (do they) service that?
“And so a lot of the stats and the data went to that,” he added. “So I would say while roads are top of mind for everybody—and having sewer and water available, serviced—land to attract new development is probably more important than roads, even though it gets less attention, at least from the general public.”
A statistical dashboard, providing a view for greater planning
“Are you on our website right now?” Longston asked, turning the tables and asking a question of his own partway through the interview. “I’ll walk you through something really neat that we use.”
Longston guided StatsCAN Plus through the city’s interactive Demographic Data map, developed in-house by the city’s Geographic Information Systems staff and loaded with census data. Users can click on any number of tabs, such as population, income, housing, languages, or education.
Users can zoom in as closely as an individual dissemination area, the second smallest standard geographic area that StatCan tracks, with an average population of 400 to 700 people. As users zoom in or out, the data adjust simultaneously—providing an instantaneous, statistical snapshot of a particular area. (We’re honestly impressed!)
“So what this tool does, using StatCan data, is it allows us at a neighborhood level to do a real deep dive into our community,” he explained. “And in planning you’ve got the ability to use certain tools to allow the municipality to make those strategic investments called community improvement plans.”
Longston said that the data can help make the case for a stop sign, or a lower speed limit, for example. And depending on the ages of children in the community, it could dictate what type of park to build. And if a community has a higher population of seniors, a walking trail might be what is needed.
At the end of the day, it’s data that continue to factor into decisions such as these.
“StatCan data drives so many decisions and so many moves that this city makes,” said Longston. “So it’s good to draw attention to that because people might not know where that information comes from? And it’s the backbone of a lot of what we do.”
Contact information
For more information, contact the Statistical Information Service (toll-free 1-800-263-1136; 514-283-8300; infostats@statcan.gc.ca) or Media Relations (statcan.mediahotline-ligneinfomedias.statcan@statcan.gc.ca).