


The number of active businesses fell by 0.7% (-6,564) in September, marking the largest monthly drop since May 2020, and the lowest level of active businesses since July 2022. Over the third quarter of 2023, businesses continued to expect obstacles related to rising inflation (56.6%), rising cost of inputs (44.7%) and rising interest rates and debt costs (44.5%).
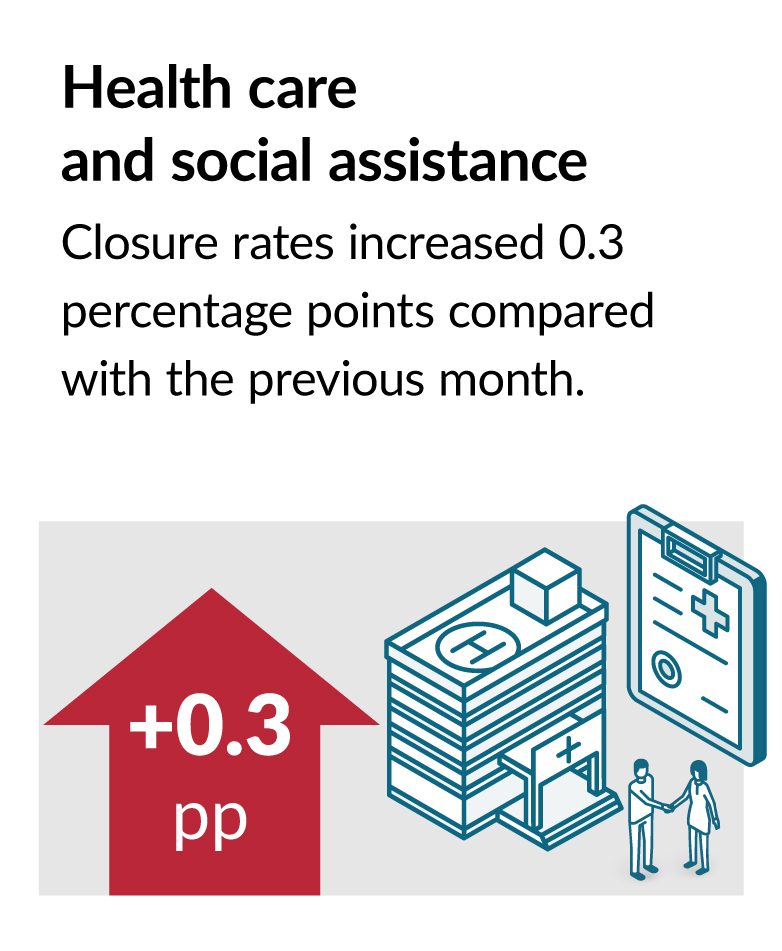
The decline in the number of active businesses in September was the result of a 0.3 percentage point increase in the closure rate to 5.0%, combined with a 0.3 percentage point contraction in the opening rate to 4.3%. In the same month, business insolvencies grew 40% compared with a year earlier.
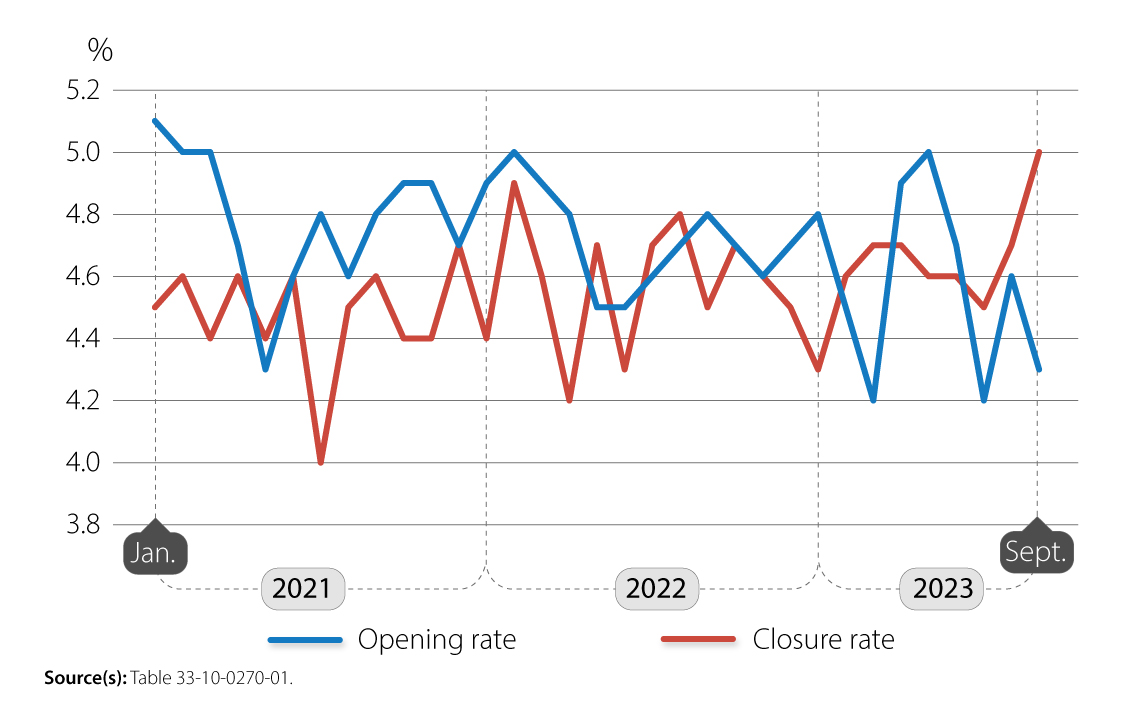
Chart 1: Monthly business openings and closures as a percentage of active businesses, business sector, January 2021 to September 2023, seasonally adjusted data
Description - Chart 1 Monthly business openings and closures as a percentage of active businesses, business sector, January 2021 to September 2023, seasonally adjusted data
The title of the chart is “Monthly business openings and closures as a percentage of active businesses, business sector, January 2021 to September 2023, seasonally adjusted data".
This is a line chart.
The vertical axis shows the rates of openings and closures, from 3.8% to 5.2%, by increments of 0.2 percentage points.
The horizontal axis shows years from January 2021 to September 2023 by increments of year.
There are two series in this chart.
The first series is Opening rate. The lowest points in this line are 4.2% in March and July 2023, and the highest point in this line is 5.1% in January 2021.
The second series is Closure rate. The lowest point in this line is 4.0% in July 2021, and the highest point in this line is 5.0% in September 2023.
Source(s): Table 33-10-0270-01.
Businesses with 1 to 4 employees accounted for 83.3% of openings and 83.9% of closures in September, while those with 5 to 19 employees accounted for 13.0% of openings and 14.0% of closing businesses.
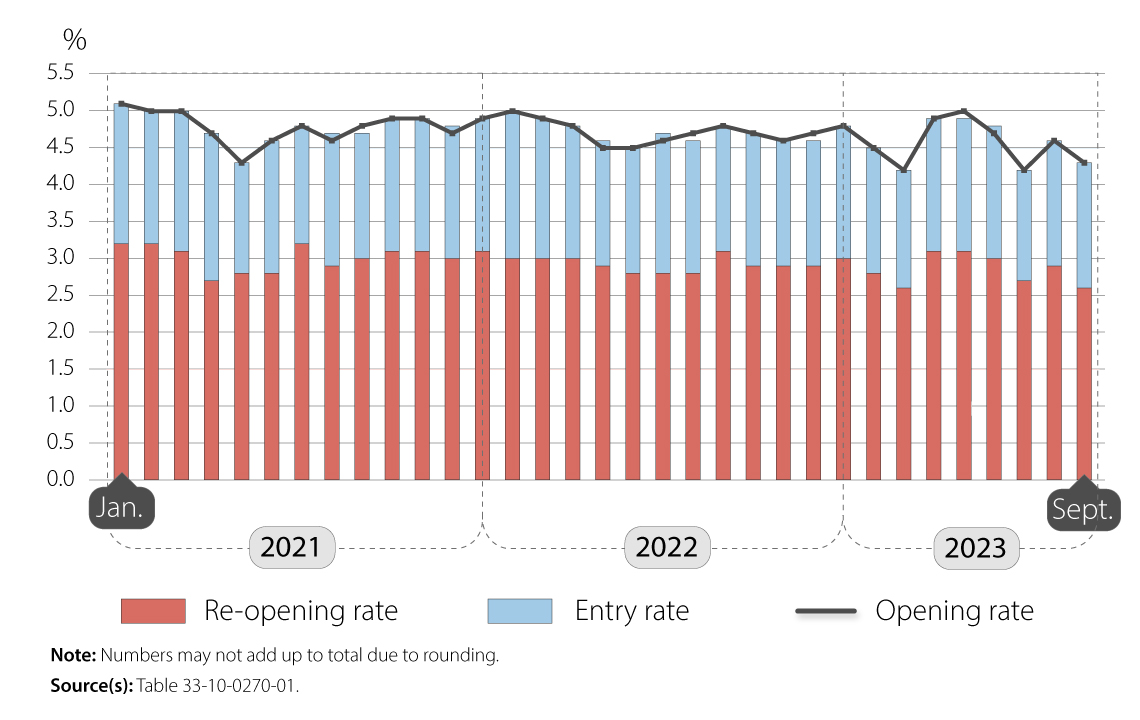
The decrease in the opening rate was entirely driven by the 0.3 percentage point drop in the re-opening rate (-2.6%). The entry rate remained unchanged at 1.7%.
Chart 2: Business opening rate and its components, business sector, January 2021 to September 2023, seasonally adjusted data
Description - Chart 2: Business opening rate and its components, business sector, January 2021 to September 2023, seasonally adjusted data
The title of the chart is “Business opening rate and its components, business sector, January 2021 to September 2023, seasonally adjusted data”.
This is a vertical stacked bar chart with line.
The vertical axis represents the % rate.
The vertical axis starts at 0.0% and goes to 5.5%, with increments of 0.5 percentage points.
The horizontal axis represents the month and year and goes from January 2021 to September 2023.
There are three series. The first series represents the re-opening rate. The second series represents the entry rate. The third series represents the opening rate.
At period January 2021, the first series is at 3.2%, the second series is at 1.9% and the third series is at 5.1%.
At period February 2021, the first series is at 3.2%, the second series is at 1.8% and the third series is at 5.0%.
At period March 2021, the first series is at 3.1%, the second series is at 1.9% and the third series is at 5.0%.
At period April 2021, the first series is at 2.7%, the second series is at 2.0% and the third series is at 4.7%.
At period May 2021, the first series is at 2.8%, the second series is at 1.5% and the third series is at 4.3%.
At period June 2021, the first series is at 2.8%, the second series is at 1.8% and the third series is at 4.6%.
At period July 2021, the first series is at 3.2%, the second series is at 1.6% and the third series is at 4.8%.
At period August 2021, the first series is at 2.9%, the second series is at 1.8% and the third series is at 4.6%.
At period September 2021, the first series is at 3.0%, the second series is at 1.7% and the third series is at 4.8%.
At period October 2021, the first series is at 3.1%, the second series is at 1.8% and the third series is at 4.9%.
At period November 2021, the first series is at 3.1%, the second series is at 1.8% and the third series is at 4.9%.
At period December 2021, the first series is at 3.0%, the second series is at 1.8% and the third series is at 4.7%.
At period January 2022, the first series is at 3.1%, the second series is at 1.8% and the third series is at 4.9%.
At period February 2022, the first series is at 3.0%, the second series is at 2.0% and the third series is at 5.0%.
At period March 2022, the first series is at 3.0%, the second series is at 1.9% and the third series is at 4.9%.
At period April 2022, the first series is at 3.0%, the second series is at 1.8% and the third series is at 4.8%.
At period May 2022, the first series is at 2.9%, the second series is at 1.7% and the third series is at 4.5%.
At period June 2022, the first series is at 2.8%, the second series is at 1.7% and the third series is at 4.5%.
At period July 2022, the first series is at 2.8%, the second series is at 1.9% and the third series is at 4.6%.
At period August 2022, the first series is at 2.8%, the second series is at 1.8% and the third series is at 4.7%.
At period September 2022, the first series is at 3.1%, the second series is at 1.7% and the third series is at 4.8%.
At period October 2022, the first series is at 2.9%, the second series is at 1.8% and the third series is at 4.7%.
At period November 2022, the first series is at 2.9%, the second series is at 1.7% and the third series is at 4.6%.
At period December 2022, the first series is at 2.9%, the second series is at 1.7% and the third series is at 4.7%.
At period January 2023, the first series is at 3.0%, the second series is at 1.8% and the third series is at 4.8%.
At period February 2023, the first series is at 2.8%, the second series is at 1.7% and the third series is at 4.5%.
At period March 2023, the first series is at 2.6%, the second series is at 1.6% and the third series is at 4.2%.
At period April 2023, the first series is at 3.1%, the second series is at 1.8% and the third series is at 4.9%.
At period May 2023, the first series is at 3.1%, the second series is at 1.8% and the third series is at 5.0%.
At period June 2023, the first series is at 3.0%, the second series is at 1.8% and the third series is at 4.7%.
At period July 2023, the first series is at 2.7%, the second series is at 1.5% and the third series is at 4.2%.
At period August 2023, the first series is at 2.9%, the second series is at 1.7% and the third series is at 4.6%.
At period September 2023, the first series is at 2.6%, the second series is at 1.7% and the third series is at 4.3%.
Note(s): Numbers may not add up to total due to rounding.
Source(s): Table 33-10-0270-01.
The increase in the overall closure rate was driven by health care and social assistance (17.9% of the overall increase; +344 closures), construction (12.4%; +238) and professional, scientific and technical services (12.1%; +232).
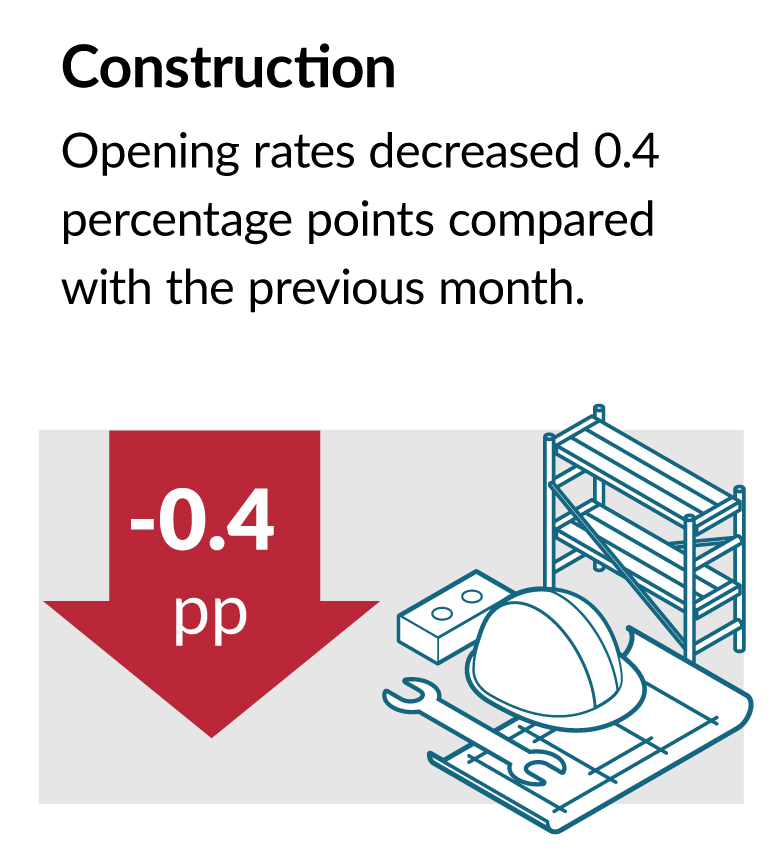
Construction (19.5% of the overall decrease; -478 openings) led the decline in the business sector opening rate, followed by professional, scientific and technical services (11.9%; -292) and accommodation and food services (11.8%; -288).
Chart 3: Percent contribution of sectors to the fall in openings and the rise in closures, August to September 2023, seasonally adjusted data
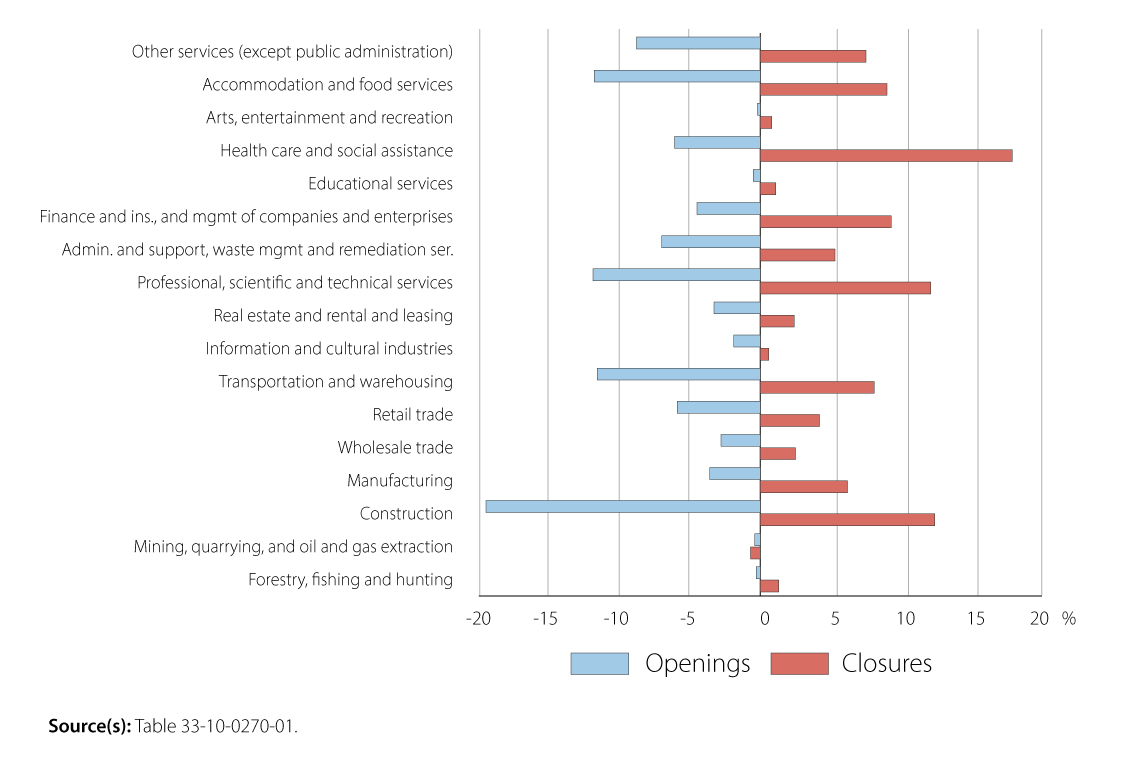
Description - Chart 3: Percent contribution of sectors to the fall in openings and the rise in closures, August to September 2023, seasonally adjusted data
The title of the chart is “Percent contribution of sectors to the fall in openings and the rise in closures, August to September 2023, seasonally adjusted data".
This is a horizontal bar chart.
The horizontal axis shows the percent contribution of sectors to changes in both business openings and closures from August to September 2023. The horizontal axis goes from -20% to 20% by increments of 5 percentage points.
The vertical axis shows the sectors.
There are two series of bars for each sector. The blue bar represents the opening rate, and the orange bar represents the closure rate.
The first set of bars represents the other services (except public administration) sector where the opening rate was at -8.8% and the closure rate at 7.5%.
The second set of bars represents the accommodation and food services sector where the opening rate was at -11.8% and the closure rate at 9.0%.
The third set of bars represents the arts, entertainment and recreation sector where the opening rate was at -0.2% and the closure rate at 0.8%.
The fourth set of bars represents the health care and social assistance sector where the opening rate was at -6.1% and the closure rate at 17.9%.
The fifth set of bars represents the educational services sector where the opening rate was at -0.5% and the closure rate at 1.1%.
The sixth set of bars represents the finance and insurance, and management of companies and enterprises sector where the opening rate was at -4.5% and the closure rate at 9.3%.
The seventh set of bars represents the administrative and support, waste management and remediation ser. sector where the opening rate was at -7.0% and the closure rate at 5.3%.
The eighth set of bars represents the professional, scientific and technical services sector where the opening rate was at -11.9% and the closure rate at 12.1%.
The ninth set of bars represents the real estate and rental and leasing sector where the opening rate was at -3.3% and the closure rate at 2.4%.
The 10th set of bars represents the information and cultural industries sector where the opening rate was at -1.9% and the closure rate at 0.6%.
The 11th set of bars represents the transportation and warehousing sector where the opening rate was at -11.6% and the closure rate at 8.1%.
The 12th set of bars represents the retail trade sector where the opening rate was at -5.9% and the closure rate at 4.2%.
The 13th set of bars represents the wholesale trade sector where the opening rate was at -2.8% and the closure rate at 2.5%.
The 14th set of bars represents the manufacturing sector where the opening rate was at -3.6% and the closure rate at 6.2%.
The 15th set of bars represents the construction sector where the opening rate was at -19.5% and the closure rate at 12.4%.
The 16th set of bars represents the mining, quarrying, and oil and gas extraction sector where the opening rate was at -0.4% and the closure rate at -0.7%.
The 17th set of bars represents the forestry, fishing and hunting sector where the opening rate was at -0.3% and the closure rate at 1.3%.
Source(s): Table 33-10-0270-01.
The series on temporary business closures and exits (or "permanent closures") is now updated to include data up to March 2023
The exit rate held steady in March for a third consecutive month at 1.9%, 0.2 percentage points above its historical average of 1.7%.
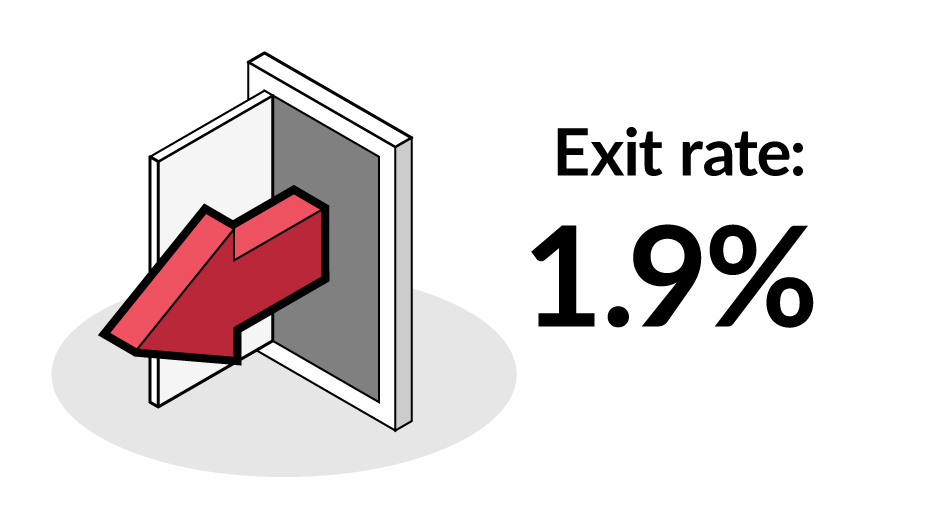
Mining, quarrying and oil and gas extraction (2.4% exit rate; +0.5 percentage points compared to February) was the lone sector with a notable change in the exit rate from February to March 2023.
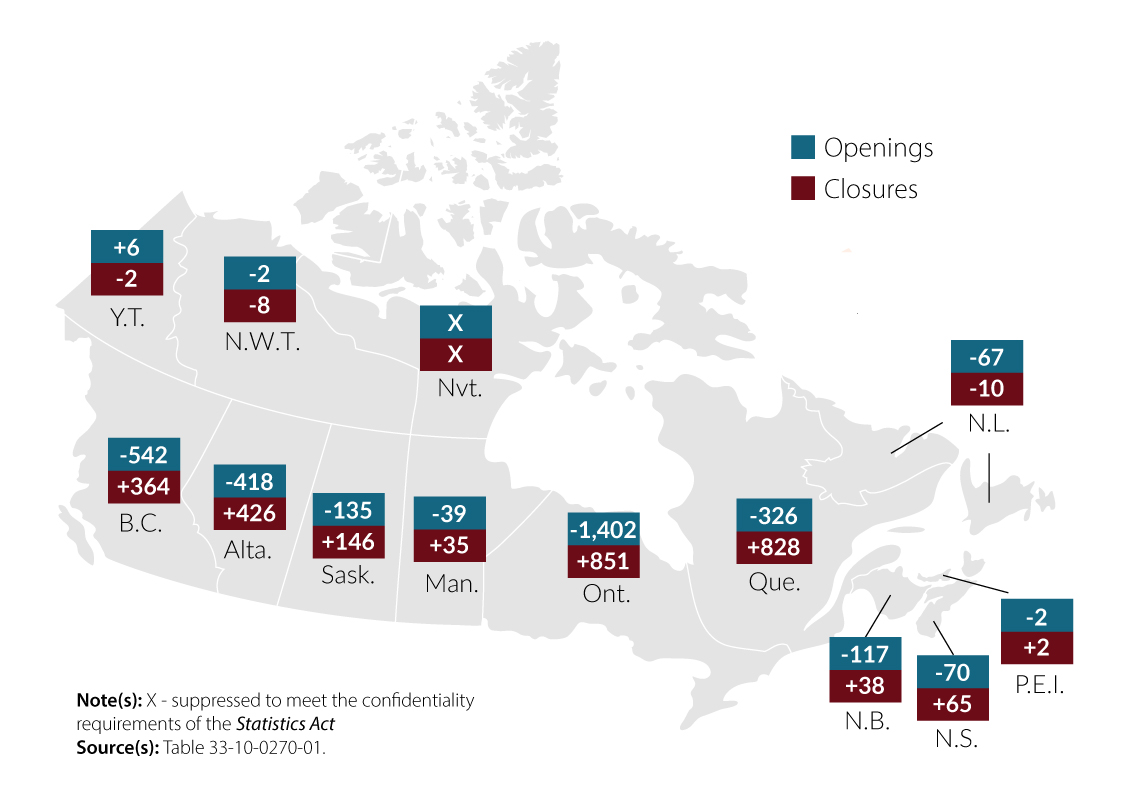
Map 1: Change in the number of business openings and closures by province and territory from August to September 2023, seasonally adjusted data
Description - Map 1: Change in the number of business openings and closures by province and territory from August to September 2023, seasonally adjusted data
The title of the map is "Change in the number of business openings and closures by province and territory from August to September 2023, seasonally adjusted data".
This is a map of Canada by province and territory showing the change in business openings and in business closures from August to September 2023.
In Newfoundland and Labrador, the number of business openings decreased by 67 and the number of business closures decreased by 10.
In Prince Edward Island, the number of business openings decreased by 2 and the number of business closures increased by 2.
In Nova Scotia, the number of business openings decreased by 70 and the number of business closures increased by 65.
In New Brunswick, the number of business openings decreased by 117 and the number of business closures increased by 38.
In Quebec, the number of business openings decreased by 326 and the number of business closures increased by 828.
In Ontario, the number of business openings decreased by 1402 and the number of business closures increased by 851.
In Manitoba, the number of business openings decreased by 39 and the number of business closures increased by 35.
In Saskatchewan, the number of business openings decreased by 135 and the number of business closures increased by 146.
In Alberta, the number of business openings decreased by 418 and the number of business closures increased by 426.
In British Columbia, the number of business openings decreased by 542 and the number of business closures increased by 364.
In Yukon, the number of business openings increased by 6 and the number of business closures decreased by 2.
In the Northwest Territories, the number of business openings decreased by 2 and the number of business closures decreased by 8.
The change in business openings and closures in Nunavut is X, or not available.
Note(s): X means "suppressed to meet the confidentiality requirements of the Statistics Act".
Source(s): Table 33-10-0270-01.
Related products
Definitions, data sources and methods
Previous release
Data tables
- Experimental estimates for business openings and closures for Canada, provinces and territories, census metropolitan areas, seasonally adjusted
- Experimental estimates for business openings and closures by employment size for Canada, provinces and territories, census metropolitan areas, seasonally adjusted
StatsCAN app
Did you know you can read StatsCAN Plus articles and more on the StatsCAN app? If you’re already using the app, let us know what you think by leaving a review in the Apple App Store and Google Play.
Contact information
For more information, contact the Statistical Information Service (toll-free 1-800-263-1136; 514-283-8300; infostats@statcan.gc.ca) or Media Relations (statcan.mediahotline-ligneinfomedias.statcan@statcan.gc.ca).