
Household spending declines

Archived Content
Information identified as archived is provided for reference, research or recordkeeping purposes. It is not subject to the Government of Canada Web Standards and has not been altered or updated since it was archived. Please "contact us" to request a format other than those available.
Related information
In 2010, Canadian households reported average total expenditures of $70,574. Of this, 75.1% was spent on goods and services, while income taxes, gifts, insurance premiums and pension contributions accounted for the remainder (24.9%).
Households with the lowest income reported total spending of $28,583 in 2010. In contrast, households with the highest income spent $139,001.
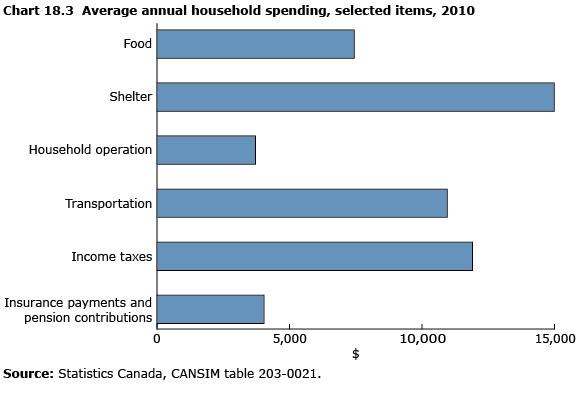
Of the $53,016 that households spent on goods and services, 28.3% was on shelter, 20.7% on transportation and 14.0% on food. Spending on clothing represented 6.5% of the total, health care, 4.1%, and communications, 3.3%.
On average, couples with children spent the most on goods and services ($74,126). The lowest spending was by one-person households ($30,563).
Provincially, the highest average spending on goods and services was by households in Alberta ($61,134). Households in Prince Edward Island ($44,856) reported the lowest spending.
- Date modified: