3. Human capital, urban amenities and employment growth

Archived Content
Information identified as archived is provided for reference, research or recordkeeping purposes. It is not subject to the Government of Canada Web Standards and has not been altered or updated since it was archived. Please "contact us" to request a format other than those available.
In this chapter, we investigate the correlates of long-run employment growth in North American cities. Our tabulations are based on a panel of 242 cities constructed from the Canadian and U.S. Censuses of Population. Data on Canadian cities are derived from 1981, 1991 and 2001 Canadian Census files and data on U.S. cities are obtained from the 1980, 1990 and 2000 U.S. Census files. These data sources provide detailed information on the locational, educational and occupational characteristics of different classes of workers.
Our base measure of urban growth is the change in total paid employment from 1980 to 2000. Following Lucas (1988) and Glaeser (1994), we posit that differences in long-run urban growth depend on variations in the amount of human capital found in different cities, evaluated in the initial period. In what follows, we measure the importance of human capital in two ways. First, we use a general indicator of human capital based on the number of degree holders located in different urban areas in 1980 and 1981. This provides us with a broad-based measure of skilled labour at the onset of the analysis period.
Second, we examine the contribution to growth made by more specialized types of skilled labour. To do this, we divide our estimates of urban degree holders into different subgroups based on their occupational characteristics. These include (1) degree holders employed in science and engineering (S&E) occupations, (2) degree holders employed in cultural and heritage occupations, and (3) the residual category of degree holders employed in all other (non-S&E and non-cultural) occupations. These estimates of specialized labour (scientists and engineers and culture workers) are constructed using occupational taxonomies developed by the National Science Foundation and Statistics Canada.4 For a description of S&E occupations and cultural occupations, see Tables 1 and 2.
Table 1
Science and engineering occupations
Taken together, scientists and engineers and people employed in culture occupations closely parallel what Florida describes as the core of the 'creative class' (see Florida 2002a, 328). The main difference between Florida's creative class and our specialized group of scientists and engineers and cultural labour is that we define this occupational group strictly in terms of degree holders throughout the analysis. We also test for the effect of including workers in these occupations without degrees.
Our growth models control for a range of urban amenities that proxy basic differences in the attractiveness of specific locations. We have estimated amenities both directly and indirectly. Following Glaeser, Kolko and Saiz (2001), amenities can be estimated indirectly by examining the willingness of consumers to pay for housing relative to income levels. They argue that, on the margin, variation in housing prices, while conditioning on income levels, will reflect variation in amenities across cities.
Accordingly, we constructed an amenities index from 1980 and 1981 census data using data on median housing values and median income for residents of owner-occupied dwellings.5 The basic premise would be that after conditioning on household income, variation in home prices across cities would be a function of the relative attractiveness of these places. Hence amenities (A) would be given by
where HP is the house price and E(HP) is the expected house price conditioning on income I:
The residuals obtained from (1.2) yields a continuous ranking of cities based on the estimated variation in urban amenities.
We evaluated our amenities index by correlating it with more direct measures of amenities from other data sources. These included measures of climate, violent crime and culture employment.6 Two variables are used to measure the variation in temperature conditions across cities. The first is a city-specific measure of heating-degree days, the accumulated average daily temperature below 18 degrees Celsius, expressed as a daily average. The second is the analogous measure of cooling-degree days—the accumulated average daily temperature above 18 degrees Celsius, again converted to a daily average. Both climate variables are constructed using temperature data from the last 30 years.
Our amenities index is negatively correlated with heating degree days and positively correlated with the size of cultural employment (see Appendix A, Table A2). Murder rates, our proxy for violent crime, were not correlated with our amenities index. Each of these relationships was apparent when we regressed our amenities index against the set of direct measures.7
These correlations suggest the index is able to capture various amenities, and because it can capture a host of amenities that are difficult to measure directly—for example, quality of schools—it may be better than more direct measures. However, because this is a 'residual' measure, it is vulnerable to the effect of other factors that might affect house prices after conditioning on income levels. For instance, if individuals with higher levels of human capital have a preference for amenities and the presence of human capital and restrictions on housing supply are correlated, we may find a significant correlation between our amenities index and human capital that is an artefact of how the index was constructed. Keeping this in mind, we also substitute more direct measures of amenities for the amenities index to test the consistency of our models.
Our basic urban growth model posits that the long-run variation in employment growth across cities depends on initial differences in human capital and urban amenities. In Table 3, we report differences in average employment growth among cities with different human capital and amenity profiles.8 We classify our sample into cities that fall above and below the median, based separately on the share of employment accounted for by degree holders, the share of employment accounted for by degree holders in S&E occupations, the share of employment accounted for by degree holders in cultural occupations, and the value of the amenities index. Each of the human capital variables was measured in 1980 and 1981. We report average annual growth rates for cities in each stratum, along with rates at different points in the distribution of growth rates.
Table 3
Average annual employment growth rate, 1980 to 2000, by select
classification variable
The average annual rate of employment growth for cities in our sample is 1.8%. Cities with larger concentrations of degree holders—measured as a percentage of the local employment base—have, on balance, experienced faster employment growth—2.0% per annum—than cities with smaller relative concentrations of degree holders—1.6%. These differences may appear to be small but, due to compound growth, over the 20-year study period a city that grew at 2% would grow by 49%, while a city with a growth rate of 1.6% would grow by a more modest 37%. Substantial differences in average growth occur when classifying cities on the basis of cultural employment and urban amenities. Smaller differences in average growth are apparent when stratifying cities on the basis of their S&E employment shares. This result runs counter to our expectation that cities with a strong science and engineering base would see significantly stronger growth than cities without. As will become apparent in the multivariate analysis to follow, the relationship between S&E employment and growth is much more nuanced.
The quantile estimates in Table 3 suggest that large differences in growth rates often occur at the lower end of the growth distribution. Low-growth cities with above-median concentrations of degree holders exhibit stronger growth—0.7% per annum at the 10th percentile and 1.2% at the 25th percentile—than do low growth cities with below-median concentrations of degree holders—0.1% and 0.7%, respectively. When our sample is stratified on the basis of S&E employment shares, larger differences in growth rates are only apparent at the 10th percentile. However, these are not statistically significant. More sizable differentials occur at all points in the growth distribution when classifying cities on the basis of cultural workers or amenities. In general, the quantile estimates suggest higher ranks across the various correlates of growth, while not guaranteeing spectacular growth rates, do serve to insulate cities from excessively low growth rates—in effect, they act as a floor.
The bivariate tabulations in Table 3 suggest that long-run differences in employment growth across cities are correlated with underlying differences in skilled labour and urban amenities, evaluated in the initial period. Below, we examine the strength of these relationships via a series of regressions. Six different specifications are reported in Table 4. These reflect different approaches to modelling the contribution of human capital to growth and the inclusion of different control variables.9
In all models we estimate employment growth as a function of initial conditions:
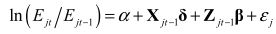
where E is employment indexed by year t and Xt is a vector of human capital characteristics and Zt is a vector of other urban characteristics (e.g., amenities). We utilize the natural logarithm of employment growth in order to de-emphasize the effect of high rates of growth, which are often associated with relatively small units, on the regression coefficients. As noted above, other studies that have attempted to control for the endogeneity of human capital and growth have shown the positive association between human capital (usually, as measured by the share of degree holders) on growth to be highly robust. Thus we estimate the model under the assumption that endogeneity is not an issue, at least as it applies to our human capital variables. All continuous variables in Table 4—and Equation (1.3)—are expressed in their natural logarithmic form.
The first specification (Column 1) estimates employment growth on degree share. In this simple bivariate regression, human capital is positively associated with growth, with an estimated elasticity of 0.18. Column 2 then controls for the variation in heating- and cooling-degree days— two direct measures of urban amenities that are clearly exogenous to the growth process. Heating-degree days are negatively associated with employment growth, while the effect of cooling-degree days is insignificant. The estimated elasticity on degree share declines slightly to 0.16, but remains significant.10
In Column 3, we evaluate the impact of more specialized types of human capital on employment growth by dividing degree holders into three mutually exclusive subgroups: degree holders in S&E occupations, degree holders in culture occupations, and other degree holders. As in Column 2, we control for the variation in heating- and cooling-degree days. None of these occupational subgroups exerted a significant impact on growth. It should be noted, however, that these occupational subgroups are highly correlated with one another. The S&E share and the culture share have a correlation coefficient of 0.60, while the correlation between the other degree variable and the S&E and culture shares is 0.56 and 0.78, respectively.11 It is also worth noting that the other degree variable is almost perfectly correlated with the original degree share, as the occupational categories omitted from this other degree variable—scientists, engineers and other cultural workers—represent a very small percentage of employed degree holders.
Column 3 assumes that these different types of skilled labour contribute separately to growth. In Column 4, we posit that the overall contribution of any one group of employed degree holders depends on its interaction with other groups. Following Jacobs (1969), we posit that growth requires a diversity of complementary skills. Naturally, this suggests we should interact the shares of workers across our three groups. Four interaction terms are included that evaluate the importance of different human capital combinations: three that focus on cross-products between science and engineers, cultural workers and other degree holders; and one that captures the joint product of all three groups.
The interpretation of the coefficients on the human capital terms requires some explanation. When these interaction terms are included in the model, the partial effect of a change in any one category (e.g., other degree holders) on growth depends both on its direct contribution and on the indirect contributions that stem from interactions between this group of interest and other types of skilled labour. Hence the impact of changes in other degree holders (odh) on growth can be expressed in general terms as

where all variables have been transformed into their natural logarithmic form. In this formulation β1 is the coefficient on the other degree holders term, and β2 and β3 capture the indirect contributions that scientists and engineers and cultural workers, respectively, have in determining the overall impact of other degree holders on growth. Similarly, β4 measures the joint interaction between these two groups.
This interactive model yields better evidence that differences in human capital are correlated with long-run employment growth after controlling for differences in climate. The coefficient on the other degree holder term is positive and significant, and the interaction between S&E degree holders and other degree holders is significant at the 6% level of confidence. As before, heating- degree days is negatively associated with growth.
In Column 5, we re-estimate the interaction model in Column 4 with additional controls. Two of these—population size in 1980 and an index of industrial diversity in 198012—are designed to control for the general relationship between agglomeration economies and growth. The log of population is intended to capture the effect of urban size on static agglomeration economies (e.g., the impact of shared infrastructure assets on productivity). Industrial diversity is included to capture Jacob's dynamic urbanization economies, which have been identified by others as important drivers of growth (see Quigley 1998 for a review of this literature). We also include binary variables for Canada and capital city (country, province or state) to capture country- specific effects (e.g., demographics and immigration policies) and the influence of the seats of local or national government on growth.
The inclusion of these controls reduces the coefficients on the human capital variables. Only those on the non-interacted S&E and degree holder shares, and on their interaction term, remain significant at the 10% level. Employment growth is negatively associated with city size and heating degree days, and is more apparent in Canadian cities. It is only weakly influenced by industrial diversity, which is somewhat surprising, because other studies have found a significant and positive effect. However, we are already capturing part of the effect of industrial diversity through our interaction terms for the degree holder variables. It should also be kept in mind that the variation in industrial diversity across cities is relatively small for cities over 100,000 in population. Most of the increase in industrial diversity occurs as cities increase in size from 10,000 to 100,000 (see Beckstead and Brown 2003).
Columns 2 through 5 provide some evidence that the long-run growth of cities is influenced by climate, as, other things equal, cities with more heating-degree days exhibit slower employment growth. The elasticity estimate on heating-degree days, at about 0.1, is robust to changes in specification. In contrast, cooling-degree days have no effect on employment growth in any of our models. In Column 6, we replace these two direct measures with the indirect amenities index that we obtained from regressing housing prices on income (Equation [1.2]). As noted earlier, this derived index is designed to measure a broad cross-section of urban amenities—in effect, the amalgam of all factors (physical, social or cultural) that together affect the perceived attractiveness of different cities. This index variable has an estimated elasticity of 0.3, which provides much stronger evidence that differences in urban amenities are correlated with growth.
Substituting this amenities measure for the two climate variables better isolates the relationship between human capital and growth. The coefficients on S&E-degree holders, other-degree holders, and their interaction term are all positive and significant, while the joint product of all degree subgroups is positive and weakly significant. These interaction terms measure complementarities—the gains associated with combining different types of skilled labour. The positive interaction between S&E workers and other-degree holders suggests that cities with large concentrations of both types of workers may, other things being equal, exhibit faster growth than those that specialize more in one or the other type. We can estimate the net contribution of any one group of skilled workers by solving out the direct and indirect effects in a manner consistent with Equation (1.4).
When we evaluate each of the log degree shares at their respective medians, other degree holders have the strongest estimated effect on employment growth. The implicit elasticity associated with other-degree holders is 0.2. This stands in sharp contrast to the implicit elasticities of -0.06 and -0.04 that we obtain for S&E and cultural workers, respectively. These latter two estimates suggest that there is very little direct relation between these specific kinds of human capital and employment growth.
Table 4
Urban employment growth, 1980 to 2000
In contrast, the positive interaction term between scientists and engineers and other degree holders suggests that changes in the amount of S&E employment may exert a stronger impact on growth through its impact on the other degree group. To see this, we re-calculate the implicit elasticity associated with other-degree holders, this time evaluating the log science and engineering term at the 10th and 90th percentile of the distribution—raising the S&E share of employment from 0.7% to 2.7%. The impact on the net elasticity associated with other-degree holders was substantial, reducing the net estimate from 0.20 to -0.04 for a share of scientists and engineers at the 10th percentile, while increasing it to 0.45 at the 90th percentile. This suggests that the importance of scientists and engineers is best measured through their impact on broader forms of human capital. However, it is important to keep in mind that these calculations are based on point estimates. The confidence interval around these may be quite high.
Florida has argued that workers that comprise the 'creative class'—especially those that constitute the creative core (scientists and engineers and culture-based occupations)—have a particularly strong influence on growth. He also argues that 'bohemians' (which are largely made up the cultural component of the creative class) have an abnormally strong effect on growth. Florida's assertions have been countered by Glaeser (2004). Glaeser shows that there is no independent effect of either the creative class or bohemians on growth, after controlling for the share of degree holders. Our findings suggest that we should take a more nuanced view of the relationship between particular types of human capital and growth. That is, it is the broad set of degree holders that consistently drive growth, but the effectiveness of this group is enhanced when combined with a higher share of scientists and engineers. There is less evidence that culture occupations, on their own or through interactions with other forms of human capital, have a particularly strong impact on growth. The general conclusion to be drawn here is that it is not only the prevalence of human capital in a city that matters, but the mix as well.13 In the next chapter, we extend our analysis of human capital by asking what factors help fuel the growth of a city's science and engineering workforce.
4. For an overview of the science and engineering classifications, see Beckstead and Gellatly (2006); for culture and heritage occupations, see Statistics Canada (2004).
5. Note that since we are comparing data on house prices and employed incomes from Canada and the United States, we had to convert data denominated in Canadian dollars to U.S. dollars. We did so by purchasing power parity prices.
6. Data were obtained from Environment Canada (www.on.ec.gc.ca) and the National Oceanic and Atmospheric Administration (NOAA) (www.noaa.gov) for the climate variables, Statistics Canada and the FBI for violent crime, and the Canadian and U.S. Censuses for culture employment.
7. We also examined a series of more sophisticated regression models to measure amenities that took into account other factors that might affect housing prices, such as negative shocks to employment. We found that the amenities indexes derived from these estimates provided qualitatively similar results, and thus we utilized the simpler model.
8. Descriptive statistics on these variables are found in Appendix A, Table A1.
9. For correlation tables, see Appendix A, Table A2.
10. These two climate variables exhibit very little correlation with our human capital variables (see Appendix A, Table A2).
11. All correlations are estimated using the natural logarithmic transformation of these shares; see Appendix A, Table A2.
12. We utilize an entropy-based measure of industrial diversity given by:
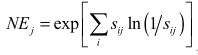 , where sij is
the share of employment in industry i in metropolitan
areas j. The NE is interpreted as the number
of industries that would be present in a metropolitan area if
employment were evenly distributed across all industries.
, where sij is
the share of employment in industry i in metropolitan
areas j. The NE is interpreted as the number
of industries that would be present in a metropolitan area if
employment were evenly distributed across all industries.
13. We also examined whether our results are robust to one other major definitional issue concerning our measures of specialized human capital—the impact of modifying our definitions of workers in S&E and cultural occupations to include non-degree holders as well as degree-holders. This has a relatively small impact on the scope of our science and engineering definition—as the vast majority of S&E workers possess university degrees. But is has a major impact on the scope of the cultural definition, as non-degree holders represent a much larger percentage of workers in cultural occupations. We evaluated these changes by again re-estimating our final specification, Column 6 in Table 4, using these modified definitions. On balance, these changes had little impact on the estimated relationships.
- Date modified: