
Data science plays an important role at Statistics Canada. All across the agency, new data science methods are being used to make our projects more efficient and provide better data insights to Canadians.

Statistics Canada has been working on projects to help in the fight against COVID-19.
Project categories
- Natural language processing
- Image classification
- PDF extraction
- Predictive analytics
- Research
- Framework


Contact the Centre for Artificial Intelligence Research and Excellence (CAIRE) for more information on Statistics Canada's data science projects.
Natural language processing
Event Detection and Sentiment Indicators

Statistics Canada is developing a tool to detect specific economic events by analyzing millions of news articles. The tool uses machine learning algorithms to research and summarize information from the articles and organize the data into an informative dashboard. Time that was once spent on research can now be spent analyzing the reasons for economic changes.
The agency is also exploring the development of sentiment indicators to measure economic tendencies and their connection with key economic variables. Based on positive and negative interpretations of economic-related news articles, these indicators could allow subject matter experts to gain better insights into economic trends by industry, and support the publication of near real-time economic indicators.
Retail Scanner Data
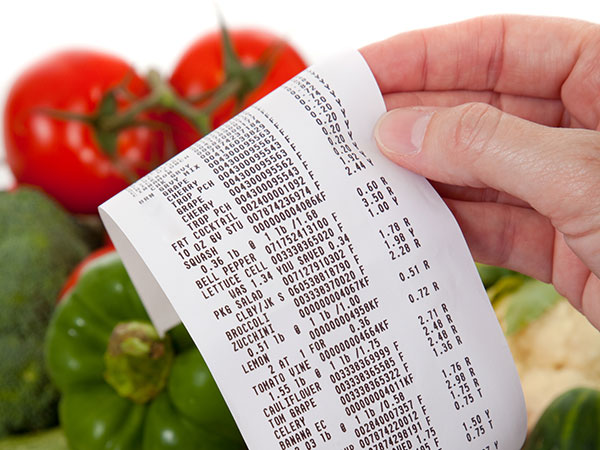
Statistics Canada publishes the total amount of products sold, as classified by the North American Product Classification System (NAPCS). Large scanner data bases are currently available from major retailers, with millions of records. Previously, products were assigned to NAPCS with dictionary-based coding in combination with manual coding when required, according to their description and other indicators. Statistics Canada uses machine learning to classify all of the product descriptions in the scanner data to the NAPCS and then obtains aggregate sales for each area. This approach has resulted in higher degree of automation, as well as in accurate, detailed retail data and a reduced response burden for major retailers.
Survey of Sexual Misconducts in the Canadian Armed Forces Comment Classification

Data scientists at Statistics Canada created a machine learning model to automatically classify the electronic comments from respondents of the Survey of Sexual Misconduct in the Canadian Armed Forces (SSMCAF). The SSMCAF required automated classification of comments into five categories: personal story, negative, positive, advice for content, and other. The machine learning model coded 6,000 comments from the first 2018 survey cycle with 89% accuracy for French and English comments. This approach will be expanded to other surveys at Statistics Canada.
Census 2021 Comments Classification

Statistics Canada has developed a machine learning algorithm to classify 1.8 million French and English respondent comments from the 2021 Census. This algorithm quickly and objectively classifies comments into different classes. The model is trained on comments from the 2016 Census and the 2019 Census test. Respondent feedback is used to support decision making regarding content determination for the next census and to monitor factors such as respondent burden.
Canadian Coroner and Medical Examiner Database (CCMED) Dynamic Topic Modelling

Statistics Canada has designed and deployed a dynamic topic modelling system. This system uses data from the Canadian Coroner and Medical Examiner Database to detect emerging narratives on causes of death. The objective is to provide analysts with patterns of death over time.
Canadian Export Reporting System Text Classification
The Canada Border Services Agency (CBSA) and Statistics Canada recently developed a new web-based reporting tool for Canadian exporters to non-US countries called the Canadian Export Reporting System (CERS). CERS requires that an exporter self-code their goods' Harmonized System (HS) code plus an additional text description for more information for CBSA. The Data Science Division, in partnership with the International Accounts and Trade Division (IATD), developed a FastText machine learning model to classify the additional text descriptions for the exported commodities to the HS codes so that IATD can use them to validate the self-coded HS codes provided by the exporters. The motivation for adding this validation is that analysis of the data from the previous systems revealed inconsistencies between the product description and the code chosen by the exporter. With the move to CERS, electronic reporting is now mandatory and may result in an increase of cases with such inconsistencies, which is why an automated solution for review is being developed.
Image classification
In-Season Crop Classification
Monitoring the production of farms in Canada is an important but costly undertaking. Surveys and in-person inspections require a large amount of resources, and the current approach to predicting crop yields is time-consuming. For these reasons, Statistics Canada is modernizing crop classification using an image classification approach. An automated pipeline is used to download and process freely available Landsat-8 satellite imagery throughout the crop season.
Crop types are predicted using satellite imagery and the application of neural networks. The new model estimations are then used to update a database, allowing end users to acquire the most up-to-date estimates throughout the crop season. Initial results show that this approach is much faster and will reduce the survey response burden for farm-owners, especially during the busy times of the year.
Geo-Spatial Construction Starts Using Satellite Images
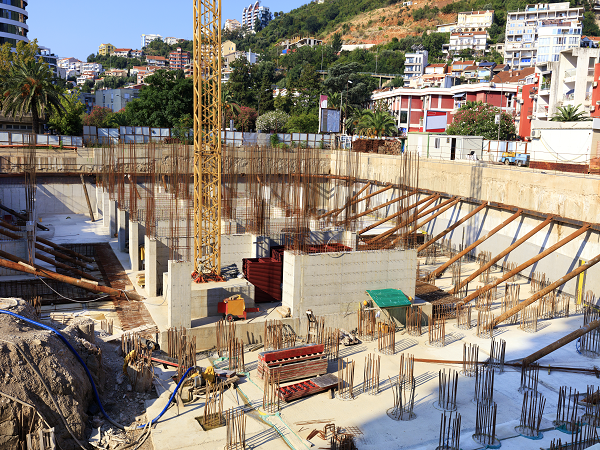
Canadian Mortgage and Housing Corporation tracks the starts and completions of residential building construction projects across Canada, and results are used by Statistics Canada to calibrate estimates for its Investment in Building Construction program. Statistics Canada has been employing various data science methods to detect construction starts from satellite images, such as using image augmentation to diversify and increase the data set. These methods enabled data scientists to detect the area of the building in the pre-foundation and foundation phase. The process of pre-foundation consists of creating footings and concrete slabs to support the foundation walls, including excavation. The foundation is part of a structural system that supports and anchors the superstructure of a building. AI model building and evaluation required the processing of more than 1,400 km2 imagery of 50cm resolution over many months for which a highly scalable and efficient processing pipeline was created. The developed artificial intelligence algorithms might eventually lead to more accurate and timely data, while aiding in eliminating existing data gaps for the non-residential sector and small/remote communities excluded from the current survey.
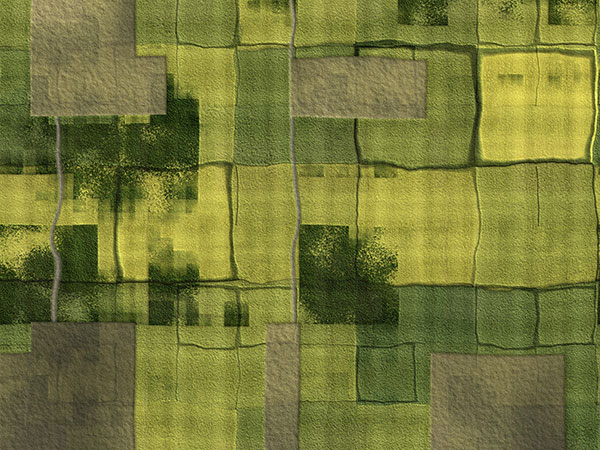
Agriculture Greenhouse Detection Using Aerial Images
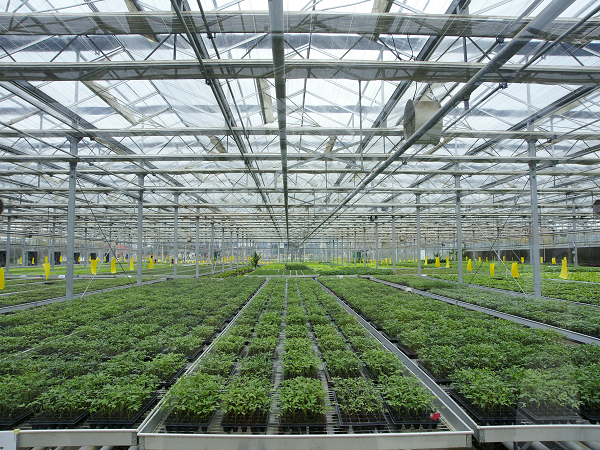
The greenhouse project has been using Earth Observation data to identify greenhouses and measure their total area in Canada, in addition to a proof of concept to determine our ability to classify greenhouses based on their produce inside of the greenhouses, and the type of greenhouses (Glass or plastic cover). In an effort to produce more timely estimates and reduce the need for survey respondents, data scientists at Statistics Canada are working to automate the identification process using machine learning, administrative data sources and other technologies, such as satellite imagery and high resolution aerial imagery.
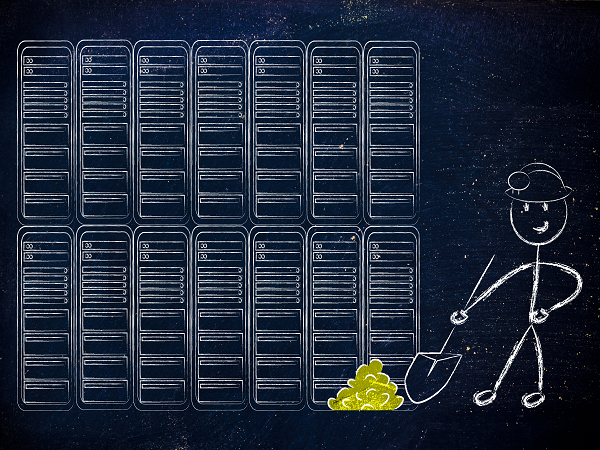
PDF extraction
Extraction of Economic Variables from Financial Reports

Statistics Canada has been applying data science solutions to extract information from PDFs and other documents in a timely and more efficient manner. For example, Statistics Canada has been experimenting with the historical dataset for SEDAR, a system used by publicly-traded Canadian companies, to file securities documents to various Canadian securities commissions.
Statistics Canada's data scientists developed a state-of-the-art machine learning pipeline that correctly identifies and extracts key financial variables (e.g. total assets) from the correct table (e.g. balance sheet) in an annual financial statement of a company. The algorithm used for table extraction called SLICE (Spatial Layout-Based Information and Content Extraction) was developed within Statistics Canada and made open-source under MIT license. SLICE is a unique computer vision algorithm that simultaneously uses textual, visual and layout information to segment pages into a tabular structure. The pipeline therefore turns a large amount of unstructured public documents from SEDAR into structure datasets, allowing the automation of information extraction related to Canadian companies. This significantly reduces the manual hours spent identifying and capturing the required information and reduces data redundancy within the organization by providing a one-point solution to access information.
Public Sector Statistics Division Scanned PDF Extraction
Public Sector Statistics Division (PSSD) at Statistics Canada receives financial statements from provincial governments and their respective municipalities on a quarterly and annual basis. These statements are in text-based and scanned PDF format, and store valuable information in tables. Each row of the table contains numerical values which must be manually extracted and stored in a database for further analysis, but this manual process is time-consuming and subject to human error. Data scientists at Statistics Canada developed a proof-of-concept that involves extracting financial data from reported financial statements using an in-house machine learning algorithm and displaying them in a tabular format that can be edited by the analysts. Additionally, the data is auto-coded and records of previous and current year numerical values are provided. Once the project transitions to production, it will reduce data redundancy within the organization by providing a one-point solution to access information, as well as save manual work hours identifying and capturing required information by analysts in the PSSD.
Predictive Analytics
Nowcasting of Economic Indicators

Many initiatives at Statistics Canada work towards near real-time estimates and the production of advanced indicators for many of the agency's key data series. In the Investment in Building Construction Program building permit values are a key series for which an early indicator via nowcasting could be produced. To facilitate the effort, an analytical cloud environment was created which allows analysts to leverage timely external data and advanced time series models. An extensive time series database with economic time series (from Statistics Canada programs), external open data, temperature sensor data and stock market data were created. This environment may potentially pave the way towards a generalized Nowcasting System at Statistics Canada. Exploratory analysis was conducted to apply nowcasting models including ARIMA-X, PROPHET and the machine learning algorithm XGBoost in nowcasting several economic indicators including monthly building permit values. It was found that ARIMA-X and PROPHET performed similarly in terms of mean absolute percentage error and mean directional accuracy while XGBoost with external open data did not perform as well.
Crop Yield Predictions

Statistics Canada recently completed a research project for the Field Crop Reporting Series (FCRS) on the use of machine learning , specifically supervised regression techniques, for early-season crop yield prediction. The objective was to investigate whether this could be used to improve the precision of the existing crop yield prediction method, while also reducing the survey response burden for busy farm operators. The main contribution of the research project was the adaptation of rolling window forward validation (RWFV) as validation protocol. RWFV is a special case of forward validation, a family of validation protocols designed to prevent temporal information leakage for supervised learning based on time series data. Our adaptation of RWFV enabled a customized validation protocol that realistically reflects the statistical production context of the FCRS.
Hospital Occupancy Forecast
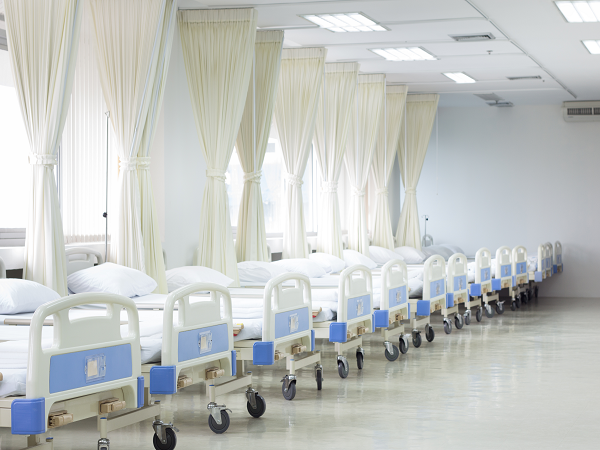
Data scientists at Statistics Canada are helping in the fight against COVID-19 by creating short-term hospital occupancy forecasts based on two daily inputs using Ottawa hospital data as a testcase. The inputs are daily new hospital admissions counts and hospital midnight in-patient headcounts. Admission Forecasts are determined by using two hierarchical Bayesian models. The first input models the random delay between the unobserved event of COVID-19 infection and hospital admission, for the subgroup of infected individuals who will be hospitalized due to COVID-19. The second input models the random delay between hospital admission and discharge/death.
A series of 25 consecutive weeks of mock forecasts based on real data was performed to assess the effectiveness of the forecast model. The resulting credible bands, on the one hand, encompassed consistently the real hospitalization counts within one week after the respective training data cut-offs, and on the other hand, were sufficiently narrow to be informative. The results of this project strongly suggest the feasibility of accurate and informative hospitalization forecasts at the municipality level, provided timely hospital admission and discharge/death data are available.
High Pandemic Hubs
Data scientists at Statistics Canada created a research project using a general machine learning framework to identify and predict health regions that could be considered vulnerable or at high-risk of increased COVID-19 infection rates. By identifying these regions, federal and provincial health authorities would be able to divert public health resources such as PPE or frontline workers from lower risk regions to higher risk regions; and would also able to contain cases in higher risk areas sooner with contact tracing and quarantine measures.
This effort also contributed to the creation of an interactive dashboard that could allow users to monitor COVID-19 cases and deaths at the health-region level and to choose among multiple risk prediction models and approaches.
Using COVID-19 Epidemiological Modelling to Inform Personal Protective Equipment Supply and Demand in Canada

At the beginning of the pandemic, there were concerns surrounding Personal Protective Equipment (PPE) preparedness in Canada and whether there was enough supply to support the healthcare sector, and other sectors of the economy throughout the pandemic. In response to this emerging need, Statistics Canada customized an existing epidemiological model to allow policy makers to stress-test the PPE supply under various epidemiological scenarios. Projections generated from this epidemiological model have been used by the PPE supply and demand model to compare on-hand and in-bound supplies with demand projections over twelve months.
Optimal Social Distancing Policy via Reinforcement Learning

Data scientists at Statistics Canada collaborated with the Public Health Agency of Canada to develop a novel epidemiological modelling framework optimizing Non-Pharmaceutical Interventions using Reinforcement Learning. This model determines the best set of population behaviours to minimize the spread of an infection within simulations.
Research
Statistics Canada's First Quantum Machine Learning Project: A collaboration with Université de Sherbrooke

Quantum computing—a new way of computing that uses principles of quantum mechanics to store and process information—holds a lot of promise as a solution for some computationally heavy processes and algorithms. Increasingly, governments and major companies are working to assess how quantum computing will impact their businesses in the near future.
As of June 2021, Statistics Canada is collaborating with the Université de Sherbrooke to explore the potential of quantum computing and identify opportunities early on in its development. The six month-long project marks the first collaboration between Statistics Canada and the Quantum Hub at Université de Sherbrooke's Institut quantique (IQ). The Quantum Hub offers its members cloud-based access to advanced quantum computing systems, as well as a community of experts to support quantum research projects.
The project will explore ways to optimize the agency's machine learning processes and text classification computations, and how this technology could be used to support Statistics Canada's goal of providing high-quality data and insights to Canadians.
Homomorphic Encryption

Data security remains one of the highest priorities at Statistics Canada. Our data scientists are training a machine learning text classifier to use homomorphic encryption to protect data while they're being processed. The data are protected at two points. The first point, located at their ingestion points, allows data files to be processed remotely or on the cloud. The second point is at their dissemination points–this allows accredited external researchers at virtual labs access to more data in a secure manner. The use of homomorphic encryption not only ensures data protection but also acts as a solution for outsourcing computation.
A Novel Estimation Method for Non-Probability Samples
Probability samples allow reliable estimation of population characteristics and have been successfully used in statistics for many decades. However, due to rising costs and declining response rates, researchers have begun to develop theory for reliable estimation based on alternative data sources. Non-probability samples, such as web-based opt-in panels, are often relatively easy and inexpensive to obtain, but may suffer from severe self-selection bias where traditional estimation techniques cannot be applied. To help with this, researchers at Statistics Canada have developed nppCART, a novel estimation methodology for non-probability samples. nppCART attempts to correct for the self-selection bias by incorporating additional information from an auxiliary probability sample. nppCART is a variant of the well-known CART algorithm, and may be considered a nonparametric method. It was conceived with the hope that its nonparametric nature may be more useful against nonlinearity or complex interactions among predictor variables than existing non-probability sample estimation techniques. Visit the 2019 Annual Meeting in Calgary site for resources on the project.
Framework
Framework for Responsible Machine Learning Processes

Machine learning is becoming an increasingly integral part of many projects at Statistics Canada. Data scientists are looking to implement a responsible framework for machine learning and artificial intelligence applications that are transitioning to production. The framework includes an evaluation of the project through the use of a checklist, followed by a peer review of the project. As a final step, the methodology is presented to the Scientific Review Committee. The goal of this project is to establish a review process that ensures responsible machine learning processes are put into production while promoting good and ethical data science practices. This framework will also guide data scientists as they develop new projects.