
Quarterly Financial Report for the quarter ended September 30, 2023
Statement outlining results, risks and significant changes in operations, personnel and program
A) Introduction
Statistics Canada's mandate
Statistics Canada ("the agency") is a member of the Innovation, Science and Industry portfolio.
Statistics Canada's role is to ensure that Canadians have access to a trusted source of statistics on Canada that meets their highest priority needs.
The agency's mandate derives primarily from the Statistics Act. The Act requires that the agency collects, compiles, analyzes and publishes statistical information on the economic, social, and general conditions of the country and its people. It also requires that Statistics Canada conduct the census of population and the census of agriculture every fifth year and protects the confidentiality of the information with which it is entrusted.
Statistics Canada also has a mandate to co-ordinate and lead the national statistical system. The agency is considered a leader, among statistical agencies around the world, in co–ordinating statistical activities to reduce duplication and reporting burden.
More information on Statistics Canada's mandate, roles, responsibilities and programs can be found in the 2023-2024 Main Estimates and in the Statistics Canada 2023-2024 Departmental Plan.
The Quarterly Financial Report:
- should be read in conjunction with the 2023-2024 Main Estimates;
- has been prepared by management, as required by Section 65.1 of the Financial Administration Act, and in the form and manner prescribed by Treasury Board of Canada Secretariat;
- has not been subject to an external audit or review.
Statistics Canada has the authority to collect and spend revenue from other federal government departments and agencies, as well as from external clients, for statistical services and products.
Basis of presentation
This quarterly report has been prepared by management using an expenditure basis of accounting. The accompanying Statement of Authorities includes the agency’s spending authorities granted by Parliament and those used by the agency consistent with the Main Estimates for the 2023-2024 fiscal year. This quarterly report has been prepared using a special purpose financial reporting framework designed to meet financial information needs with respect to the use of spending authorities.
The authority of Parliament is required before moneys can be spent by the Government. Approvals are given in the form of annually approved limits through appropriation acts or through legislation in the form of statutory spending authority for specific purposes.
The agency uses the full accrual method of accounting to prepare and present its annual departmental financial statements that are part of the departmental results reporting process. However, the spending authorities voted by Parliament remain on an expenditure basis.
B) Highlights of fiscal quarter and fiscal year-to-date results
This section highlights the significant items that contributed to the net increase in resources available for the year, as well as actual expenditures for the quarter ended September 30.
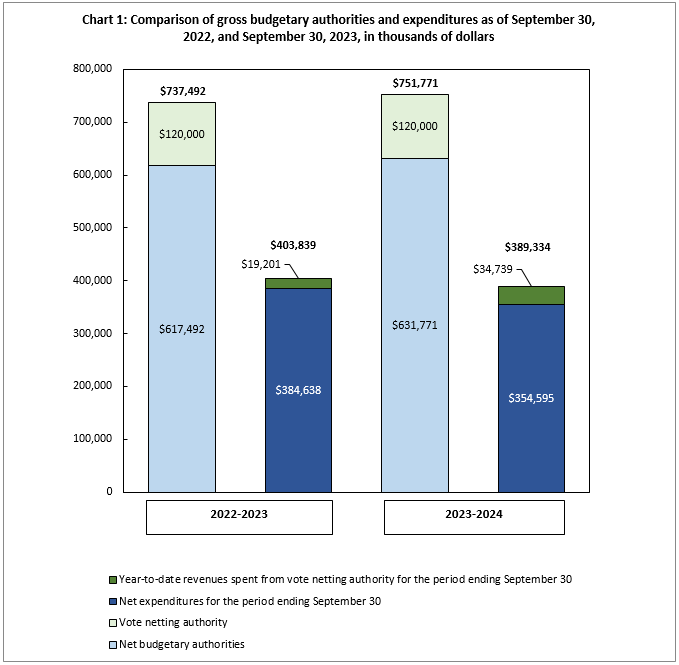
Description for Chart 1: Comparison of gross budgetary authorities and expenditures as of September 30, 2022, and September 30, 2023, in thousands of dollars
This bar graph shows Statistics Canada's budgetary authorities and expenditures, in thousands of dollars, as of September 30, 2022 and 2023:
- As at September 30, 2022
- Net budgetary authorities: $617,492
- Vote netting authority: $120,000
- Total authority: $737,492
- Net expenditures for the period ending September 30: $384,638
- Year-to-date revenues spent from vote netting authority for the period ending September 30: $19,201
- Total expenditures: $403,839
- As at September 30, 2023
- Net budgetary authorities: $631,771
- Vote netting authority: $120,000
- Total authority: $751,771
- Net expenditures for the period ending September 30: $354,595
- Year-to-date revenues spent from vote netting authority for the period ending September 30: $34,739
- Total expenditures: $389,334
Chart 1 outlines the gross budgetary authorities, which represent the resources available for use for the year as of September 30.
Significant changes to authorities
Total authorities available for 2023-24 have increased by $14.3 million, or 1.9%, from the previous year, from $737.5 million to $751.8 million (Chart 1). The net increase is mostly the result of the following:
-
An increase of $87.7 million for funding received to cover the initial planning phase and development activities related to the 2026 Census of Population and 2026 Census of Agriculture programs;
-
A decrease of $50.3 million for the 2021 Census of Population and 2021 Census of Agriculture programs due to cyclical nature of funding winding down;
-
A decrease of $28.9 million for the carry forward from the previous year. The agency leverages the operating budget carry-forward mechanism to manage the cyclical nature of program operations and investments in the agency’s strategic plan;
-
An increase of $1.3 million for salary increases related to the latest rounds of collective bargaining;
-
An increase of $17.1 million for various initiatives including Statistical Survey Operations Modernization, Dental Care for Canadians, Removing Barriers to Internal Trade, Building a World-Class Intellectual Property Regime and Taking More Action to Eliminate Plastic Waste;
-
A decrease of $12.2 million for various initiatives including Better Data for Better Outcomes, Strengthening Long-term Care and Supportive Care, Survey on the Official Language Minority Population, Supporting Access to Sexual and Reproductive Health Care Information and Services and Vision for a data-driven economy & society.
In addition to the appropriations allocated to the agency through the Main Estimates, Statistics Canada also has vote net authority within Vote 1, which entitles the agency to spend revenues collected from other federal government departments, agencies, and external clients to provide statistical services. The vote netting authority is stable at $120 million when comparing the second quarter of fiscal years 2022-2023 and 2023-2024.
Significant changes to expenditures
Year-to-date net expenditures recorded to the end of the second quarter decreased by $30 million, or 7.8% from the previous year, from $384.6 million to $354.6 million (see Table A: Variation in Departmental Expenditures by Standard Object).
Statistics Canada spent approximately 56.1% of its authorities by the end of the second quarter, compared with 62.3% in the same quarter of 2022-2023.
| Departmental Expenditures Variation by Standard Object: | Q2 year-to-date variation between fiscal year 2022-2023 and 2023-2024 |
|
|---|---|---|
| $'000 | % | |
| (01) Personnel | -12,098 | -3.4 |
| (02) Transportation and communications | 418 | 5.7 |
| (03) Information | -6 | -0.2 |
| (04) Professional and special services | 884 | 4.6 |
| (05) Rentals | -1,270 | -8.5 |
| (06) Repair and maintenance | -105 | -39.6 |
| (07) Utilities, materials and supplies | -101 | -26.8 |
| (08) Acquisition of land, buildings and works | 8 | - |
| (09) Acquisition of machinery and equipment | -1,654 | -71.7 |
| (10) Transfer payments | - | - |
| (12) Other subsidies and payments | -582 | -45.1 |
| Total gross budgetary expenditures | -14,506 | -3.6 |
| Less revenues netted against expenditures: | ||
| Revenues | 15,538 | 80.9 |
| Total net budgetary expenditures | -30,044 | -7.8 |
| Note: Explanations are provided for variances of more than $1 million. | ||
Personnel: The decrease is mainly due to spendings for seasonal, casual, and student salaries, offset by salary price increases from the ratification of collective agreements.
Rentals: The decrease is mainly due to a one-time invoice for a software licence paid in the first quarter of 2022-2023.
Acquisition of machinery and equipment: The decrease is mainly due to the purchase of computers in the first quarter of 2022-2023.
Revenues: The increase is mainly due to a timing difference in invoicing compared to last year.
C) Significant changes to operations, personnel and programs
In 2023-24, the following changes in operations, personnel and program activities are underway:
- The Census program is ramping down operations from the 2021 cycle and is in the planning phase for the 2026 Censuses of Population and Agriculture programs.
- Budget 2023 announced funding for new initiatives, such as, the Canadian Dental Care program and the Official Languages Action Plan.
- Budget 2023 announced a commitment to refocus government spending:
- Budget 2023 proposes to reduce spending on consulting, other professional services, and travel by roughly 15 per cent starting in 2023-24. The government will focus on targeting these reductions on professional services, particularly management consulting.
- Budget 2023 proposes to phase in a roughly 3 per cent reduction of eligible spending by departments and agencies by 2026-27.
- Statistics Canada is committed to effective management of its programs and services. In anticipation of the announcement of pending reductions, Statistics Canada launched a review in 2022 to identify efficiencies and reductions to programs or services.
D) Risks and uncertainties
Statistics Canada is addressing the issues and corresponding uncertainties raised in this Quarterly Financial Report through ongoing monitoring activities on its corporate risks and mitigation measures captured in the 2023-24 Corporate Risk Profile and at the program level.
Statistics Canada continues to pursue and invest in modernizing business processes and tools to maintain its relevance and maximize the value it provides to Canadians. To address uncertainties, the agency is implementing the Census of Environment, the Quality of Life Framework for Canada, the Disaggregated Data Action Plan and several other initiatives focused on leveraging modern methods and recent investments in a modern infrastructure to meet the evolving needs of users and remain relevant as an agency. The agency is also remaining vigilant to cyber threats and continuously ensuring the security regarding handling and processing of its data while supporting the use of modern methods with a functional digital infrastructure.
Statistics Canada requires a skilled workforce to achieve its objectives; however, it is difficult to compete with other organizations in the data ecosystem and the current labour market situation. In addition, it is imperative to continue focusing on having an accessible, equitable and inclusive workforce. To address uncertainties, Statistics Canada will create partnerships with other government departments, international organizations, and IT Industry partners to find innovative ways to collaborate on bridging gaps in digital skills and IT human resource shortfalls. The agency will continue promoting a strong workplace culture, a healthy work-life balance, foster values and ethics and advance on the Equity, Diversity and Inclusion Action Plan. In addition, it will focus on existing employees and continue its effort to achieve greater diversity and inclusion across its workforce and promote and support accessibility through the Accessibility, Accommodation and Adaptive Computer Technology (AAACT) trainings, GC Accessibility Passport, and other resources on the StatCan Internal Communications Network (ICN).
Statistics Canada continues its collaboration with federal partners to access IT services and support to realize its modernization objectives and to achieve the agency’s priority to build and adopt a complete enabling infrastructure through the reduction of duplicative solutions, optimization of the Cloud infrastructure, automation of manual processes and shifting to open-source language. To address uncertainties, the agency is working closely with its federal partners, while adhering to the agency's notable financial planning management practices, integrated strategic planning framework as well as strengthening its financial stewardship.
Approval by senior officials
Approved by:
Anil Arora, Chief Statistician
Ottawa, Ontario
Signed on: November 20th, 2023
Kathleen Mitchell, Chief Financial Officer
Ottawa, Ontario
Signed on: November 14th, 2023
Appendix
| Fiscal year 2023-2024 | Fiscal year 2022–2023 | |||||
|---|---|---|---|---|---|---|
| Total available for use for the year ending March 31, 2024Table note * | Used during the quarter ended September 30, 2023 | Year-to-date used at quarter-end | Total available for use for the year ending March 31, 2023Table note * | Used during the quarter ended September 30, 2022 | Year-to-date used at quarter-end | |
| in thousands of dollars | ||||||
| Vote 1 — Net operating expenditures | 542,313 | 150,956 | 317,147 | 537,525 | 179,361 | 344,655 |
| Statutory authority — Contribution to employee benefit plans | 89,458 | 18,724 | 37,448 | 79,967 | 19,992 | 39,983 |
| Total budgetary authorities | 631,771 | 169,680 | 354,595 | 617,492 | 199,353 | 384,638 |
|
||||||
| Fiscal year 2023-2024 | Fiscal year 2022–2023 | |||||
|---|---|---|---|---|---|---|
| Planned expenditures for the year ending March 31, 2024 | Expended during the quarter ended September 30, 2023 | Year-to-date used at quarter-end | Planned expenditures for the year ending March 31, 2023 | Expended during the quarter ended September 30, 2022 | Year-to-date used at quarter-end | |
| in thousands of dollars | ||||||
| Expenditures: | ||||||
| (01) Personnel | 636,127 | 178,240 | 342,460 | 616,003 | 183,705 | 354,558 |
| (02) Transportation and communications | 13,634 | 3,759 | 7,738 | 17,064 | 3,734 | 7,320 |
| (03) Information | 9,788 | 2,072 | 3,412 | 13,135 | 2,079 | 3,418 |
| (04) Professional and special services | 53,358 | 10,113 | 20,233 | 52,156 | 11,063 | 19,349 |
| (05) Rentals | 23,735 | 5,199 | 13,686 | 24,931 | 4,828 | 14,956 |
| (06) Repair and maintenance | 1,108 | 75 | 160 | 690 | 111 | 265 |
| (07) Utilities, materials and supplies | 1,861 | 201 | 276 | 2,523 | 162 | 377 |
| (08) Acquisition of land, buildings and works | 635 | 8 | 8 | 807 | - | - |
| (09) Acquisition of machinery and equipment | 11,460 | 221 | 653 | 10,115 | 734 | 2,307 |
| (10) Transfer payments | - | - | - | - | - | - |
| (12) Other subsidies and payments | 65 | 541 | 708 | 68 | 463 | 1,289 |
| Total gross budgetary expenditures | 751,771 | 200,429 | 389,334 | 737,492 | 206,879 | 403,839 |
| Less revenues netted against expenditures: | ||||||
| Revenues | 120,000 | 30,749 | 34,739 | 120,000 | 7,526 | 19,201 |
| Total revenues netted against expenditures | 120,000 | 30,749 | 34,739 | 120,000 | 7,526 | 19,201 |
| Total net budgetary expenditures | 631,771 | 169,680 | 354,595 | 617,492 | 199,353 | 384,638 |